4392
Proton Magnetic Resonance Spectroscopy of the Lipid Metabolic Response of a Murine Tumor Model to Radiation Therapy1Medical Physics, Cross Cancer Institute, Edmonton, AB, Canada, 2Oncology, University of Alberta, Edmonton, AB, Canada, 3Radiation Oncology, Dalhousie University, Halifax, NS, Canada, 4Medical Physics, QEII Health Sciences Centre, Nova Scotia Health Authority, Halifax, NS, Canada
Synopsis
The temporal dependence of the lipid metabolic response to single fraction radiation therapy of human glioblastoma multiforme xenografts in NIH III nude mice was assessed with in vivo 1H magnetic resonance spectroscopy (MRS) on a 9.4T magnetic resonance system. Lipid MRS can measure fat polyunsaturation, and therapeutic response can be monitored. The methylene:methyl peak ratio (CH2/CH3) can assess drug treatment and disease progression. Herein, lipid parameters and their response to radiotherapy in tumors are studied, including methyl, lactate + methylene, diallylic, and allylic protons, protons in α position to the carbonyl group, CH2/CH3, and mean polyunsaturation.
Purpose
In
this study, the temporal dependence of the lipid metabolic response to single
fraction radiation therapy of human glioblastoma multiform (GBM) xenografts in
NIH III nude mice was assessed with in
vivo 1H magnetic resonance spectroscopy
(MRS) on a 9.4T magnetic resonance (MR)
system. Adipose tissue content, measureable by MRS, depends on dietary fat
intake, and is related to cancer prevalence1, prognosis2 and
progression3,4. Lipid MRS has the ability to monitor in vivo polyunsaturated fatty acid (PUFA)
accumulation, associated with apoptosis in glioma5,6. Human studies have
used MRS to measure pre-cancerous lipid content7 and the effect of
omega-3 fatty acid supplementation8. Other parameters such as the ratio
of the methylene and methyl peaks (CH2/CH3) have been
studied in relation to drug treatment9 and disease progression10.
The objective
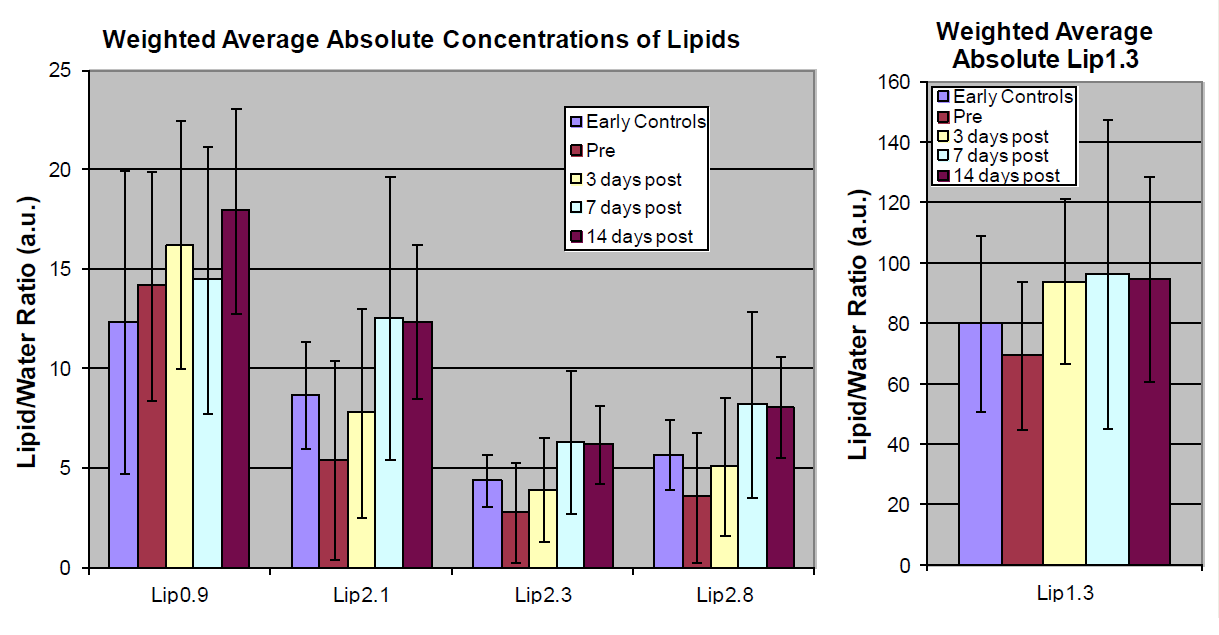
of this work is to explore methyl (Lip0.9) (abbreviated according to peak ppm),
lactate + methylene (Lip1.3), diallylic (Lip2.8), and allylic protons (Lip2.1),
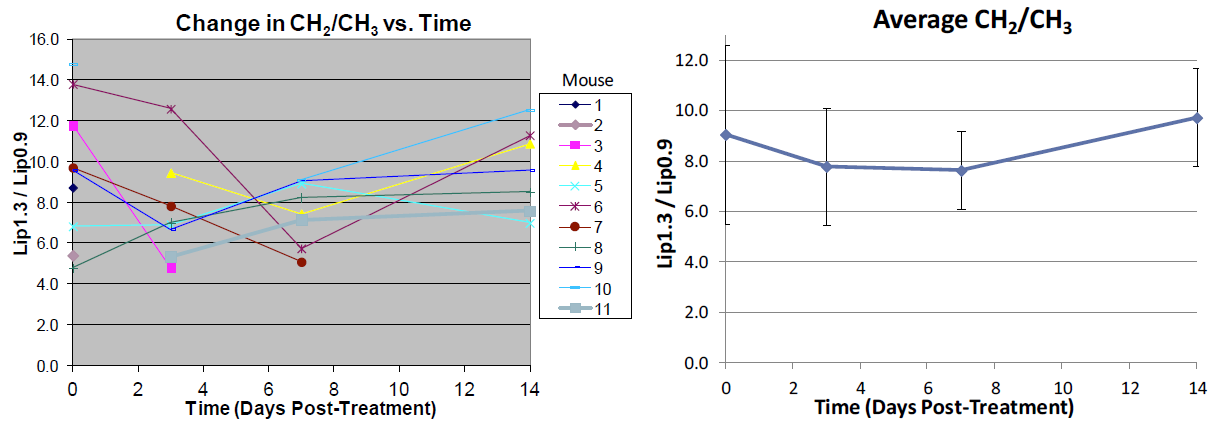
protons in α position to the carbonyl group (Lip2.3), CH2/CH3
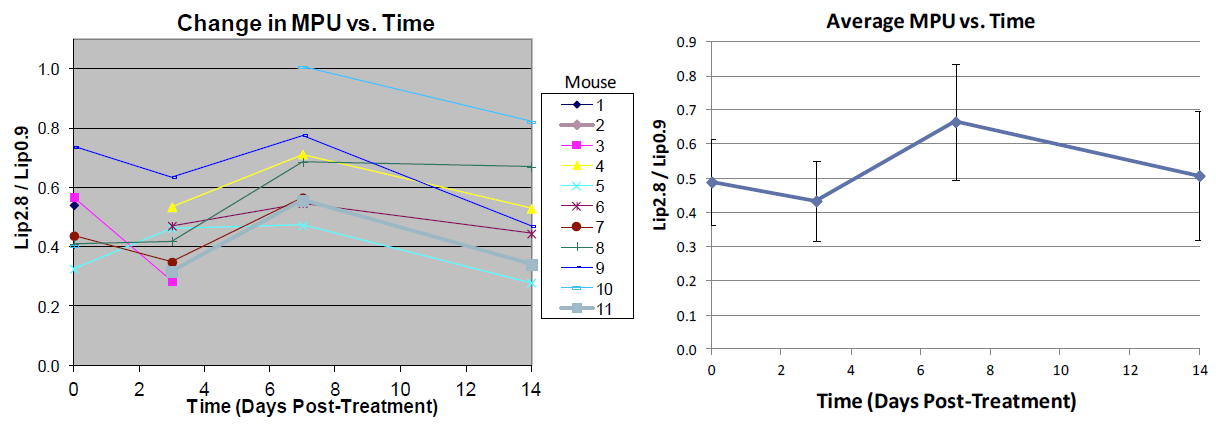
(Lip1.3/Lip0.9), and mean polyunsaturation (MPU) (Lip2.8/Lip0.9), and their response to
radiotherapy in GBM tumors.Methods
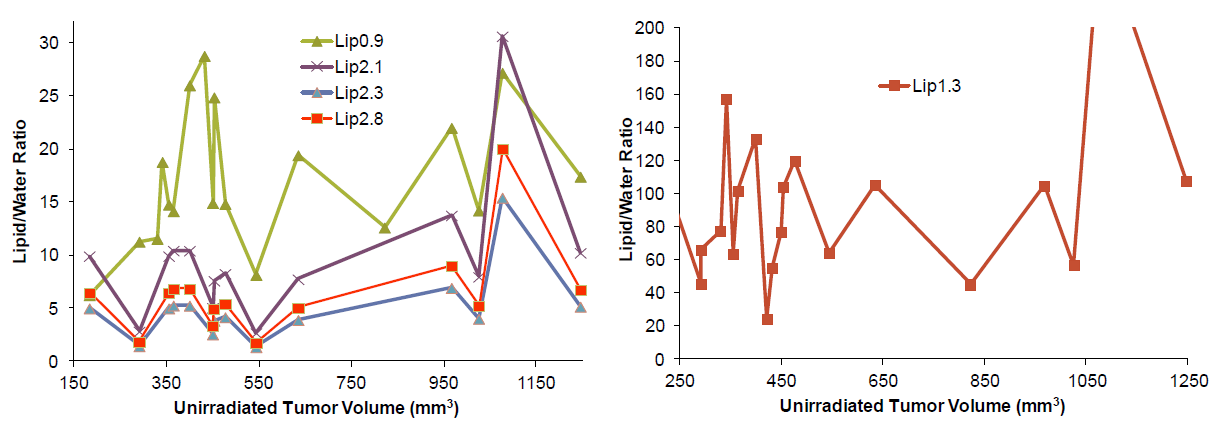
Human GBM cell line M006XLo tumors were grown in the thighs of NIH-III nude mice, and treated with 8 Gy x-rays. MR experiments used a 9.4 T/21.5 cm diameter magnet (Magnex Scientific, Oxford, UK) and a transmit/receive 25 mm surface radiofrequency (RF) coil. LCModel was used to extract lipid:water concentration ratios from 42 in vivo 1H spectra acquired from 11 treated mice, and 5 controls with untreated tumors. The 1H point resolved spectroscopy (PRESS) method was used to obtain signal from 27 µL volumes, TR = 3 s, TE1 = 12 ms, TE2 = 9 ms, 512 transients with 4 dummy repetitions, and phase cycling. The following lipid parameters were measured over time and quantified with LCModel: Lip0.9, Lip1.3, Lip2.1, Lip2.3, Lip2.8, MPU (Lip2.8/Lip0.9), and CH2/CH3. LCModel was used to quantify each lipid peak with a simulated lipid and macromolecule basis set. All quantities aside from MPU and CH2/CH3 were normalized with respect to water. Cramér-Rao lower bounds (CRLBs) were used to assess the spectral quality of the fit. Localization images used FOV = 35 × 35 mm2, 256 × 128 matrix, 1 mm slices, TR = 2 s, and TE = 29 ms. Unirradiated tumors had volumes 183-1246 mm3.Results
Post-treatment, Lip1.3, Lip2.1, Lip2.3, Lip2.8 increased, reaching maximum values at day 7 (Figure 1). Lip0.9 increased continually but dropped on day 7. Average MPU (Figure 2) and CH2/CH3 (Figure 3) showed a decrease on day 3, and MPU an increase on day 7, with the most statistically significant changes between days 3 and 7 for MPU, and 7 and 14 for both MPU and CH2/CH3 (p values). Unirradiated animal spectra showed no significant correlation between lipid:water concentrations and tumor volume (Figure 4). All peak areas had CRLBs less than 30%, with higher CRLBs excluded. Tumor volumes were, respectively, 640 ± 259, 851 ± 276, 936 ± 315, and 1029 ± 410 mm3, for pre-treatment and 3, 7, and 14 days post-treatment.Discussion
We report on the response to radiotherapy of lipid parameters (Lip0.9, Lip1.3, Lip2.1, Lip2.3, Lip2.8, MPU, CH2/CH3) in GBM tumors. Post-treatment these lipid:water ratios normalized to pre-treatment values were maximal at day 7: Lip2.1, Lip2.3, and Lip2.8, with Lip1.3 approximately constant after treatment. Average MPU and CH2/CH3 indicate an increase in polyunsaturation (Figure 2) and decrease of saturation (Figure 3) by day 7, and a reversal by day 14. CH2/CH3 behavior varies significantly at short time points post-irradiation, but by day 7, the variability is substantially decreased and the trend from day 7 to day 14 is significantly more robust compared to trends at early time points. Lipid:water ratios of unirradiated animals (controls plus pre-treatment) were approximately constant during tumor growth, in contrast to the treated animals. This indicates that the observed metabolic changes were a real response to radiation therapy. The implications of the perturbation of the lipid metabolic state of the tumor are not known and should be studied further.Conclusion
We have shown in a mouse model that the lipid content of human GBM cancer changes with single fraction radiation therapy, and this can be monitored with 1H MRS. After 8 Gy delivered as a single fraction, an increase in several lipid parameters including MPU was seen, with a maximum at day 7 post-treatment, and a decrease by day 14. This work could be a foundation for clinical studies using 1H MRS lipid biomarkers of cancer, for treatment planning, and intra- and post-treatment radiotherapy optimization based on therapeutic response.Acknowledgements
This work was completed with the support of the Cross Cancer Institute 9.4 T MR Laboratory. The authors gratefully acknowledge the work of Gail Hipperson, Dan McGinn, and Daming Li for help with animal handling and preparation.References
1. Psaltopoulou T, Kosti R I, Haidopoulos D, Dimopoulos M and Panagiotakos D B. Olive oil intake is inversely related to cancer prevalence: a systematic review and a meta-analysis of 13,800 patients and 23,340 controls in 19 observational studies. Lipids Health Dis. 2011;10(127):1-16.
2. Kaibori M, Ishizaki M, Iida H, Matsui K, Sakaguchi T, Inoue K, Mizuta T, Ide Y, Iwasaka J, KimuraY, Hayashi F, Habu D and Kon M. Effect of Intramuscular Adipose Tissue Content on Prognosis in Patients Undergoing Hepatocellular Carcinoma Resection. J Gastrointest Surg. 2015;19(7):1315-1323.
3. Lloyd J C, Masko E M, Wu C, Keenan M M, Pilla D M, Aronson W J, Chi J-T A and Freedland S J. Fish oil slows prostate cancer xenograft growth relative to other dietary fats and is associated with decreased mitochondrial and insulin pathway gene expression. Prostate Cancer Prostatic Dis. 2013;16(4):285-291.
4. Lee S-C, Poptani H, Pickup S, Jenkins W T, Kim S, Koch C J, Delikatny E J and Glickson J D. Early detection of radiation therapy response in non-Hodgkin’s lymphoma xenografts by in vivo 1H magnetic resonance spectroscopy and imaging. NMR in Biomed. 2010;23(6):624-632.
5. Hakumäki J M and Kauppinen R A. 1H NMR visible lipids in the life and death of cells. Trends Biochem Sci. 2000;25(8):357-362.
6. Hakumäki J M, Poptani H, Sandmair A-M, Ylä-Herttuala S and Kauppinen R A. 1H MRS detects polyunsaturated fatty acid accumulation during gene therapy of glioma: Implications for the in vivo detection of apoptosis. Nat Med. 1999:5(11):1323-1327.
7. Cheung J S, Fan S J, Gao D S, Chow A M, Yang J, Man K and Wu E X. In vivo lipid profiling using proton magnetic resonance spectroscopy in an experimental liver fibrosis model. Acad Radiol. 2010;18(3):377-383.
8. Cussons A J, Watts G F, Mori T A and Stuckey B G A. Omega-3 fatty acid supplementation decreases liver fat content in polycystic ovary syndrome: a randomized controlled trial employing proton magnetic resonance spectroscopy. J Clin Endocrinol Metab. 2011;94(10):3842-3848.
9, Schmitz J E, Kettunen M I, Hu D-E and Brindle K M. 1H MRS-Visible Lipids Accumulate During Apoptosis of Lymphoma Cells In Vitro and In Vivo. Magn Reson Med. 2005;54(1):43-50.
10. Corbin I R, Furth E E, Pickup S, Siegelman E S and Delikatny E J. In vivo assessment of hepatic triglycerides in murine non-alcoholic fatty liver disease using magnetic resonance spectroscopy. Biochim Biophys Acta. 2009;1791(8):757-763.
Figures