4388
Anomalous diffusion in cerebral gliomas assessed using a fractional motion model1Center for MRI Research, Peking University, Beijing, People's Republic of China, 2Department of Radiology, Beijing Tiantan Hospital, Capital Medical University, Beijing, People's Republic of China, 3Department of Radiology, Tongji Hospital, Tongji Medical College, Huazhong University of Science and Technology, Wuhan, People's Republic of China, 4MR Research China, GE Healthcare, Beijing, People's Republic of China, 5State Key Laboratory of Cognitive Neuroscience and Learning, Beijing Normal University, Beijing, People's Republic of China
Synopsis
Several models have been proposed to explain the anomalous diffusion in biological tissues. Among them, the fractional motion (FM) model was considered more appropriate. In this study, the FM model was applied in gliomas to assess its feasibility for grading gliomas. It was found that the FM model could improve the diagnostic accuracy in differentiation low- and high-grade gliomas, indicating the potential of the FM model to facilitate future studies of neuro-pathological changes in clinical populations.
Purpose
Diffusion MRI (dMRI) is being widely used in routine clinical imaging, especially in the detection of stroke and tumor1,2. Conventional dMRI is quantified using the mono-exponential model, which assumes a normal diffusion process. However, it has been shown that the diffusion-induced signal attenuation deviates from the mono-exponential form in biological tissues3. Several models, with parameters in addition to the conventional apparent diffusion coefficient (ADC)3, have been proposed to address this phenomenon. Among them, the fractional motion (FM) model was considered more appropriate to describe the diffusion processes in living cells4,5. The goals of this study are to demonstrate the feasibility of the FM model for describing anomalous diffusion in cerebral gliomas and to assess its potential for tumor grading.
Methods
A total of 22 patients with pathologically-verified gliomas were included in this study. According to the World Health Organization (WHO) criteria6, these patients were divided into low-grade (n=6; 1 females; mean age, 40.5±10.0 years; 4 WHO grade II astrocytic tumors and 2 WHO grade II oligoastrocytic tumors) and high-grade (n=16; 6 females; mean age, 43.9±12.0 years; 1 WHO grade III astrocytic tumor, 11 WHO grade IV astrocytic tumors, and 4 WHO grade III oligoastrocytic tumors) tumor groups.
The dMRI acquisition was performed on a 3T GE MR750 MRI scanner (GE Healthcare, Milwaukee, Wisconsin) equipped with an 8-channel head coil. Acquisition parameters were: TR/TE=3800ms/110ms; accelerating-factor=2; field-of-view=24cm×24cm; matrix size=128×128; slice thickness=5mm; and number-of-excitations=2. The diffusion gradient separation (Δ) was varied at 27.5, 40.0 and 55.5 ms consecutively. For each Δ value, the diffusion gradient amplitude (G0) was varied at 15.67, 19.68, 24.73, 31.06, 39.01 and 49.00 mT/m. The gradient duration (δ) was kept constant (20.4ms). Therefore, a total of 18 non-zero b-values were applied in one direction, ranging from 151 to 3482 s/mm2. The diffusion gradients were successively applied in three orthogonal directions (the x-axis, y-axis and z-axis). After correction for eddy current distortions and head motions using FSL7, the dMRI images were analyzed under the FM-based framework8 $$S/S_0=\exp(-\eta\cdot D_{\alpha,H}\cdot\gamma^\alpha G_0^\alpha\Delta^{\alpha+\alpha H})$$where Dα,H is the generalized diffusion coefficient and γ is the gyromagnetic radio. η is a dimensionless number that can be calculated as$$\begin{align}\eta =\frac{1}{{{(1+\mu )}^{\alpha }}} [ & \int_{0}^{\delta /\Delta }{{{\left| {{\left( \frac{\delta }{\Delta }+1-u \right)}^{1+\mu }}-{{\left( 1-u \right)}^{1+\mu }}-{{\left( \frac{\delta }{\Delta }-u \right)}^{1+\mu }} \right|}^{\alpha }}du} \\ &+\int_{\delta /\Delta }^{1}{{{\left| {{\left( \frac{\delta }{\Delta }+1-u \right)}^{1+\mu }}-{{\left( 1-u \right)}^{1+\mu }} \right|}^{\alpha }}du+\int_{1}^{1+\delta /\Delta }{{{\left( \frac{\delta }{\Delta }+1-u \right)}^{\alpha +\alpha \mu }}du}}] \end{align}$$ α, H and µ are the Noah exponent, the Hurst exponent and the memory parameter respectively, all of which characterize the FM model9,10. These FM-related parameters were calculated accordingly. In addition, ADC maps were also obtained using the images acquired at b-values of 0 and 950 s/mm2. All parameter maps were then directionally averaged to minimize the effect of diffusion anisotropy.
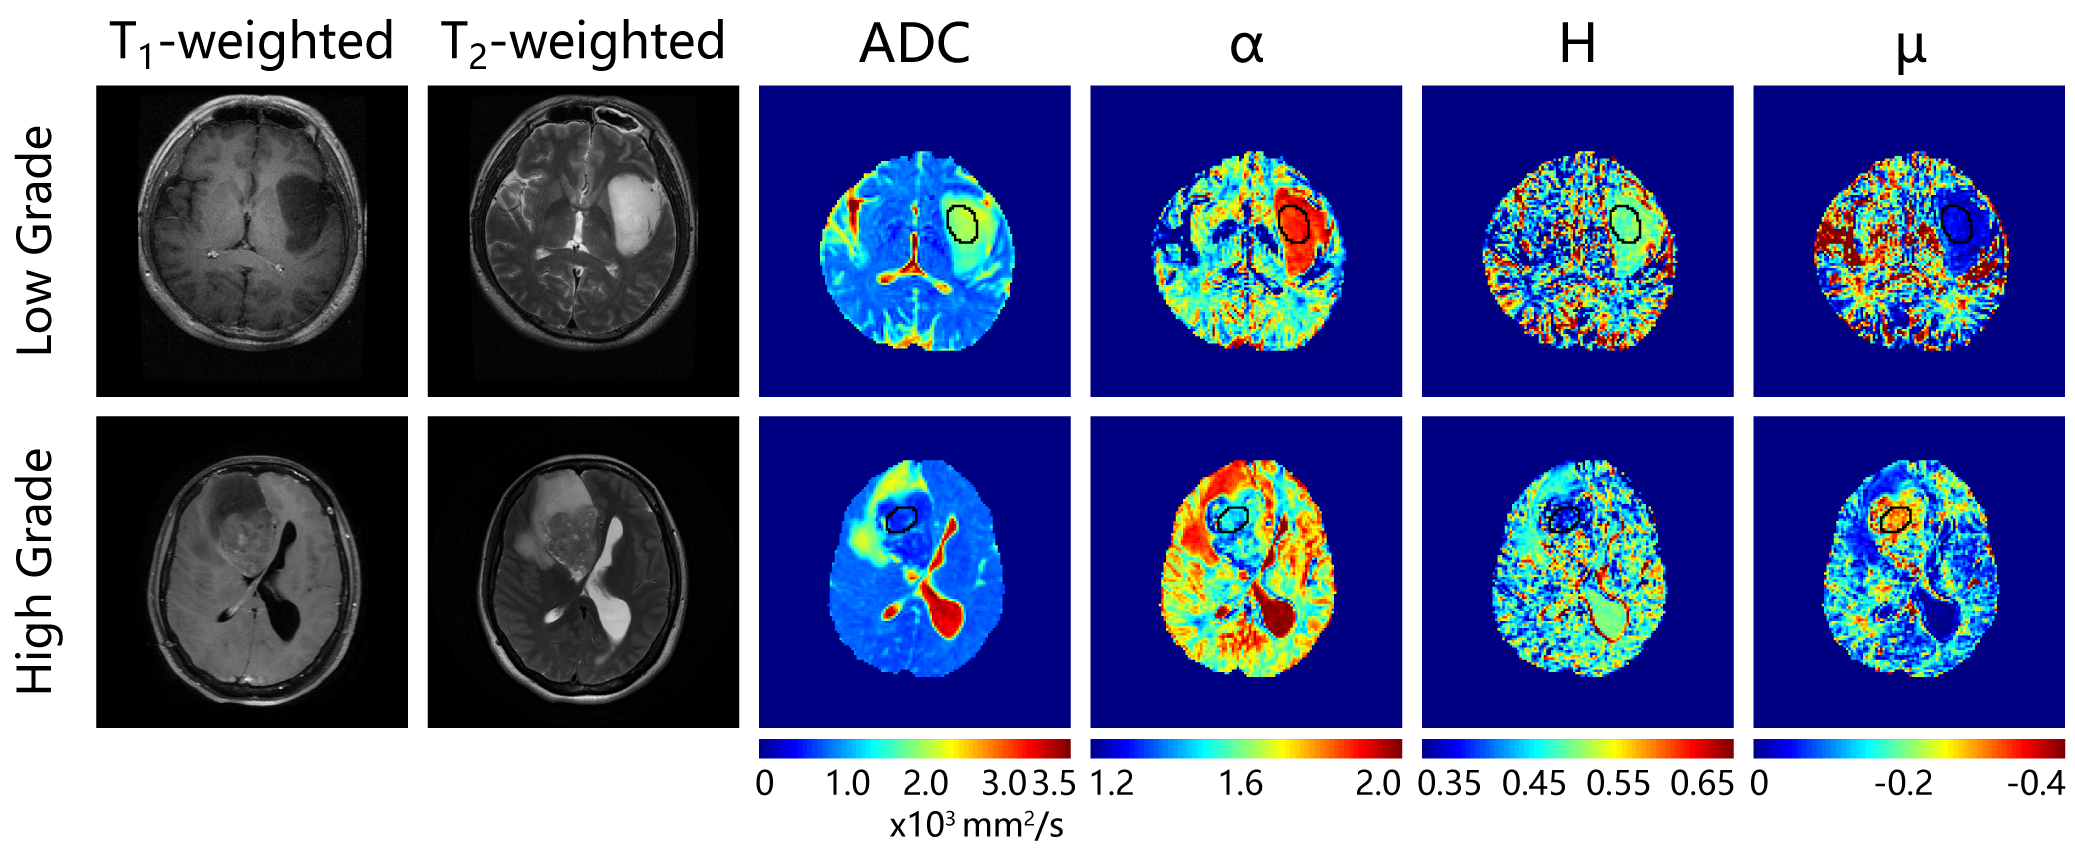
Two experienced radiologists manually drew the region of interests (ROI) for solid tumor and normal-appearing white matter (NAWM) regions on the b0 images, with reference of contrast-enhanced T1-weighted images and T2-weighted images. The NAWM ROI was drawn in contralateral normal-appearing centrum semiovale to the tumor ROI, with the same size. The mean values of the estimated ADC, α, H and µ were calculated over the selected ROIs and compared between low- and high-grade gliomas using a two-sample t-test. Receiver operating characteristic (ROC) curves were generated to assess the sensitivity and specificity in differentiating low- and high-grade gliomas.
Results
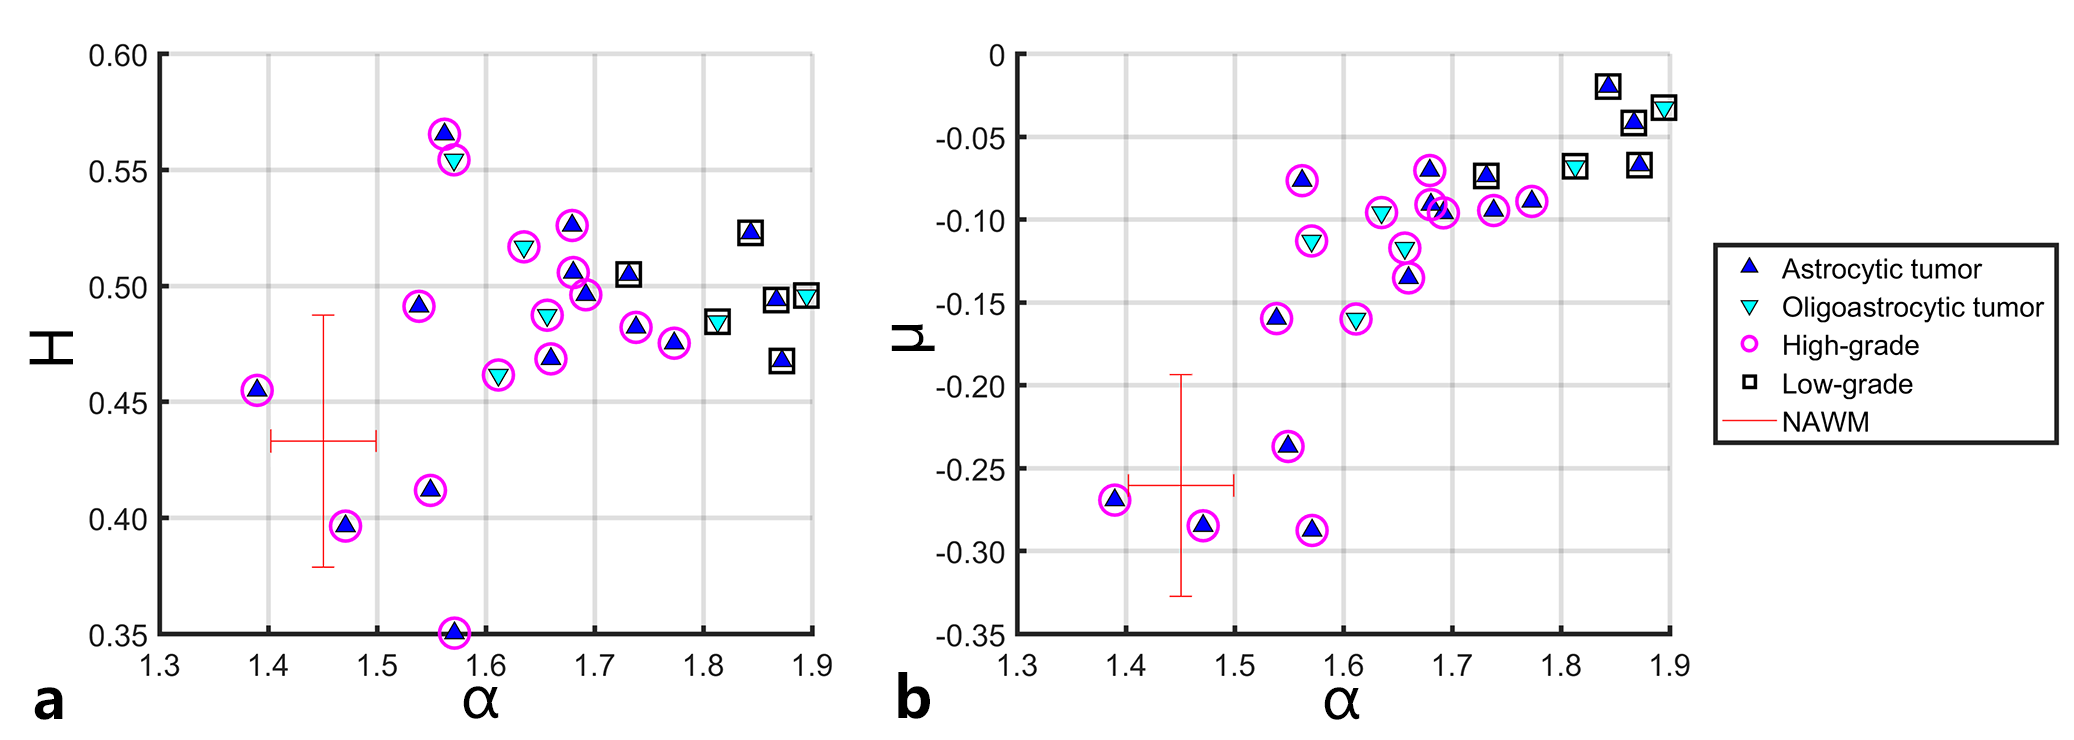
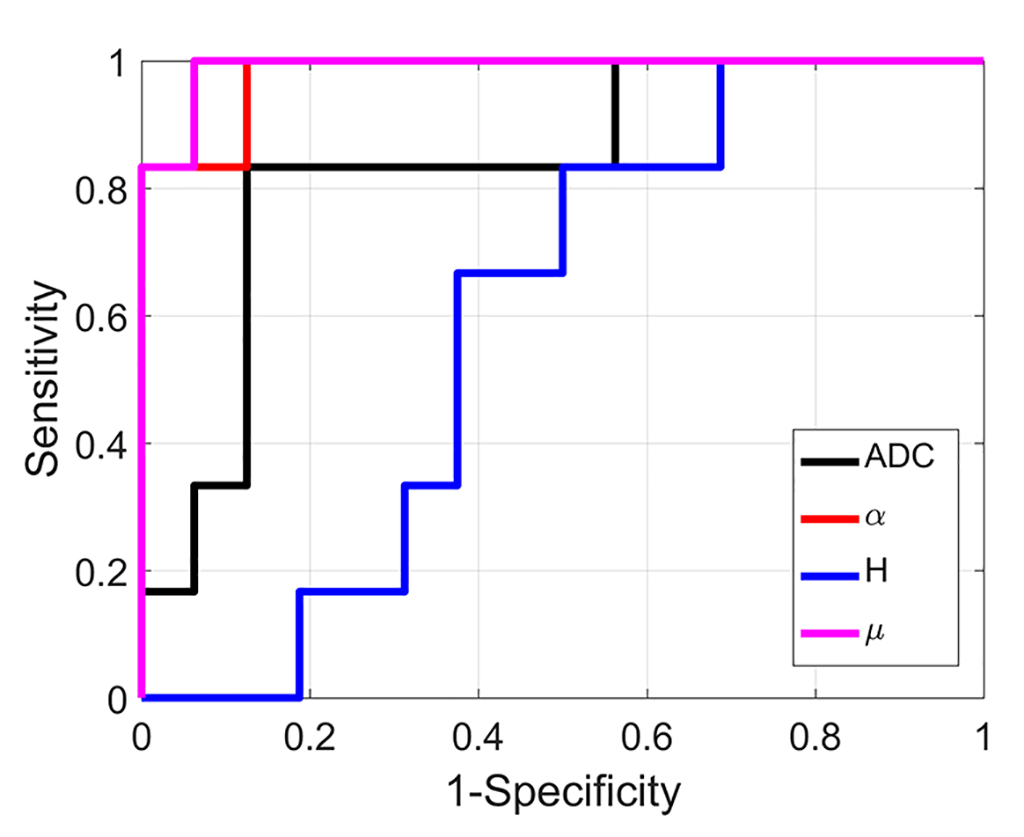
Anatomical images and the obtained parametric diffusion maps of two representative patients are shown in Figure 1. The α, H and μ maps show clear delineation of tumor lesions from normal tissues. Figure 2 displays scatter diagrams of α vs H and µ. It is seen that the tumor lesions and NAWM can be readily separated. Moreover, significant differences can be observed between low- and high-gliomas for the mean α (P-value<0.0001), μ (P-value<0.01) and ADC (P-value<0.05), whereas H failed to differentiate these two groups (P-value=0.48). Figures 3 displays the ROC curves calculated from the mean values of all tumor ROIs. It can be seen that larger AUCs were obtained with α (AUC=0.98) and μ (AUC=0.99) compared with ADC (AUC=0.83); H exhibited the smallest AUC (AUC=0.59).Discussion and Conclusion
In this study, the anomalous diffusion described by FM model in gliomas is investigated. The results indicated that the anomalous diffusion parameters may be used for grading of gliomas, and α and µ showed better performance as compared to ADC. Although the direct voxel-wise radiologic-pathologic correlation should be further explored, the use of anomalous diffusion may offer distinctive information on the diagnosis and grading of glioma tumor.Acknowledgements
No acknowledgement found.References
1. Iima M, Le Bihan D. Clinical Intravoxel Incoherent Motion and Diffusion MR Imaging: Past, Present, and Future. Radiology 2015;278:13–32.
2. Padhani AR, Liu G, Mu-Koh D, et al. Diffusion-Weighted Magnetic Resonance Imaging as a Cancer Biomarker: Consensus and Recommendations. Neoplasia N Y N 2009;11:102–25.
3. De Santis S, Gabrielli A, Palombo M, et al. Non-Gaussian diffusion imaging: a brief practical review. Magn Reson Imaging 2011;29:1410–6.
4. Magdziarz M, Weron A, Burnecki K, et al. Fractional Brownian Motion Versus the Continuous-Time Random Walk: A Simple Test for Subdiffusive Dynamics. Phys Rev Lett 2009;103:180602.
5. Szymanski J, Weiss M. Elucidating the Origin of Anomalous Diffusion in Crowded Fluids. Phys Rev Lett 2009;103:38102.
6. Louis DN, Ohgaki H, Wiestler OD, et al. The 2007 WHO Classification of Tumours of the Central Nervous System. Acta Neuropathol (Berl) 2007;114:97–109.
7. Smith SM, Jenkinson M, Woolrich MW, et al. Advances in functional and structural MR image analysis and implementation as FSL. NeuroImage 2004;23, Supplement 1:S208–19.
8. Fan Y, Gao J-H. Fractional motion model for characterization of anomalous diffusion from NMR signals. Phys Rev E 2015;92:12707.
9. Eliazar II, Shlesinger MF. Fractional motions. Phys Rep 2013;527:101–29.
10. Burnecki K, Weron A. Fractional L’evy stable motion can model subdiffusive dynamics. Phys Rev E 2010;82:21130.
Figures