4385
Robust and Efficient Perfusion Parameter Estimation for DCE-MRI of the Prostate Utilizing the Variable Projection (VARPRO) Method1Biomedical Engineering and Physiology, Mayo Graduate School, Rochester, MN, United States, 2Radiology, Mayo Clinic, Rochester, MN, United States, 3Radiology, Mayo Clinic, Scottsdale, AZ, United States, 4Urology, Mayo Clinic, Rochester, MN, United States
Synopsis
Dynamic contrast enhanced-MRI is essential for assessment of tissue microvasculature, and thus improved methods of parameter estimation for evaluation of tissue perfusion can be valuable. This work demonstrates how application of Variable Projection (VP) in perfusion analysis increases the robustness and computation efficiency compared to the conventional Levenberg-Marquardt (LM) method. A numeric simulation is used to validate the perfusion estimation and evaluate the robustness with respect to noise. The computation speed of VP is shown to be improved about 5× faster compared to LM method. VP-based perfusion analysis is demonstrated in eight patients with known prostate cancer.
Purpose
The purpose of this work is to show how non-linear least-square (NLLS) estimation of perfusion parameters in dynamic-contrast-enhanced (DCE) MRI can be made more robust and efficient by use of the Variable Projection (VARPRO, VP)1 dimensionality reduction method. The noise sensitivity and computation efficiency of the standard and proposed NLLS fitting methods are demonstrated for both numeric simulations and in clinical prostate imaging.Methods
The general hypothesis in DCE-MRI is that parametric descriptors of contrast pharmacokinetics serve as biomarkers of malignancy. Presuming Tofts’2 compartment model of perfusion, the transfer constant, Ktrans (min-1), is proportional to the peak of the enhancement curve, and the rate constant, kep (min-1), measures the contrast wash-out rate, with cancerous tissues generally having higher values. The multiple perfusion parameters are traditionally estimated simultaneously by fitting the data to a model via multi-dimensional linear or non-linear regression, such as with the Levenberg-Marquardt (LM) method3. As an alternative, we previously showed how 2D optimization of Ktrans and kep can be simplified to a 1D line search4 via the VARPRO method which significantly improves computational performance. In this work, we compare the computation speed and noise sensitivity of the VP and LM methods, and demonstrate the application of VP-based strategy to prostate DCE-MRI.
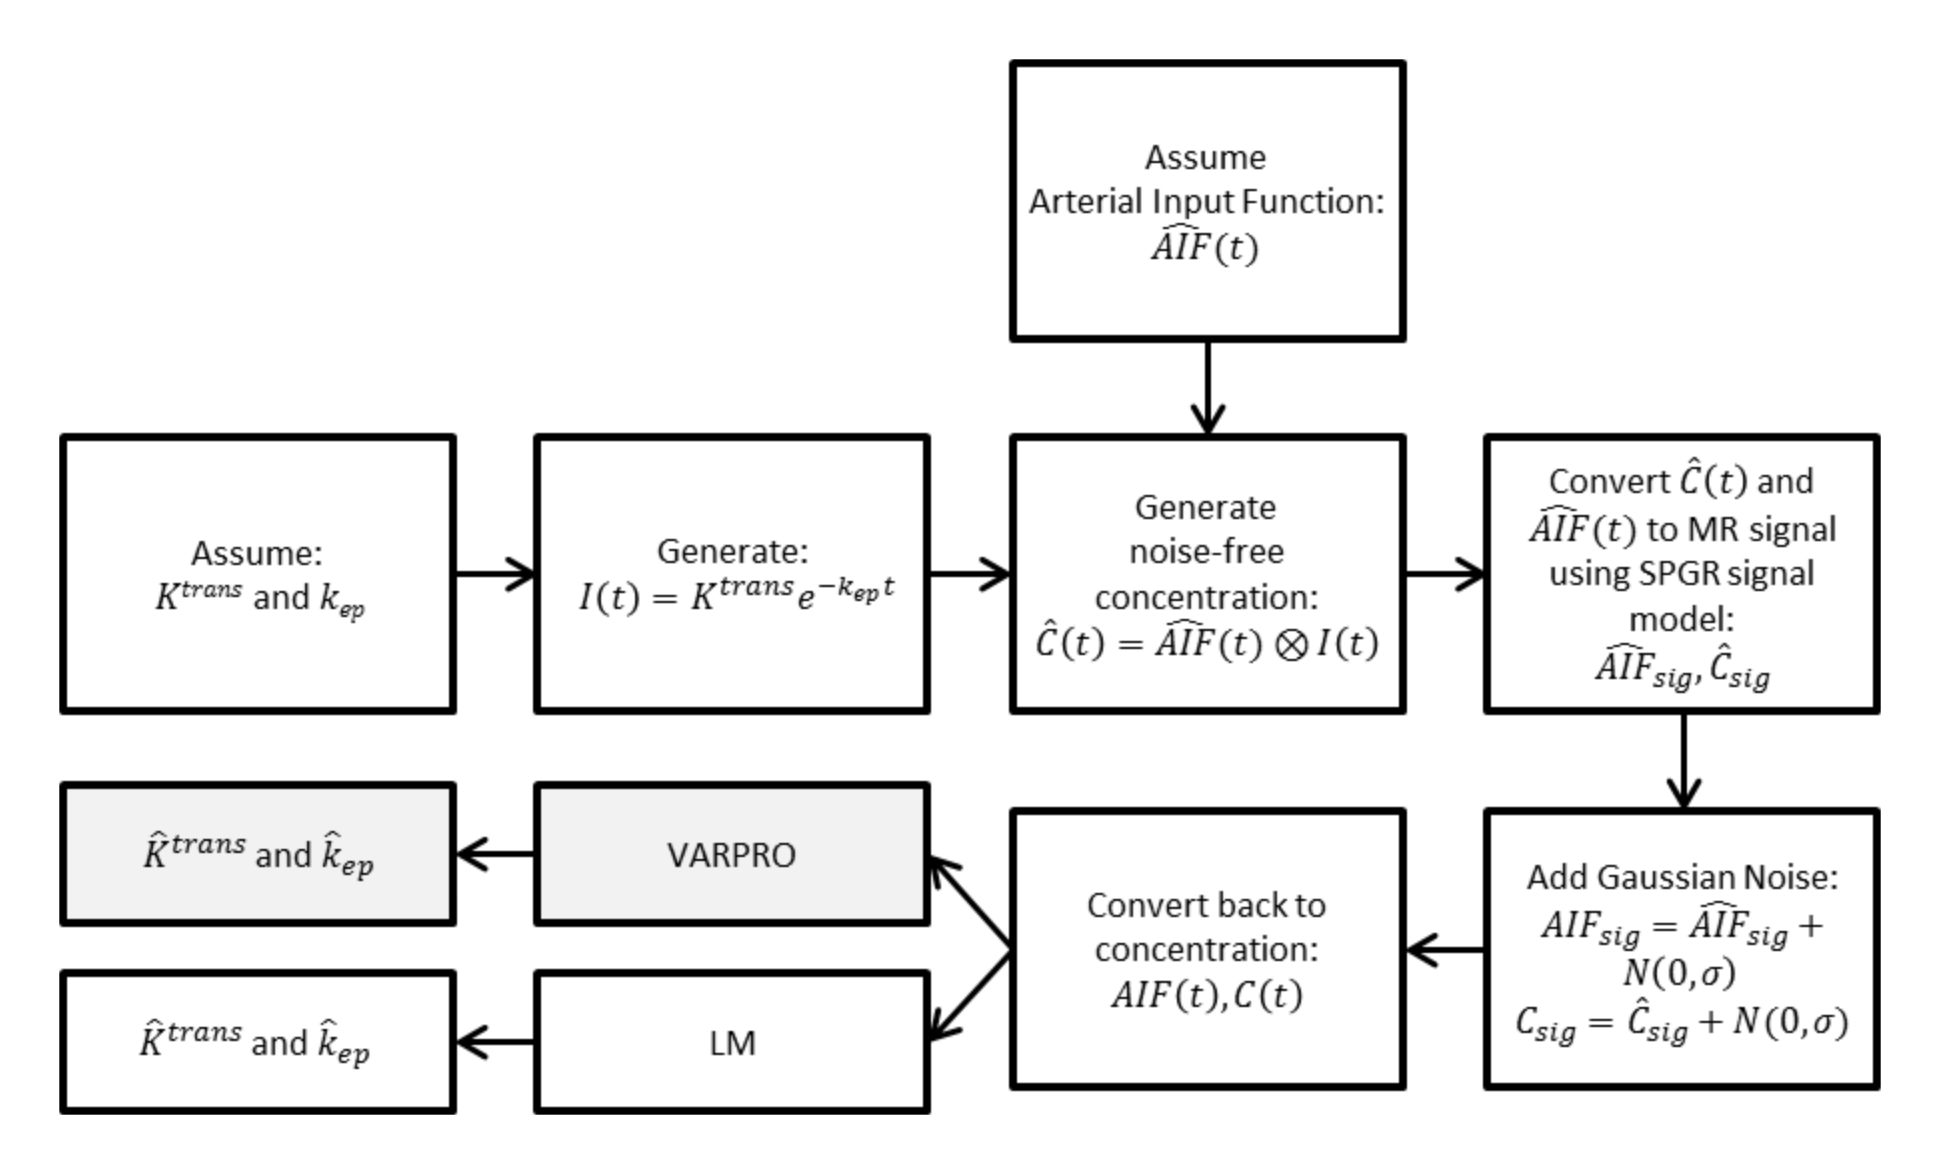
To validate the accuracy and precision of VP-based perfusion estimation, a numeric simulation was developed as described schematically in the flowchart in Figure 1. Thirty-one time frames with 6.6sec sampling were assumed, matching our clinical protocol. Tissue perfusion was simulated according to Tofts’ model with assumed values of Ktrans, kep, and the population-based (Parker5) arterial input function (AIF). Simulated MRI signals were then generated from these tissue and arterial contrast concentration curves with the spoiled gradient echo (SPGR) signal model6. To approximate the statistical properties of magnitude MR images, zero-mean Gaussian noise was added to the simulated signals (AIF and tissue)7 which were then converted back into concentration curves for perfusion analysis using both VP and LM techniques. This was performed for nine different (Ktrans,kep) combinations for each of six different noise levels which spanned that observed clinically. Monte Carlo simulation was repeated 500 times for each combination. The median and observed values from VP and LM were then tabulated and compared.
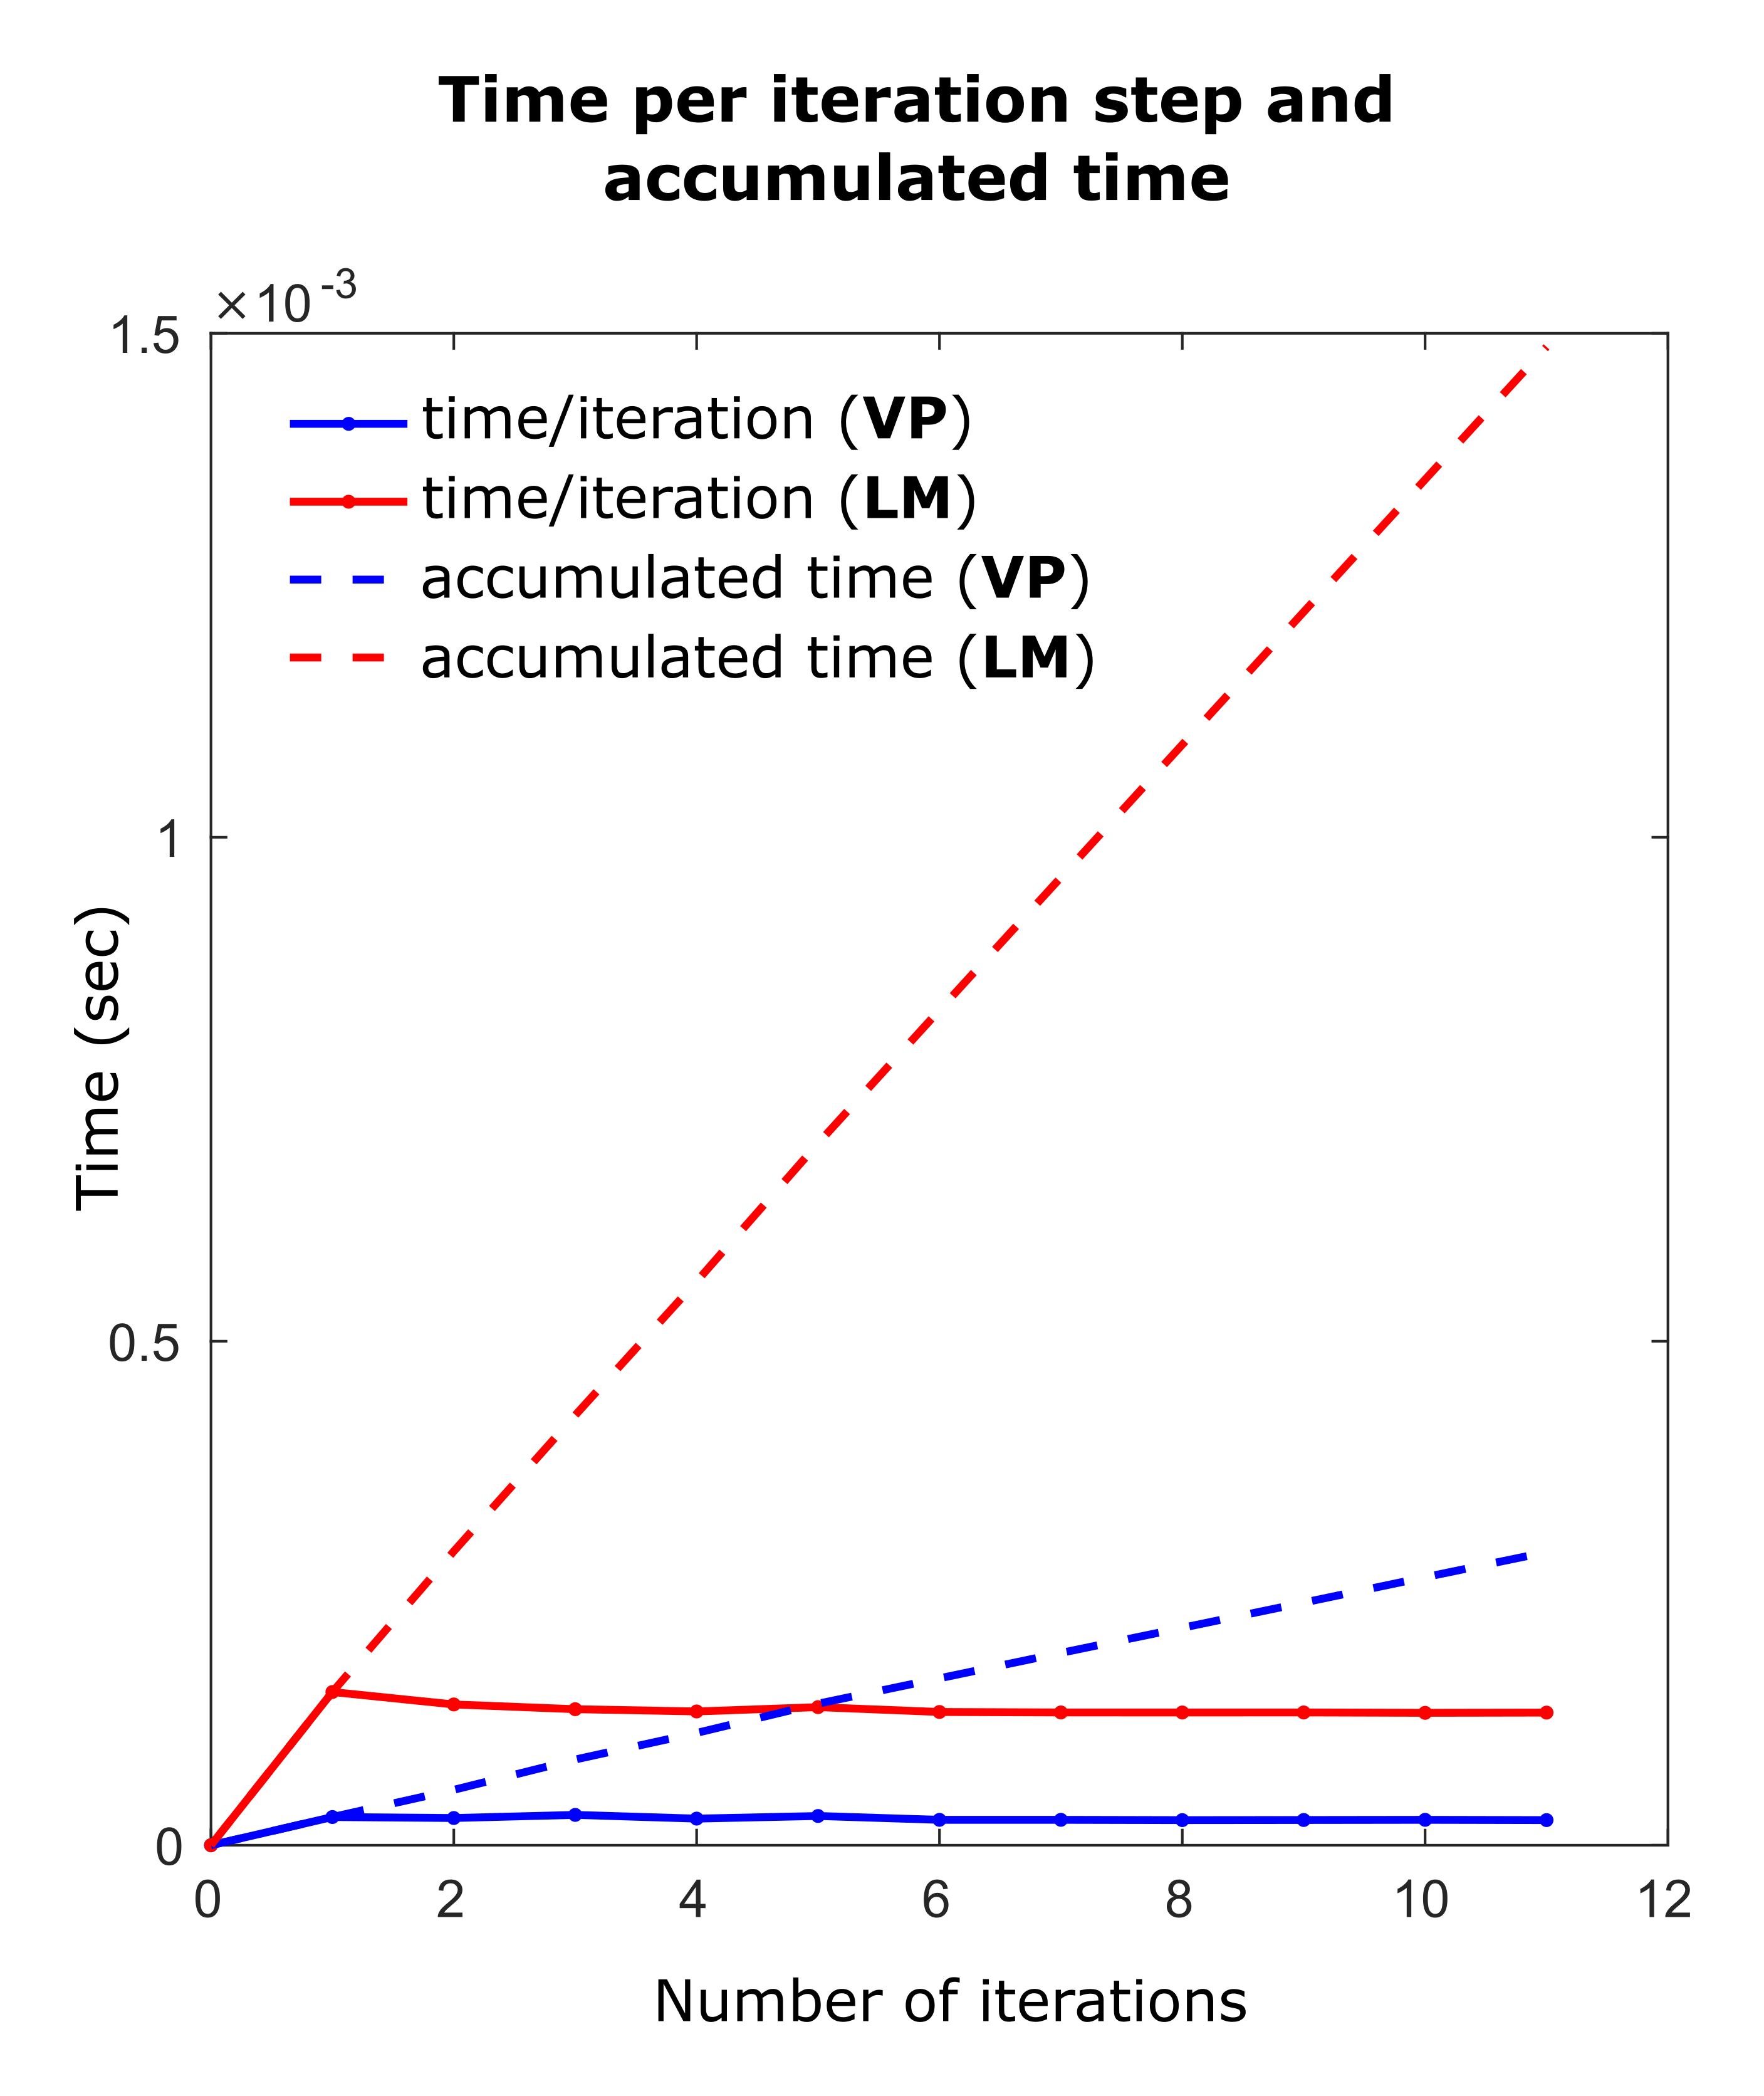
To compare the computational efficiency of VP with LM, the perfusion analysis of ten voxels selected from a mix of cancerous and normal tissue of a clinical data, were analyzed repeatedly for 500 times and the average time-per-iteration and the average accumulated time were plotted vs. number of iteration steps.
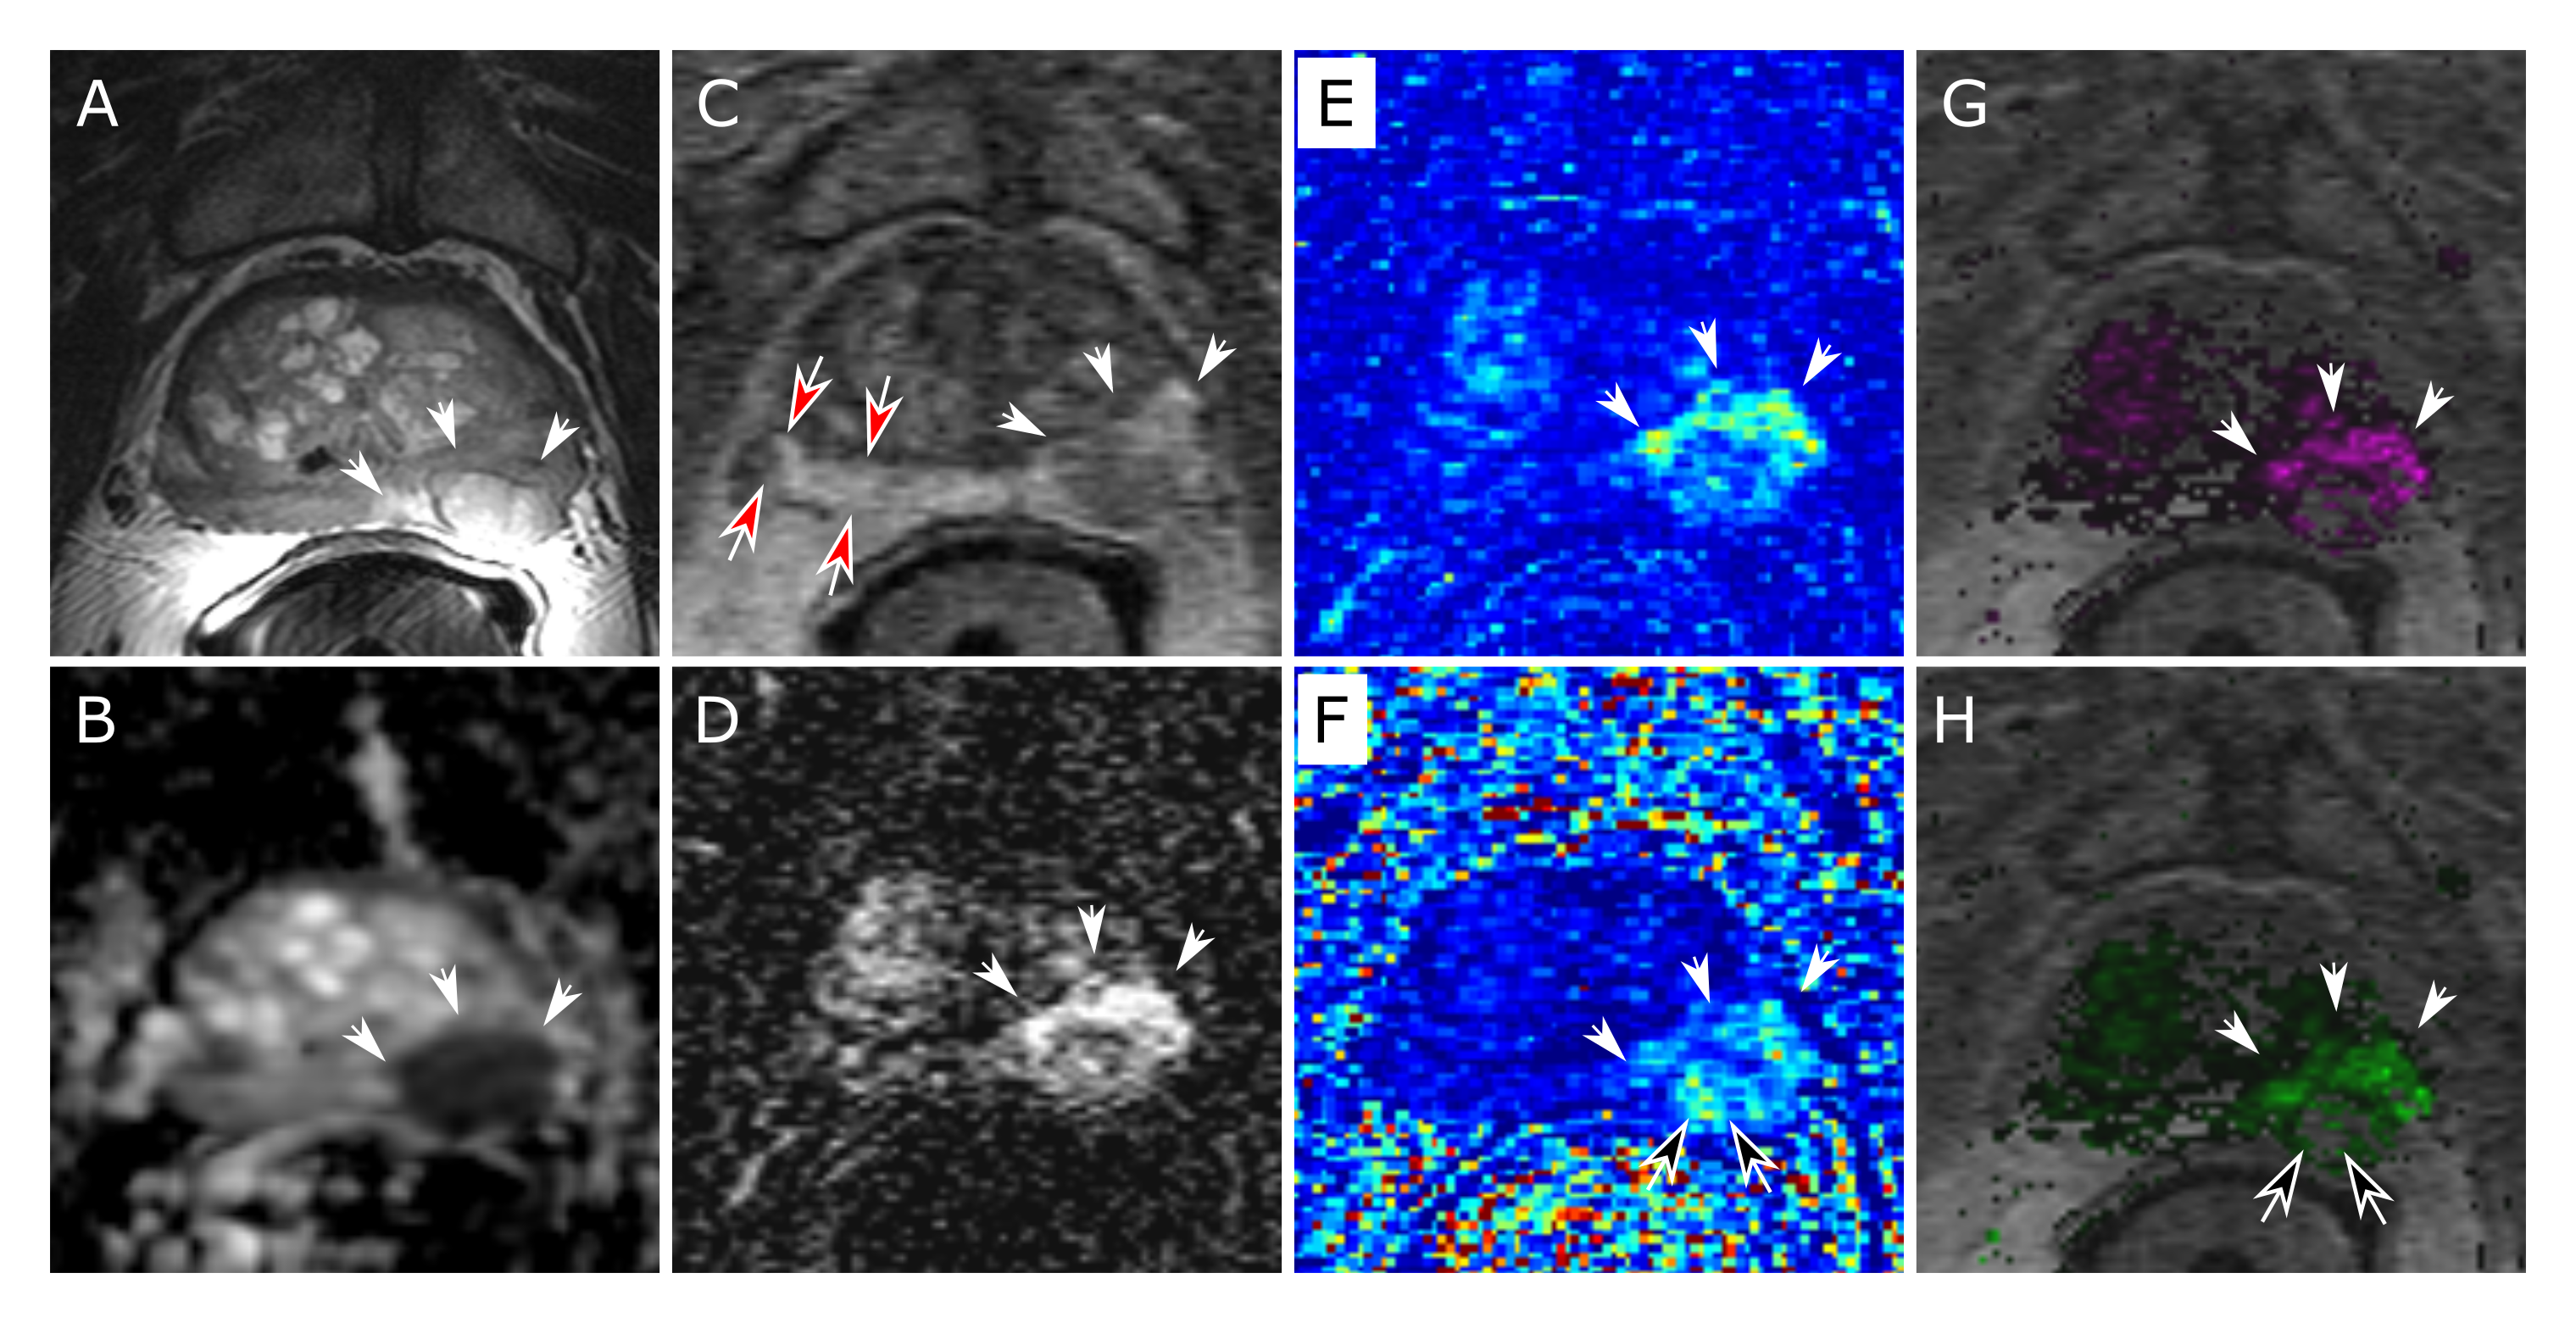
Additionally, we applied the perfusion analysis to eight consecutive patients with known prostate cancer as verified by histology post-prostatectomy. Maps of Ktrans and kep generated by VP were compared to those from a commercial package (DynaCAD v3.3, InVivo) using multi-dimensional processing. Results were also compared to T2-weighted spin-echo (T2SE) and diffusion-weighted images (DWI) for portrayal of pathology.
Results
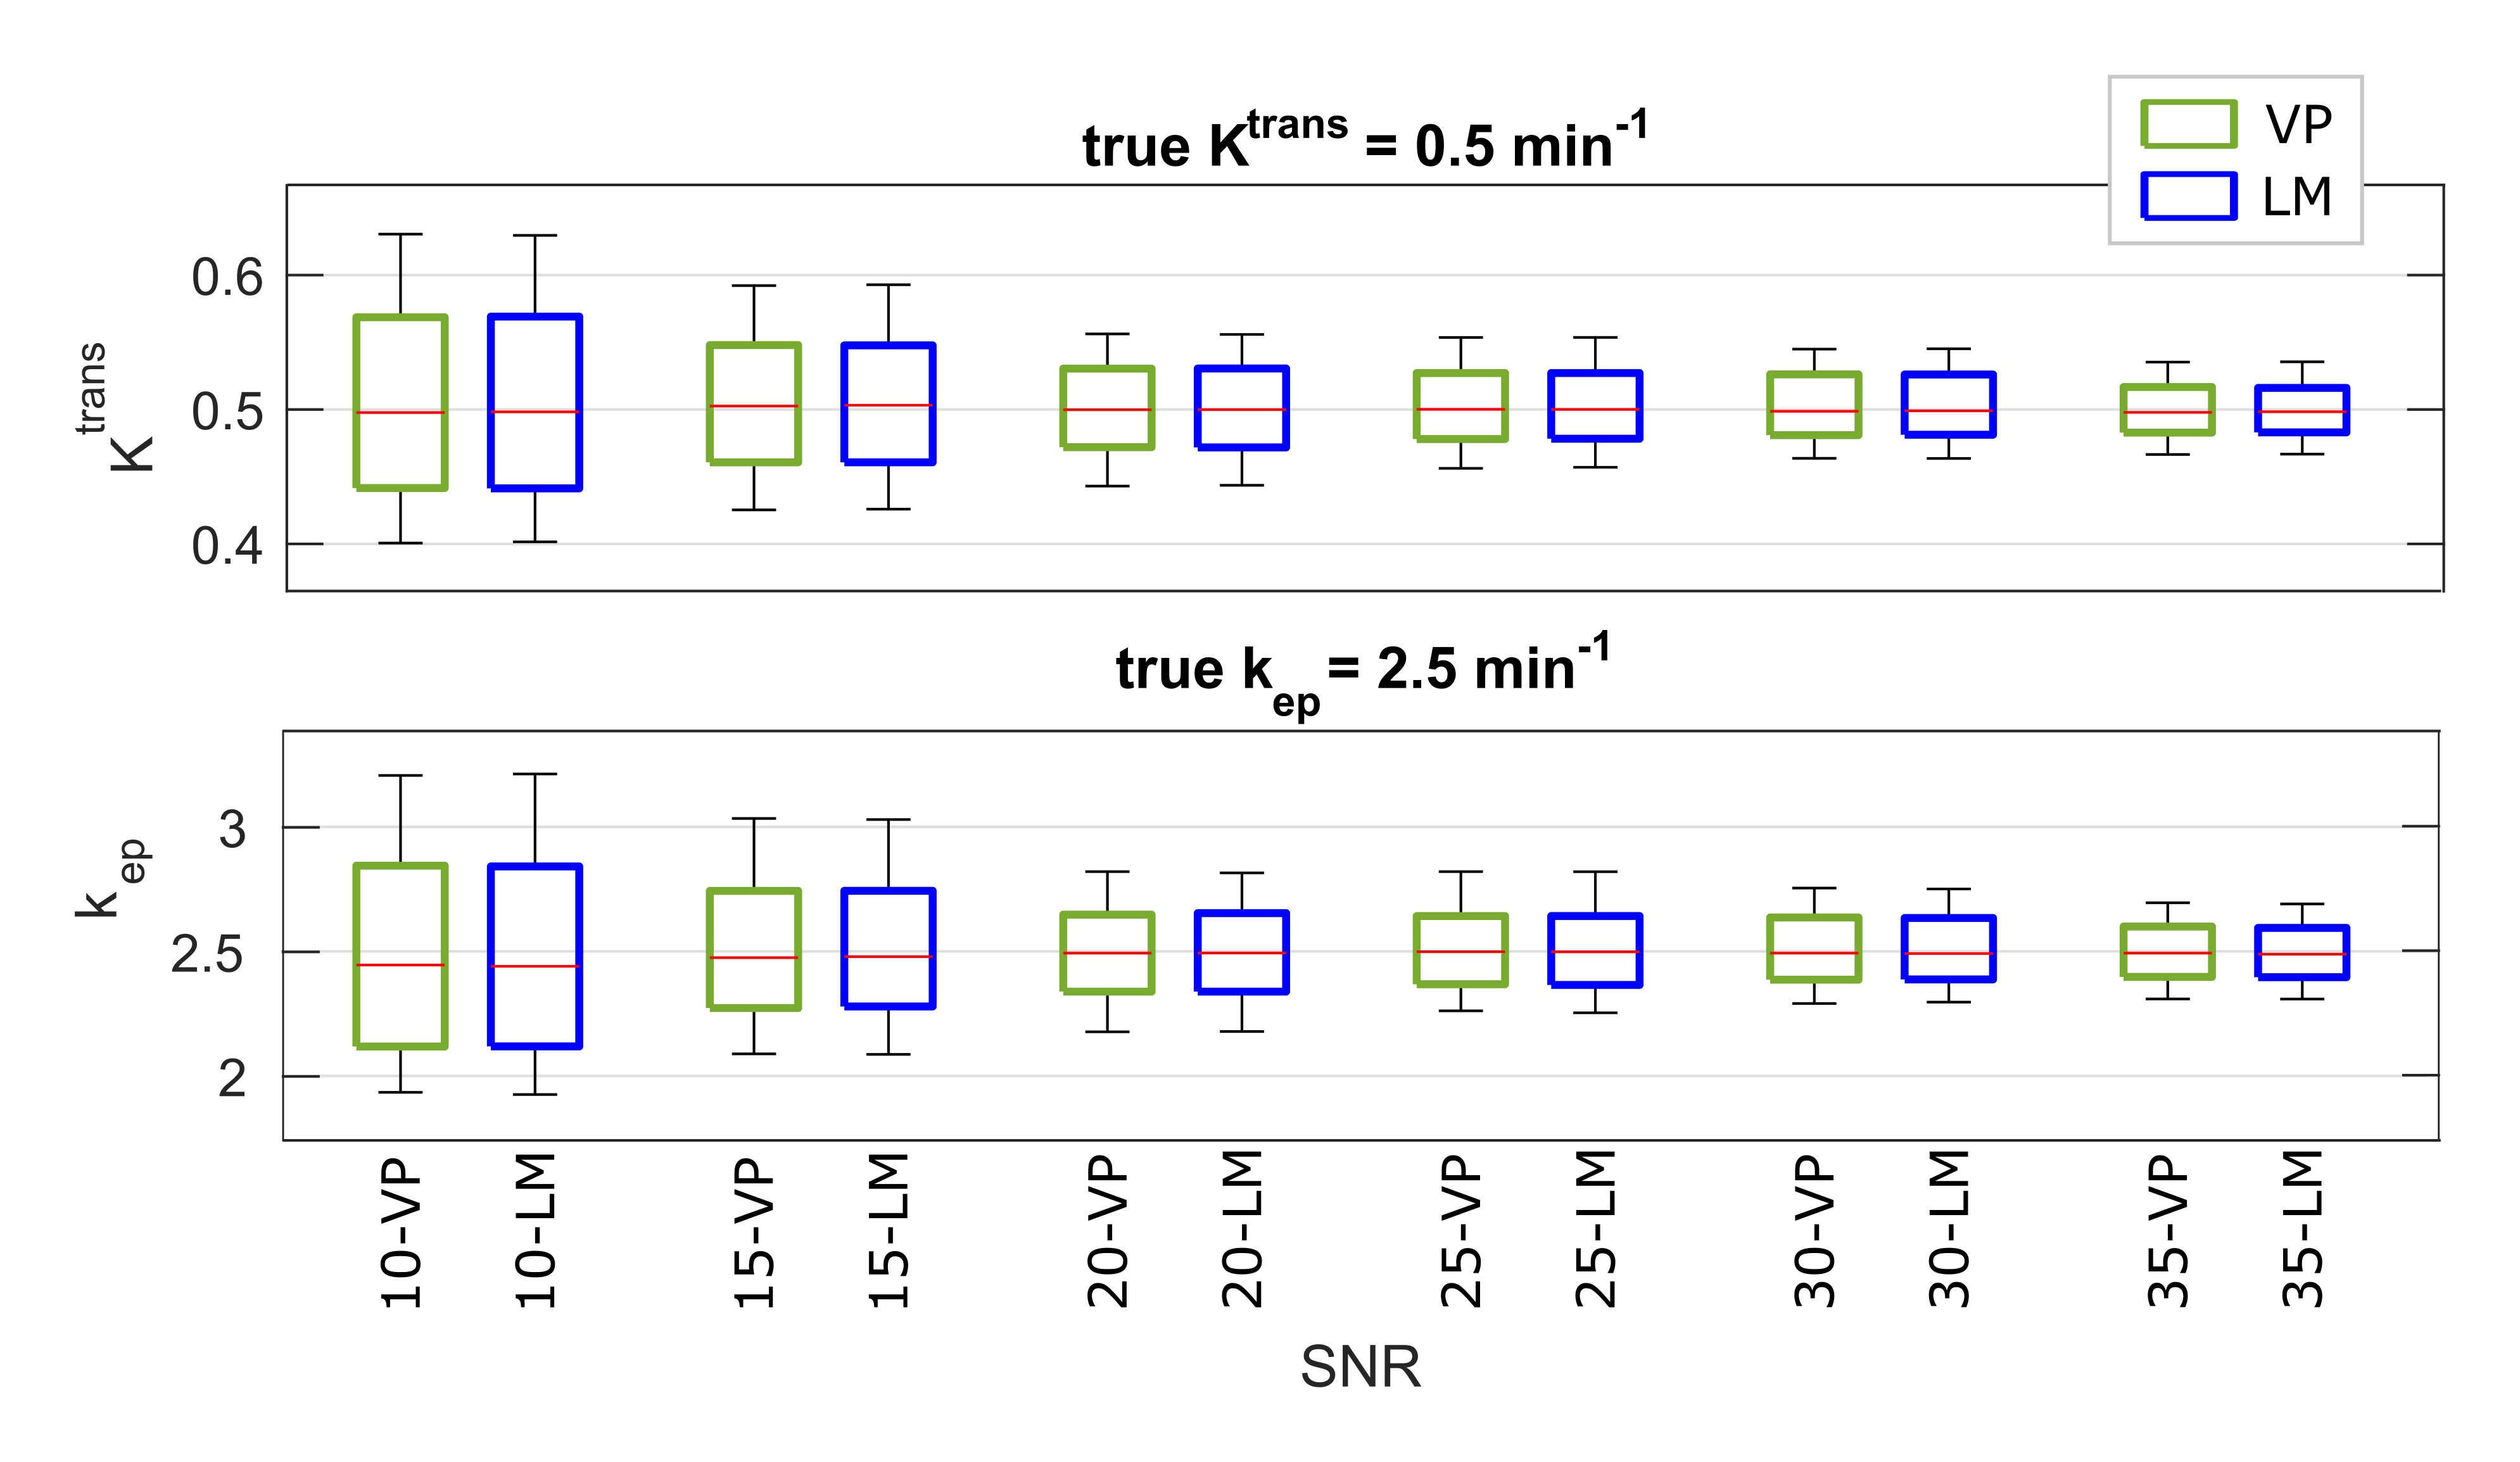
The numeric simulation results for one representative case (Ktrans=0.5min-1, kep=2.5min-1) are shown in Figure 2 for VP and LM vs. SNR level. In the box-and-whisker plots, the box depicts the median, first, and third quartiles, and the whiskers mark the 10th and 90th percentiles across the 500 iterations. VP and LM are both accurate in that the medians well match the assumed (Ktrans,kep) values across all but the lowest SNR, where mild underestimation bias was observed. Further, VP shows similar noise sensitivity to LM with comparable precision at all SNRs. As expected, the variance of both estimation results varied inversely with image SNR. Similar findings were observed for all 54 (Ktrans,kep) combinations.
Figure 3, depicting the average time-per-iteration and accumulated times for both VP and LM for one (out-of-ten) representing voxel, illustrates that the VP method is (5.2× in average for ten analyzed voxels) computationally more efficient than the LM method.
As shown in Figure 4, the perfusion maps of the prostate gland generated by VARPRO agree with those from DynaCAD and are consistent with the radiological findings from T2SE and DWI images. This was seen in all eight clinical cases. No perceivable artifact associated with VP was present.
Discussion and Conclusion
Non-linear least squares-based perfusion estimation for prostate MRI using VARPRO-based strategy is accurate, robust to noise, and computationally about 5× more efficient than LM-based method and agrees with the radiological interpretations.
As demonstrated through numerical simulation, VP-based perfusion parameter estimation exhibits noise robustness comparable to the standard LM algorithm, when the latter is optimally initialized and appropriately terminated.
In summary, VARPRO-based perfusion parameter estimation offers substantial computational advantage over traditional NLLS fitting algorithms without loss of noise robustness.
Acknowledgements
I would like to acknowledge the funding from Biomedical Engineering and Physiology department, Mayo Graduate School, NIH (EB000212, RR018898), and DOD (W81XWH) grants that have supported this research.References
1. Golub GH, Pereyra V. The differentiation of pseudo-inverses and nonlinear least squares problems whose variables separate. SIAM Journal on Numerical Analysis. 1973;10(2):413–432.
2. Tofts PS, Brix G, Buckley DL, Evelhoch JL, Henderson E, Knopp M V, Larsson HBW, Lee T-Y, Mayr NA, Parker GJM, et al. Estimating kinetic parameters from dynamic contrast-enhanced T1-weighted MRI of a diffusable tracer: Standardized quantities and symbols. Journal of Magnetic Resonance Imaging. 1999;10(3):223–232.
3. Marquardt DW. An algorithm for least-squares estimation of nonlinear parameters. Journal of the Society for Industrial and Applied Mathematics. 1963;11(2):431–441.
4. Kargar S, Stinson EG, Borisch EA, Froemming AT, Kawashima A, Mynderse LA, Trzasko JD, Riederer SJ. Robust and efficient pharmacokinetic parameter estimation: Application to prostate DCE-MRI. Proc. ISMRM; 2016, #2463
5. Parker GJM, Roberts C, Macdonald A, Buonaccorsi GA, Cheung S, Buckley DL, Jackson A, Watson Y, Davies K, Jayson GC. Experimentally-derived functional form for a population-averaged high-temporal-resolution arterial input function for dynamic contrast-enhanced MRI. Magn. Reson. Med. 2006;56(5):993–1000.
6. Fram EK, Herfkens RJ, Johnson GA, Glover GH, Karis JP, Shimakawa A, Perkins TG, Pelc NJ. Rapid calculation of T1 using variable flip angle gradient refocused imaging. Magnetic Resonance Imaging. 1987;5(3):201–208.
7. Gudbjartsson H, Patz S. The Rician distribution of noisy MRI data. Magn. Reson. Med. 1995;34(6):910–914.
Figures