4384
Optimization of acquisition and modelling parameters for accurate and precise estimation of tumor vascular permeability using modified K-CNR1Radiology, Brigham and Women's Hospital, Boston, MA, United States, 2Siemens Healthcare USA
Synopsis
Adoption of quantitative clinical DCE-MRI remains limited given the challenges in accurate and precise estimation of kinetic parameters. Simulations are being increasingly used to guide protocol optimization1, but the relative effects of altering protocol variables are seldom considered. We used a modified K-CNR metric to quantify tumor Ktrans estimation. K-CNR provided a simple way to compare how input variables affect Ktrans output. The extended Toft’s model was shown to be robust for tumor relevant Ktrans. Lengthening baseline time can improve Ktrans estimation. Care must be taken when using nested model analysis; wrong model convergence can occur with non-optimized acquisition variables.
PURPOSE:
To understand the impact of various practical DCE-MRI acquisition and analysis parameters upon accurate and precise estimation of tumor Ktrans using a simple modified K-CNR metricMETHODS:
DCE-MRI simulations were generated using the extended Toft’s model on MATLAB. For all simulations, a modified population averaged curve equation as published by Parker et al.2 was used to generate the arterial input function (AIF) as previously described 3. This equation was fitted to a representative AIF derived from a clinical subject obtained from a concurrent IRB-approved DCE-MRI study of pleural malignancies. Offsets in timing alignment between the AIF and tissue sampling window (0-75%) were averaged. We have previously demonstrated that this approach is reflective of clinical data3. The accuracy and precision of Ktrans estimation in the range encountered in tumors (Ktrans = 0 – 0.5 min-1) were evaluated for acquisition parameters that are commonly optimized when developing a clinical DCE-MRI protocol. This included: acquisition duration (2.5-15 min), baseline time prior to contrast injection (15-300 s), time resolution (3-25 s), signal to noise ratio (SNR = 5-30) and kinetic model (Toft’s, extended Toft’s, nested model4). A modified K-CNR metric3 was used to enable direct comparison of the extent to which these parameters affect Ktrans estimation. Unless otherwise stated, input simulation variables were set as SNR = 30, vp = 0.01, ve = 0.1, T1 of blood = 1200 ms and T1 of tissue = 400 ms, TR = 2.5 ms, FA = 10∘. 100 curves were generated for each condition. Model fitting and Ktrans estimation were performed using ROCKETSHIP5.RESULTS:
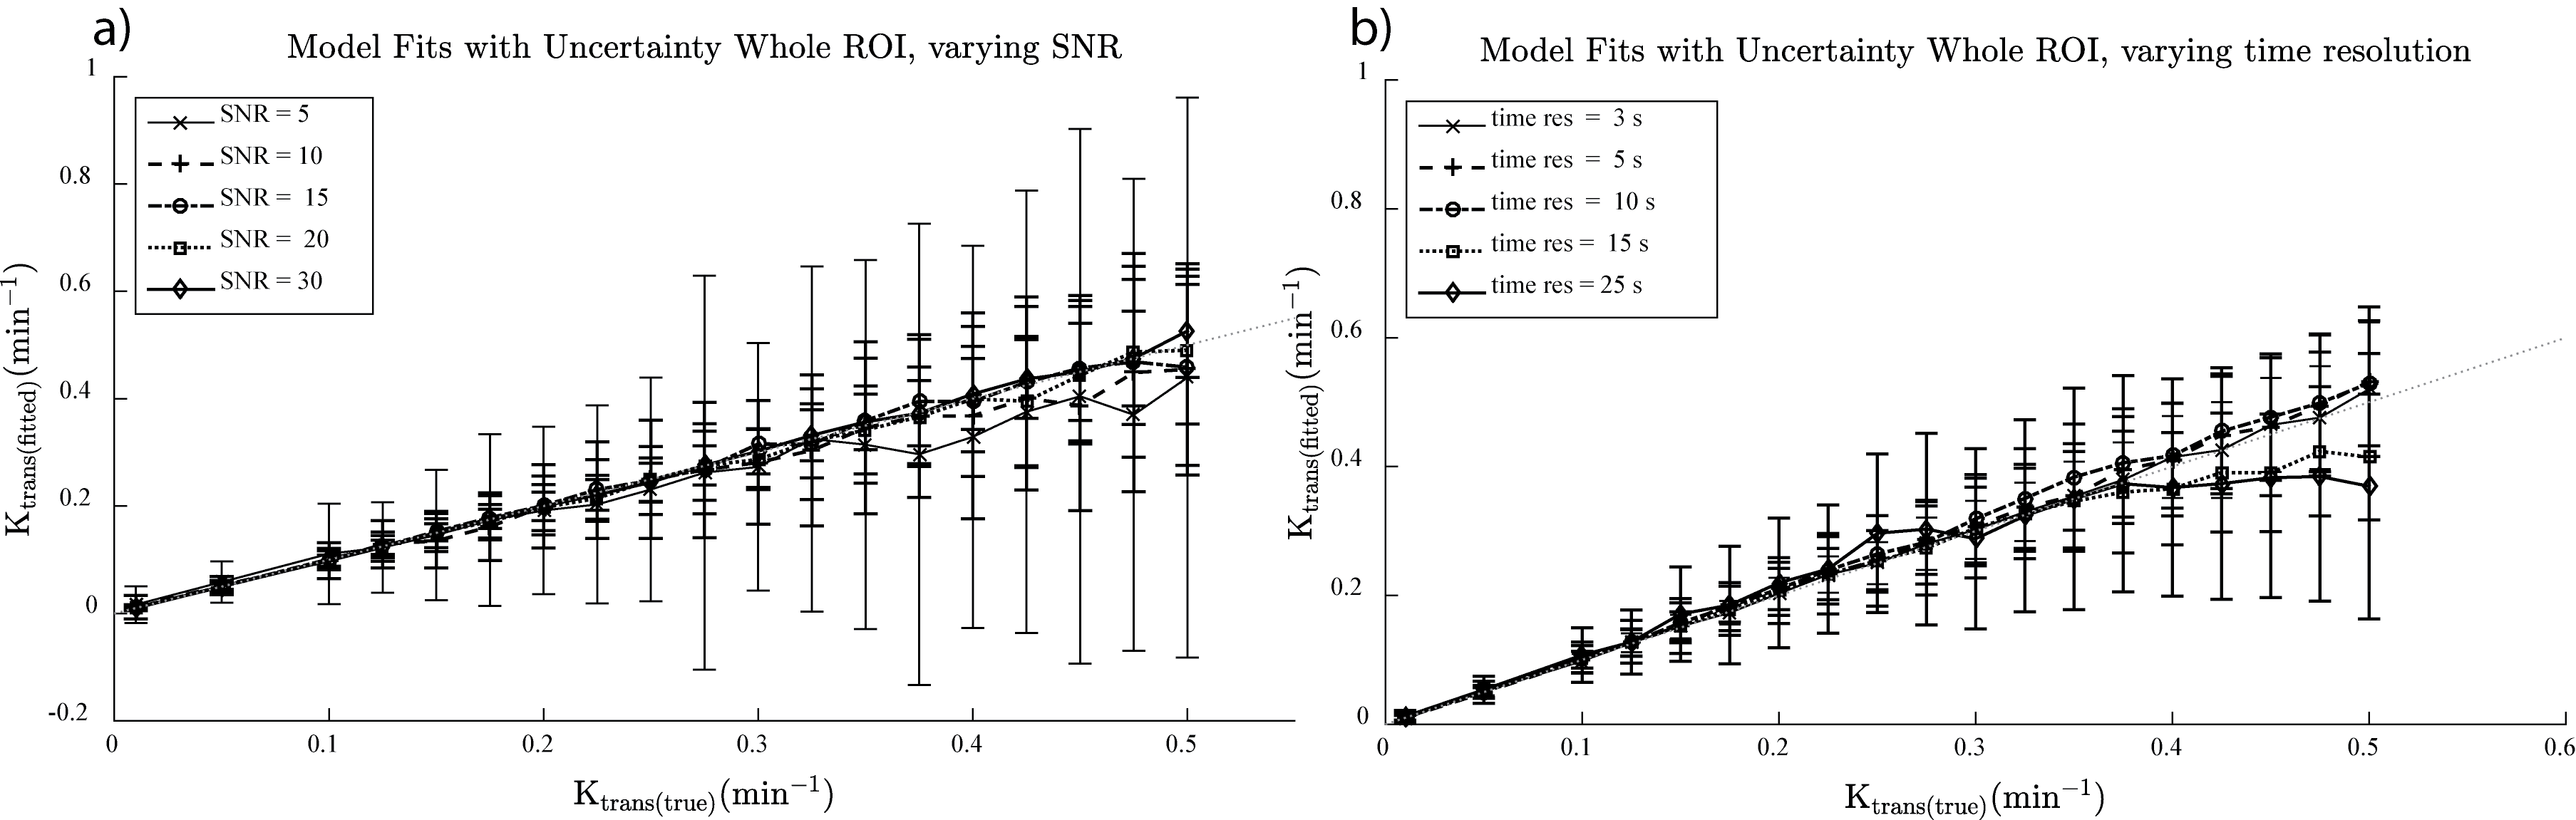
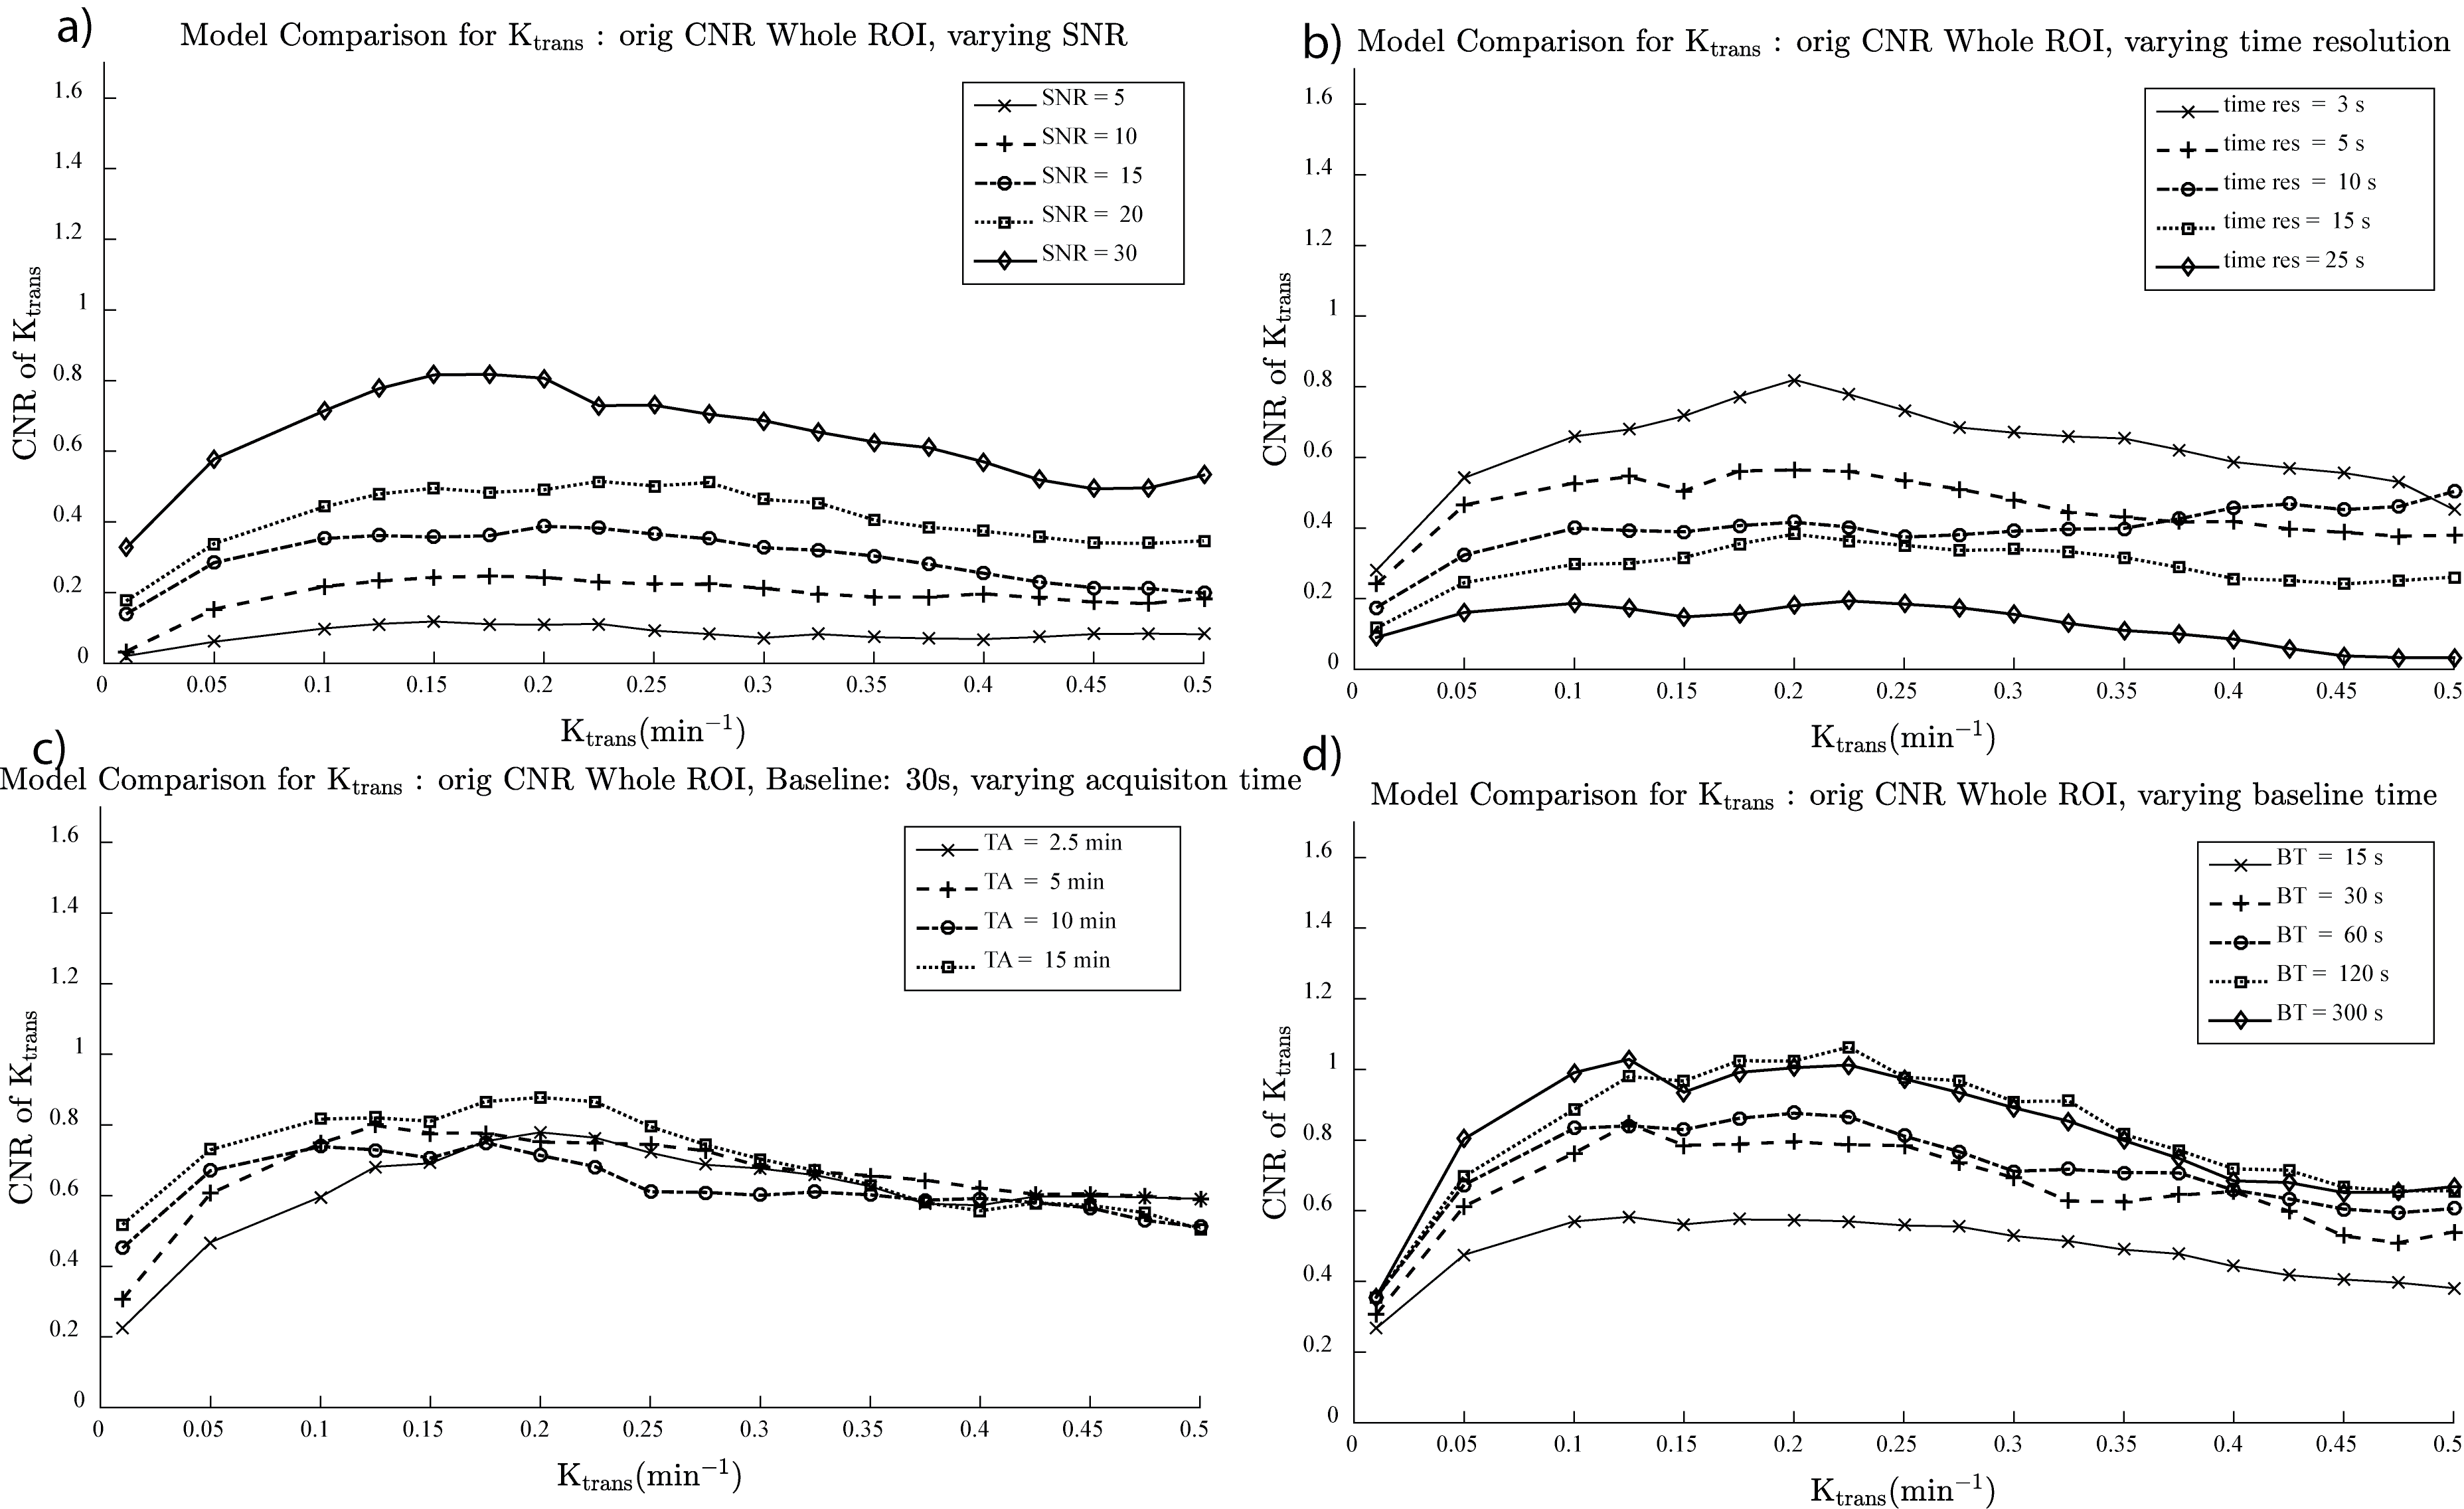
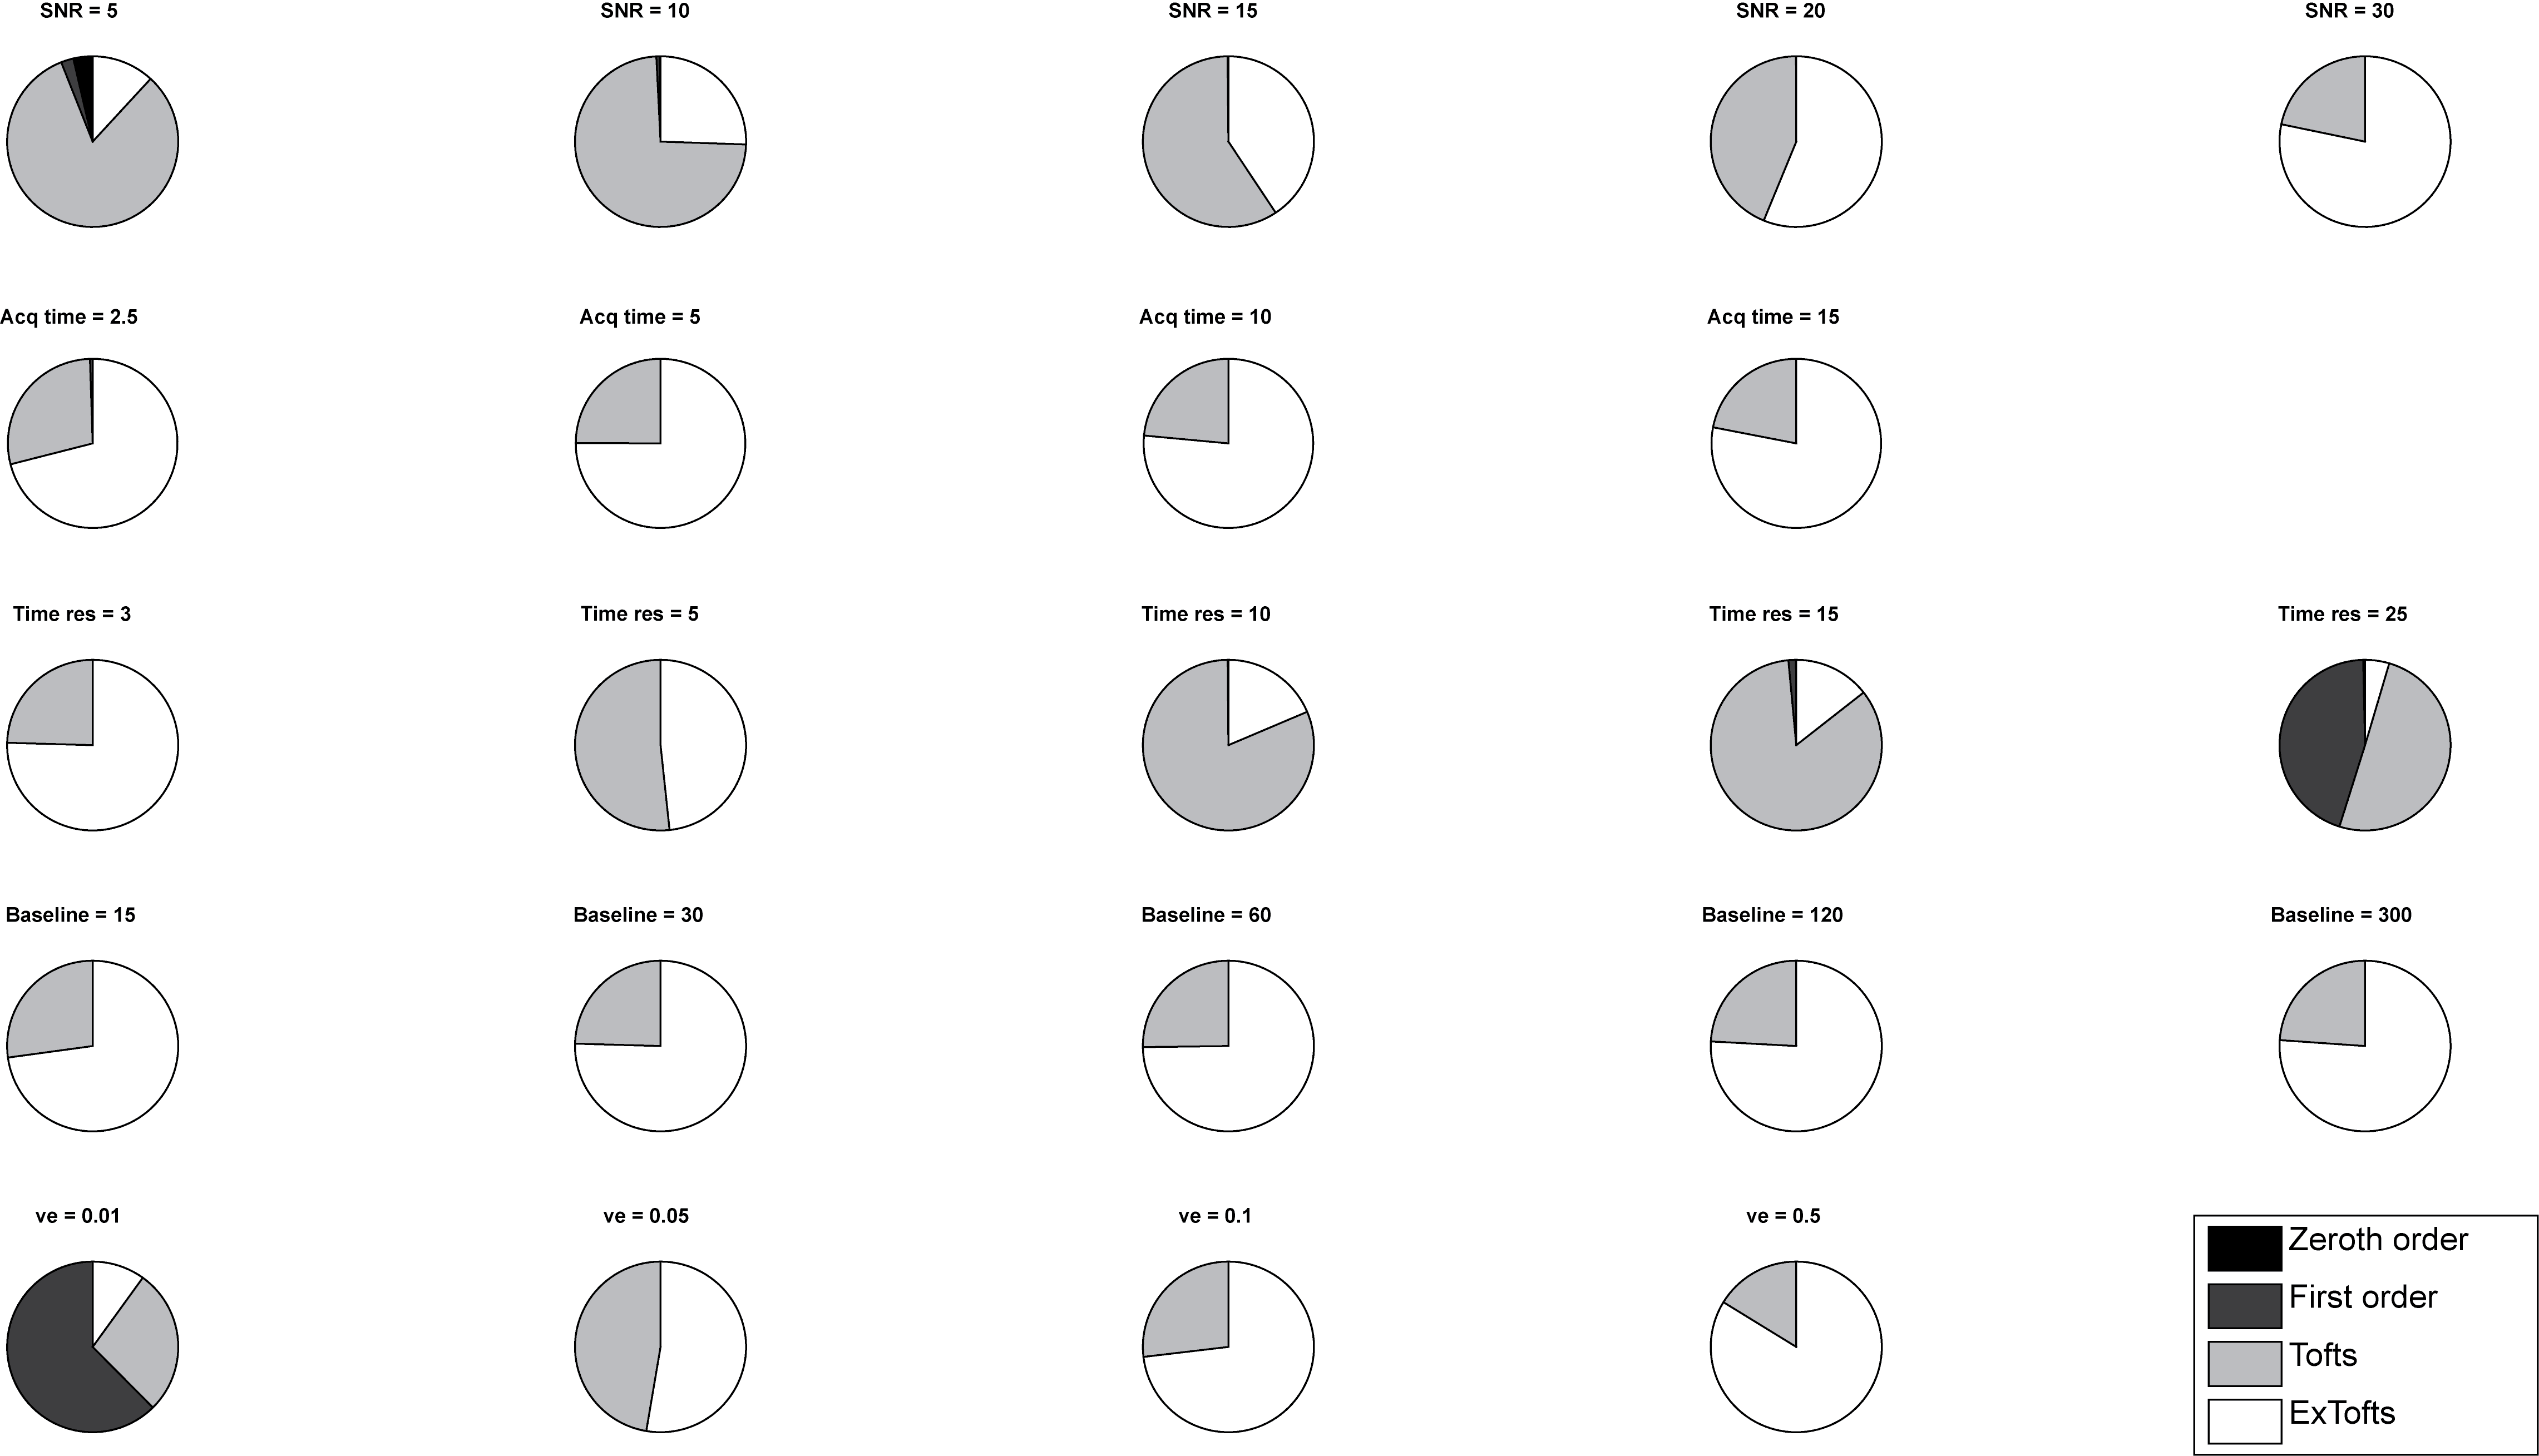
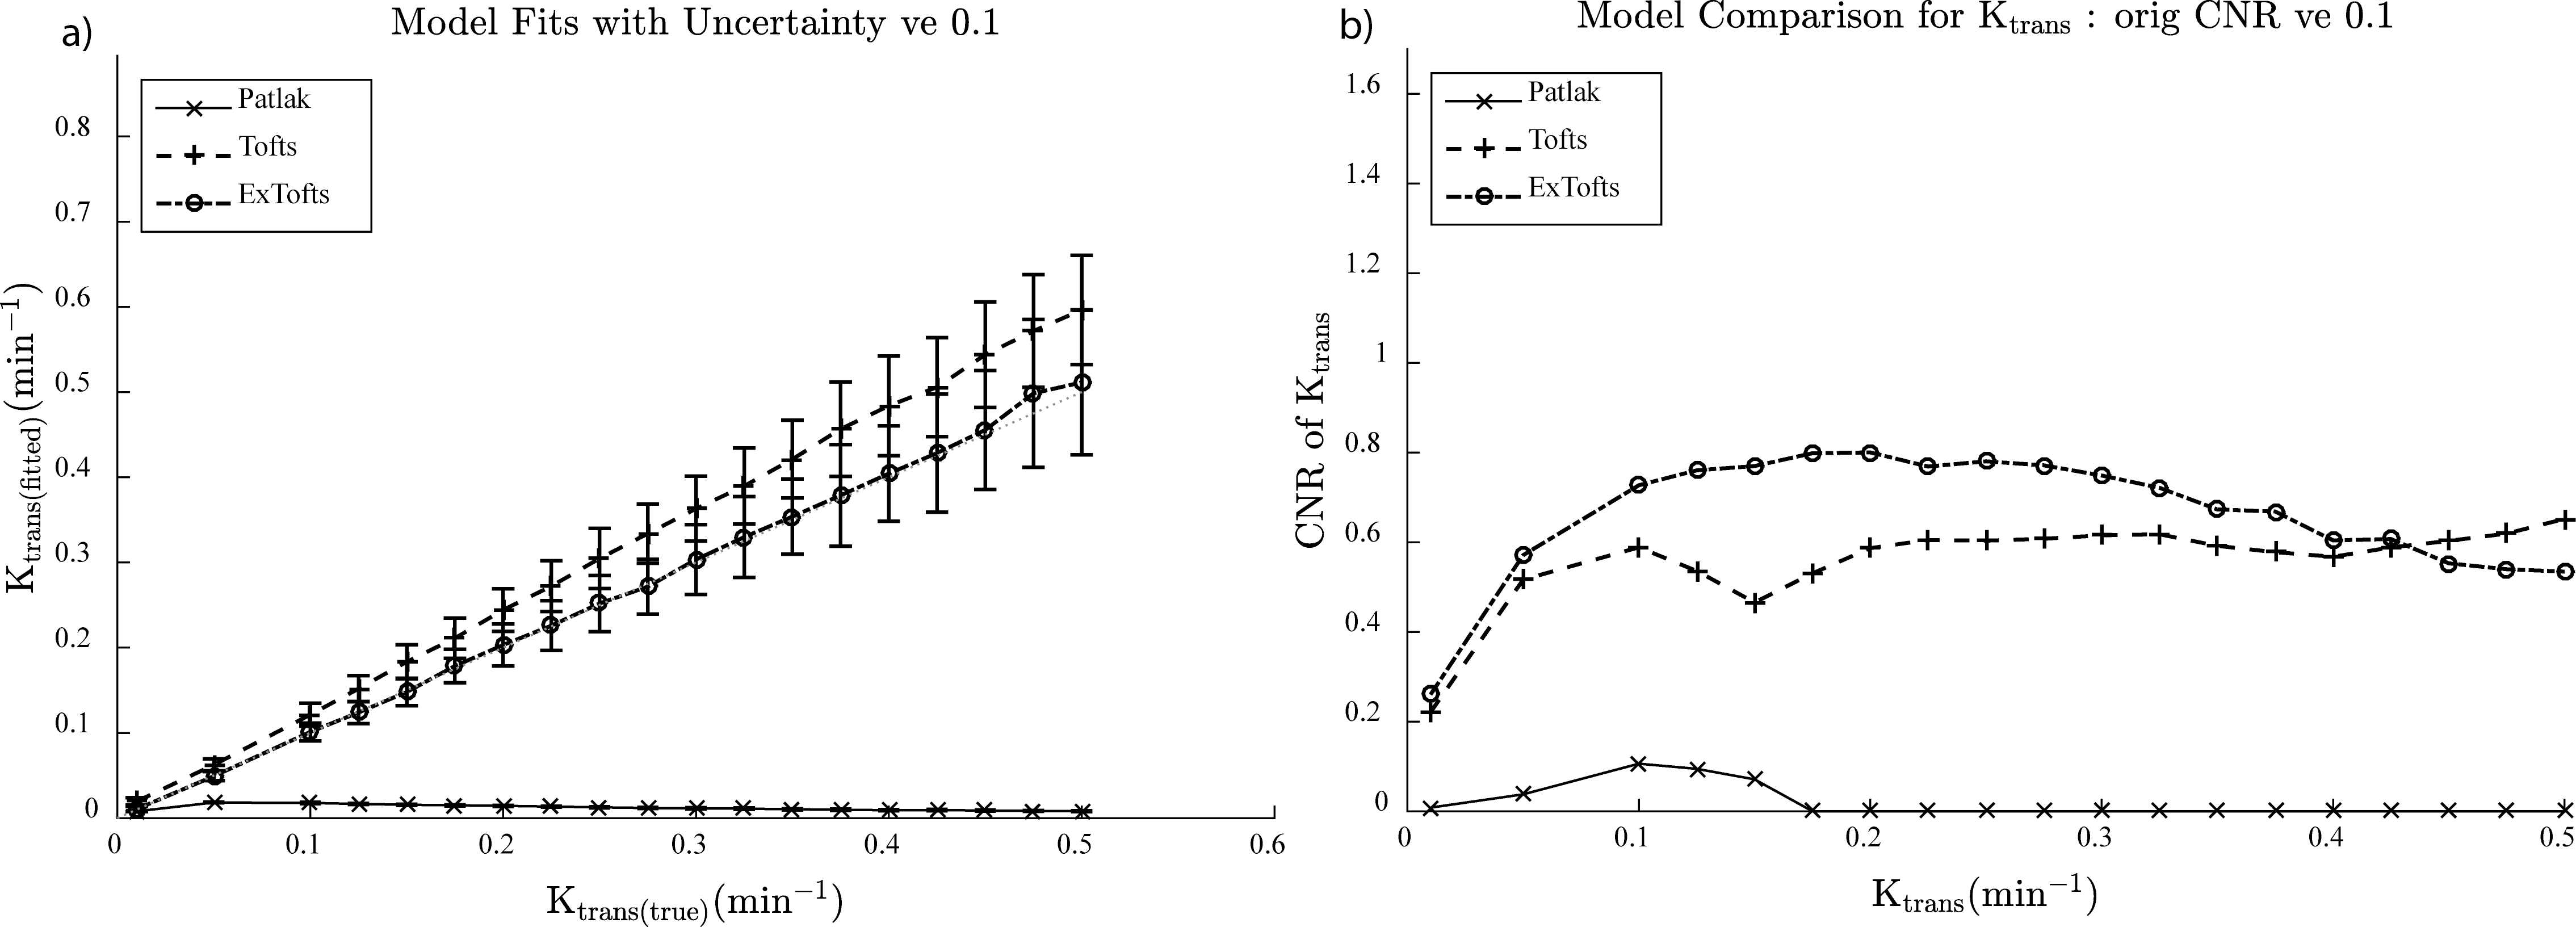
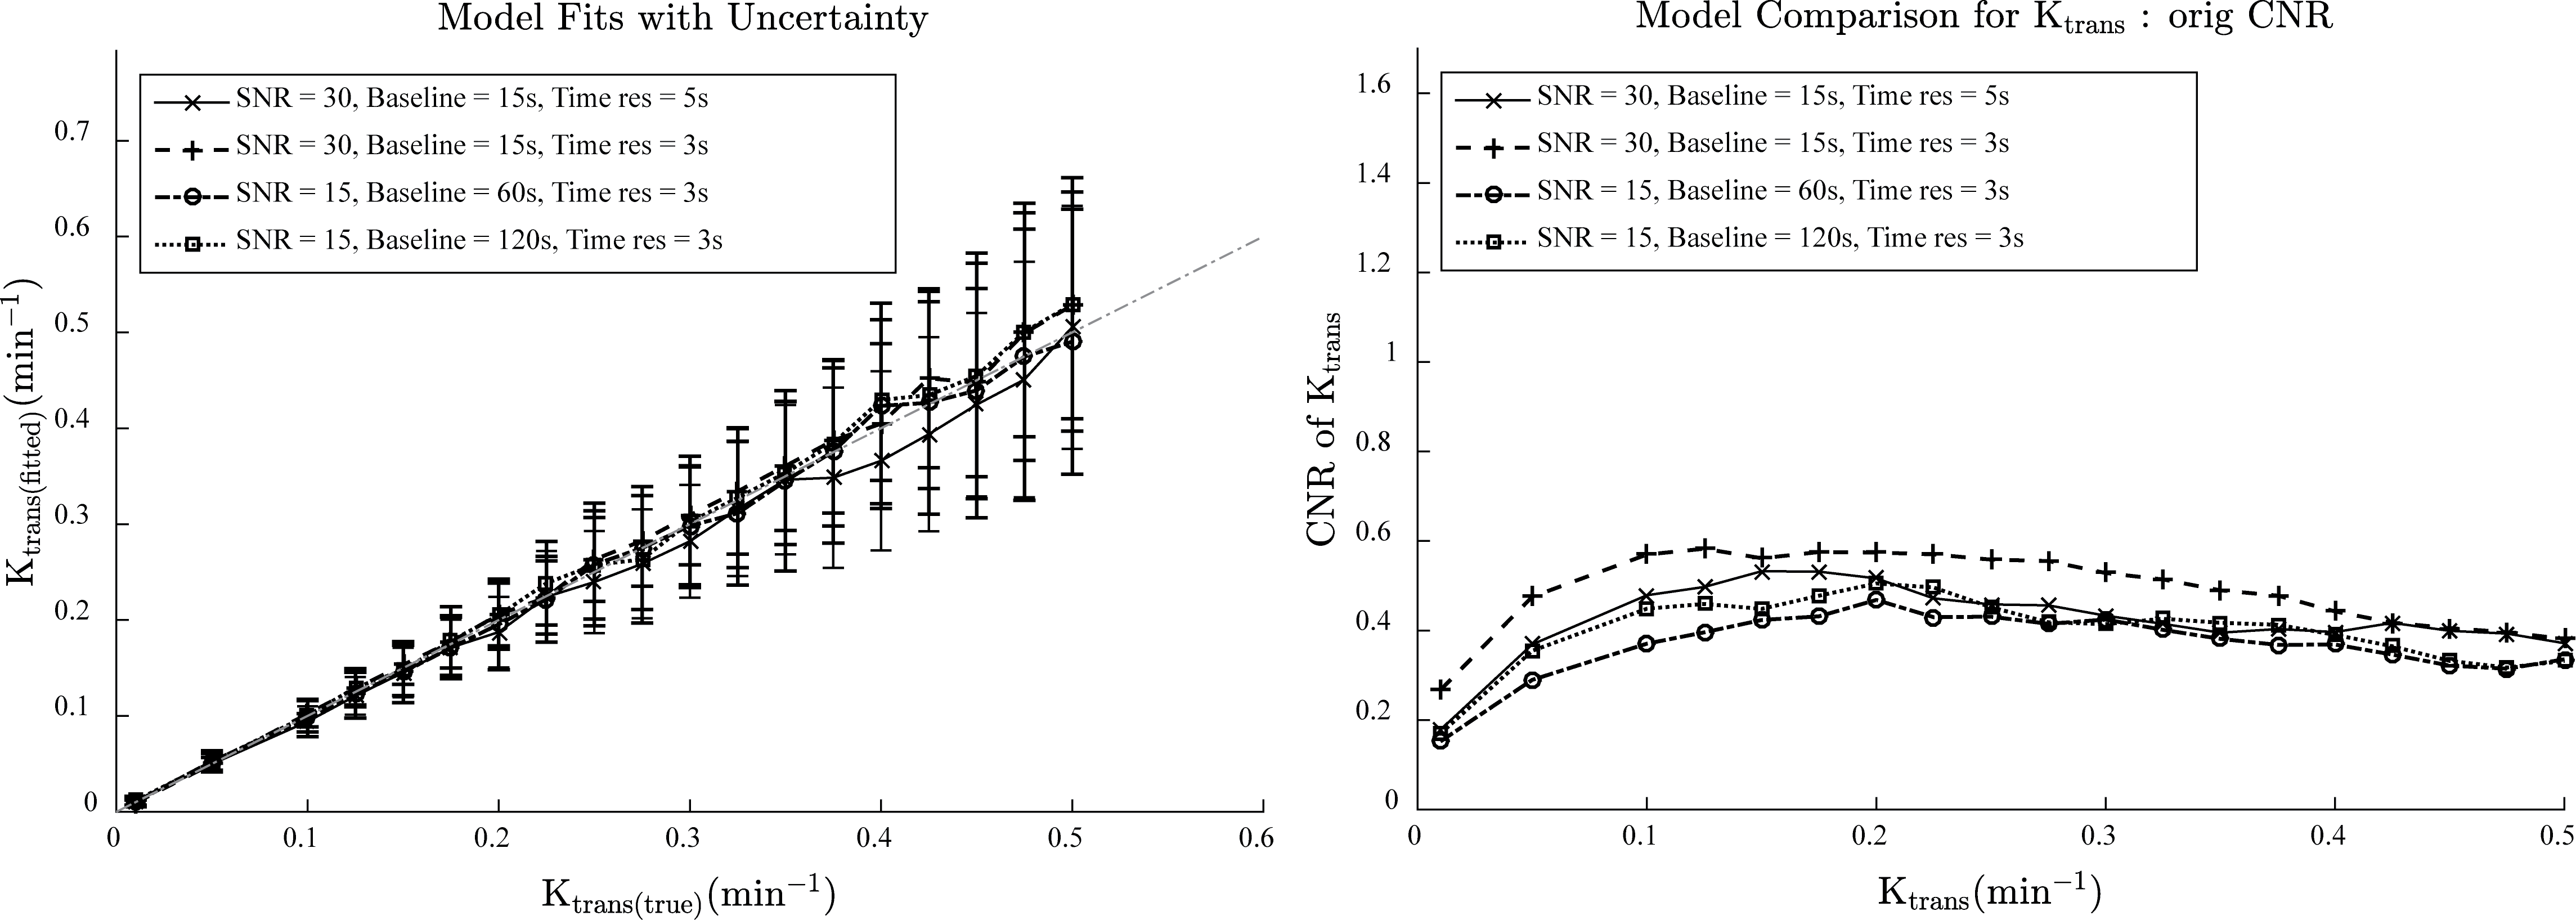
A sample Ktrans(estimated) vs. Ktrans(simulated) graph using the extended Toft’s model for varying SNR is shown in Figure 1a. While the accuracy of the Ktrans fits is good, the precision worsens with decreasing SNR as expected. This is reflected in the K-CNR metric (Figure 2a). By comparison, lengthening the time resolution results in worsening accuracy of Ktrans estimation, especially when Ktrans is high (Figure 1b). This too is encapsulated in the K-CNR metric (Figure 2b). Commensurate with our prior study3, the extended Toft’s model poorly estimates low Ktrans (< 0.05). However, at high permeability, estimation using the extended Toft’s model is relatively robust (stable K-CNR). Increasing total acquisition time of the study had a relatively minor effect upon improving Ktrans estimation. By comparison, lengthening the baseline prior to injection (> 60s) had a greater effect in improving Ktrans estimation. Impact of changing these variables on nested model estimation is shown in Figure 3. Baseline and total acquisition time is robust to model convergence, with most of the curves fitting to the extended Toft’s model. Decreased SNR and lengthened time resolution results in lower order model convergence. The effect of inappropriate model convergence is shown in Figure 4. If the Toft’s model were selected there would be an overestimation of Ktrans.DISCUSSION:
Several studies have explored the effects of various “input” parameters (e.g. accurate T1 blood/tissue, FA, time resolution) upon kinetic parameter estimation6-9.Given the significant variations in setup at different institutions (e.g. type of scanner, type of coil/ pulse sequence available) and study specific constraints (e.g. size of the patients, time available for each sequence within a given protocol) and the desired output data for the clinical question being studied, it is necessary to understand the interaction of different acquisition parameters on Ktrans on an individual basis. Thus, methods that allow the investigator to optimize kinetic parameter estimation accuracy and understand the impact of altering different acquisition parameters on estimation simply would be useful. The K-CNR provides a simple tool to compare the effects of different parameters upon Ktrans. Using K-CNR analysis, increasing baseline time conferred significant advantages to estimating Ktrans. By contrast, changing acquisition time minimally affects Ktrans estimation. Simulation analysis also provides guidance on the use of complex DCE-MRI models; worsening K-CNR results in convergence to the wrong model, resulting in worse Ktrans estimation. K-CNR analysis allows the combined effect of different input variable upon Ktrans to be performed. For example, a comparison can be made between a protocol with higher SNR, but longer time resolution against a faster time resolution sequence with a lower SNR (Figure 5). By adjusting the baseline parameter, one can maintain the same K-CNR using the latter setup, while remaining robust for nested model evaluation.CONCLUSION:
DCE-MRI simulation analysis using a K-CNR metric provides a simple way for optimizing acquisition parameters. This metric allows simple comparisons between multiple sets of input parameters upon Ktrans estimation, and provides a useful tool for oncologic DCE-MRI protocol development.Acknowledgements
We thank Drs. Samuel Barnes and Russell Jacobs for thoughtful discussions and support. T.S.C. Ng is supported by the BWH Radiology Residency.References
1. Artzi, M.; Liberman, G.; Nadav, G.; Blumenthal, D. T.; Bokstein, F.; Aizenstein, O.; Ben Bashat, D., Optimization of DCE-MRI protocol for the assessment of patients with brain tumors. Magn. Reson. Imaging 34 (9), 1242-1247.
2. Parker, G. J. M.; Roberts, C.; Macdonald, A.; Buonaccorsi, G. A.; Cheung, S.; Buckley, D. L.; Jackson, A.; Watson, Y.; Davies, K.; Jayson, G. C., Experimentally-derived functional form for a population-averaged high-temporal-resolution arterial input function for dynamic contrast-enhanced MRI. Magn. Reson. Med. 2006, 56 (5), 993-1000.
3. Barnes, S. R.; Ng, T. S. C.; Montagne, A.; Law, M.; Zlokovic, B. V.; Jacobs, R. E., Optimal acquisition and modeling parameters for accurate assessment of low Ktrans blood-brain barrier permeability using dynamic contrast-enhanced MRI. 2015, In prep.
4. Duan, C.; Kallehauge, J. F.; Bretthorst, G. L.; Tanderup, K.; Ackerman, J. J.; Garbow, J. R., Are complex DCE-MRI models supported by clinical data? Magn. Reson. Med. 2016.
5. Barnes, S. R.; Ng, T. S.; Santa-Maria, N.; Montagne, A.; Jacobs, R. E., ROCKETSHIP: a flexible and modular software tool for the planning, processing and analysis of dynamic MRI studies. Manuscript submitted for publication 2015.
6. Di Giovanni, P.; Azlan, C. A.; Ahearn, T. S.; Semple, S. I.; Gilbert, F. J.; Redpath, T. W., The accuracy of pharmacokinetic parameter measurement in DCE-MRI of the breast at 3 T. Phys. Med. Biol. 2010, 55 (1), 121.
7. Aerts, H. J.; Jaspers, K.; Backes, W. H., The precision of pharmacokinetic parameters in dynamic contrast-enhanced magnetic resonance imaging: the effect of sampling frequency and duration. Phys. Med. Biol. 2011, 56 (17), 5665-78.
8. Cramer, S. P.; Larsson, H. B. W., Accurate determination of blood-brain barrier permeability using dynamic contrast-enhanced T1-weighted MRI: a simulation and in vivo study on healthy subjects and multiple sclerosis patients. J. Cereb. Blood Flow Metab. 2014, 34 (10), 1655-1665.
9. Khalifa, F.; Soliman, A.; El-Baz, A.; El-Ghar, M. A.; El-Diasty, T.; Gimel’farb, G.; Ouseph, R.; Dwyer, A. C., Models and methods for analyzing DCE-MRI: A review. Med. Phys. 2014, 41 (12), 124301.
Figures