4383
Model-based and Non-model-based Perfusion-related Predictors of Response to Chemotherapy in Intrahepatic Cholangiocarcinoma1Medical Physics, Memorial Sloan-Kettering Cancer Center, New York, NY, United States, 2Radiology, Memorial Sloan-Kettering Cancer Center, New York, NY, United States, 3Surgery, Memorial Sloan-Kettering Cancer Center, New York, NY, United States, 4Medicine, Memorial Sloan-Kettering Cancer Center, New York, NY, United States
Synopsis
Hepatic arterial infusion of floxuridine has shown benefit in intrahepatic cholangiocarcinoma. Due to the complexity and expense of this treatment, a pre-treatment or early biomarker of efficacy would be advantageous. We employed non-model-based (NMB) analysis to maximize information from breath-motion degraded DCE-MRI in 24 patients. Model-based and NMB parameters were compared to RECIST response. The kurtosis value of pre-treatment time-to-half-maximum correlated with response, as did 1 month changes in perfusion parameters (Ktrans and signal at half maximum). NMB analysis resulted in fewer voxels being discarded due to motion and thus may be more representative of tumor physiology while not requiring modeling.
Introduction
Intrahepatic cholangiocarcinoma (ICC) is the second most common primary liver malignancy and has limited therapeutic options. Hepatic arterial infusion of floxuridine (HAI-FUDR) chemotherapy has shown therapeutic benefit in some ICC patients in prior clinical trials1. Due to the complexity and expense of this treatment modality, pre-treatment or early treatment prediction of efficacy would be of great benefit. We previously reported potential Tofts-model based markers of response in 18 patients2. However, substantial respiratory motion occurring during the sampling of the 3D volume in these gradient-echo-based DCE-MRI series resulted in large excursions in the contrast uptake curves, forcing us to discard many voxels due to poor fits to the model giving rise to large uncertainty in fit parameters. In this study, the number of accrued patients increased to 24, and we derived non-model-based (NMB) parameters from the contrast uptake curves to determine whether more voxels could be utilized and whether these parameters correlated with tumor response.Methods
Data acquisition. 24 consecutive patients participating in a phase 2 clinical trial of combination HAI-FUDR and systemic chemotherapy with gemcitabine/oxaliplatin (GemOx) were recruited for this IRB-approved prospective study between January 2013 and August 2016. Scans were performed at 1.5T (G.E. Signa 450). DCE-MRI was performed before and after treatment (1 cycle =1 month of HAI-FUDR and 2 weeks of GemOx). DCE-MRI consisted of a free-breathing, 3D-fat-saturated FLASH sequence prescribed in the oblique coronal plane (matrix 256x128, FOV 340-440, slice thickness = 5-7 mm TE = 1.5 ms, TR = 4.2 ms, flip angle 30°, temporal resolution = 6-8s,). Images were prescribed over the largest tumor and Gd-BOPTA at 0.1 mmol/kg was injected at 2 ml/sec. Analysis. Tumor ROIs were outlined by a radiologist in ImageJ3. Model-based (MB) and NMB quantitative analyses were performed in Matlab®. Extended Tofts Model parameters (Ktrans, ve Kep) were calculated following QIBA guidelines4 using a single-input vascular function under the assumption that ~80% of tumor supply was arterial2. Inclusion of model-derived parameter values for a given voxel in the statistical analysis required a goodness-of-fit measure (R2) > 0.5. The NMB parameters calculated were the time to half-maximum enhancement (τ50) and the signal value at half maximum normalized to the baseline noncontrast signal (S50). For both MB and NMB analysis, data were smoothed in-plane with an identical Gaussian filter. For the NMB analysis, temporal Gaussian smoothing was also employed to permit automated detection of the enhancement maximum in the presence of large motion excursions. Following interpolation to generate identical sampling intervals for all data sets, the first peak was identified using a search algorithm and Gaussian smoothing was employed only in points occurring after the first peak. Voxels with calculated τ50 < 0.01 min (non-physiologic) were found to be extremely noisy and were excluded as were outliers with τ50 over 2.5 times the inter-quartile range, below the first or above the third quartile. Summary statistics. Histogram statistics included median, 10th and 90th percentiles, skewness and kurtosis for each parameter value (PV). We calculated the baseline PV (PV0) as well as the percent change in each PV after 1 month of treatment (ΔPV1MO =100*[PV1MO - PV0)]/ PV0)). One patient did not have DCE-MRI at one month. Tumor response (% change in sum of diameters, negative value indicates decrease in tumor size) was measured after 3 months and 6 months of treatment by RECIST 1.1 on follow-up MRI. Correlations between best response after 6 months and parameter values were calculated using linear regression analysis.Results
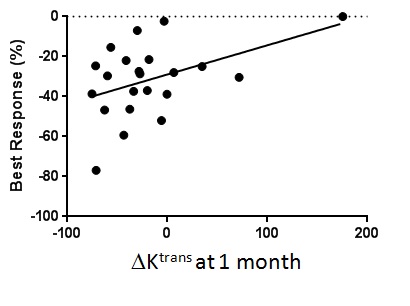
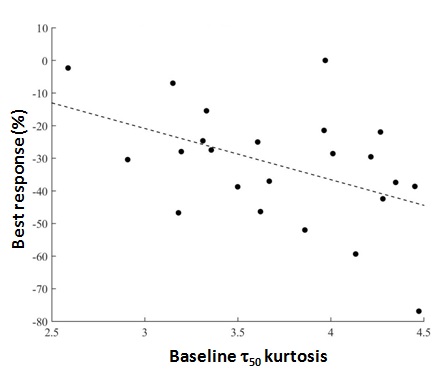
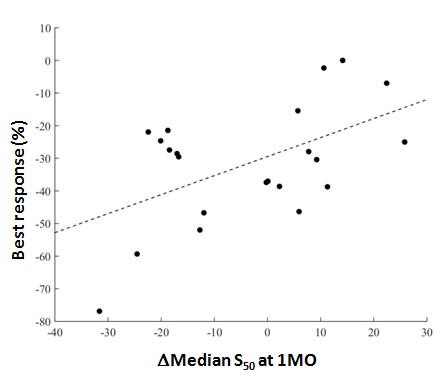
Data inclusion. The mean percentage of voxels discarded was 55.0 ± 30.4% in Tofts model fit curves vs 11.0 ± 18.2% in the NMB analysis (P < 0.0001). Parameter Analysis. Of the Tofts-model parameters, only the change in Ktrans at 1 month was correlated with response (P = 0.03, Fig. 1). NMB parameters which correlated with response were the baseline τ50 kurtosis (P = 0.03) and ΔS50 at 1 month (P = 0.01) (Figs 2, 3).Conclusions
Both model-based (ΔKtrans) and NMB (ΔS50) parameters suggested that a decrease in contrast-enhancement/perfusion at 1 month correlates with eventual response. The significance of the baseline kurtosis value for τ50 suggests that a wider range of τ50 values (i.e. wider range of uptake rates) at baseline is related to better response. This finding requires further exploration. Use of NMB analysis permitted inclusion of more voxels in this motion-degraded data set and thus may be more representative of whole-tumor physiology. Furthermore, NMB analysis did not incorporate AIF or T1 values and thus may be easier to implement than model fitting. Further verification is needed.Acknowledgements
No acknowledgement found.References
1. Konstantinidis IT, et. al. Cancer. 2016 Mar 1;122(5):758-65. doi: 10.1002/cncr.29824.
2. Zakian, KL, et.al. ISMRM 24th Annual Meeting, Singapore, 2016, #530.
3. Rasband, W.S., ImageJ, U. S. National Institutes of Health, Bethesda, Maryland, USA, http://imagej.nih.gov/ij/, 1997-2016.
4. DCE MRI Technical Committee. DCE MRI Quantification Profile, Quantitative Imaging Biomarkers Alliance. Version 1.0. Reviewed Draft. QIBA, Jul1, 2012.
Figures