4382
Quantitative Perfusion Imaging in Rectal Cancer – Choice and Influence of the Arterial Input Function to Perfusion Parameters1Computer Assisted Clinical Medicine, Medical Faculty Mannheim, Heidelberg University, Mannheim, Germany, 2Institute of Clinical Radiology and Nuclear Medicine, Medical Faculty Mannheim, Heidelberg University, Mannheim, Germany
Synopsis
Quantitative perfusion analysis in rectal cancer with DCE-MRI is highly dependent on the choice of the arterial input function (AIF). In nineteen patients it was investigated whether the selection affects the quantification of plasma flow (PF) applying with three different perfusion models (fast deconvolution algorithm, two-compartment uptake model, two-compartment exchange model). Results show disagreements in PF between the two AIFs for all three models with significant differences for the two-compartment exchange and uptake model.
Introduction
Magnetic resonance imaging (MRI) has achieved broad acceptance not only for local staging of primary rectal cancer prior to treatment1 but also to predict treatment outcome2. Recently, several authors have demonstrated the additional value of functional MRI parameters comprising perfusion parameters such as plasma flow (PF) or mean transit time (MTT)1, 3. However, such quantitative analysis underlies the well-known issues related to perfusion imaging4, especially with regard to correct modelling of the pharmacokinetics. Particularly, selecting an adequate arterial input function (AIF) is critical to obtain accurately calculated parameters5. In perfusion imaging in rectal cancer, the selection of the AIF becomes essential since on the one hand both left and right iliac arteries supply the rectum and thus the tumor with blood and on the other hand stenosis in these arteries is commonly reported. Recent studies neglected this problem and rather just selected either left or right supplying vessel in their analysis1, 2, and 3. In this study, we investigated the influence of selecting either left or right iliac artery to parameters obtained by perfusion analysis incorporating three different pharmacokinetic models (deconvolution, two-compartment exchange (2CXM), and two-compartment uptake model (2CUM)).Materials and Methods
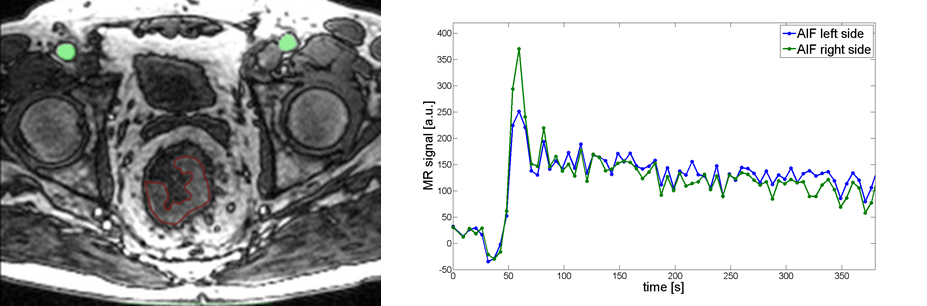
Retrospective data analysis of the pelvis of nineteen patients (14 male and 5 female / 62 ±12 years) with rectal cancer was performed. DCE-MRI data was acquired with a 3T scanner (Magnetom Skyra, Siemens Healthcare Sector, Erlangen, Germany) using a 3D TWIST sequence and parameters TR/TE/FA=3.6ms/1.44ms/15°, matrix-size=192*117, FOV= 259mm*158mm, 20 slices. Temporal resolution was 5 s and in total 70 volumes were acquired. Gadolinium based contrast agent (Dotarem, Guerbert, France) was injected after the 10th volume. Perfusion quantification was performed as follows: a region-of-interest (ROI) was carefully drawn to delineate the tumor and both supplying arteries using the Osirix DICOM viewer (Pixmeo, Geneva, Switzerland) (Figure 1). PF in the tumor was calculated for each AIF using the fast deconvolution algorithm, the 2CXM and the 2CUM employing an in-house developed perfusion plugin (UMMPerfusion)7. Statistical analysis was performed using Matlab 2015 (The Mathworks, Nattick, USA). To test for normal distribution within three groups, Lilliefors test was used. Since not all data was normally distributed, nonparametric paired Wilcoxon sign rank test was employed for further analysis.Results
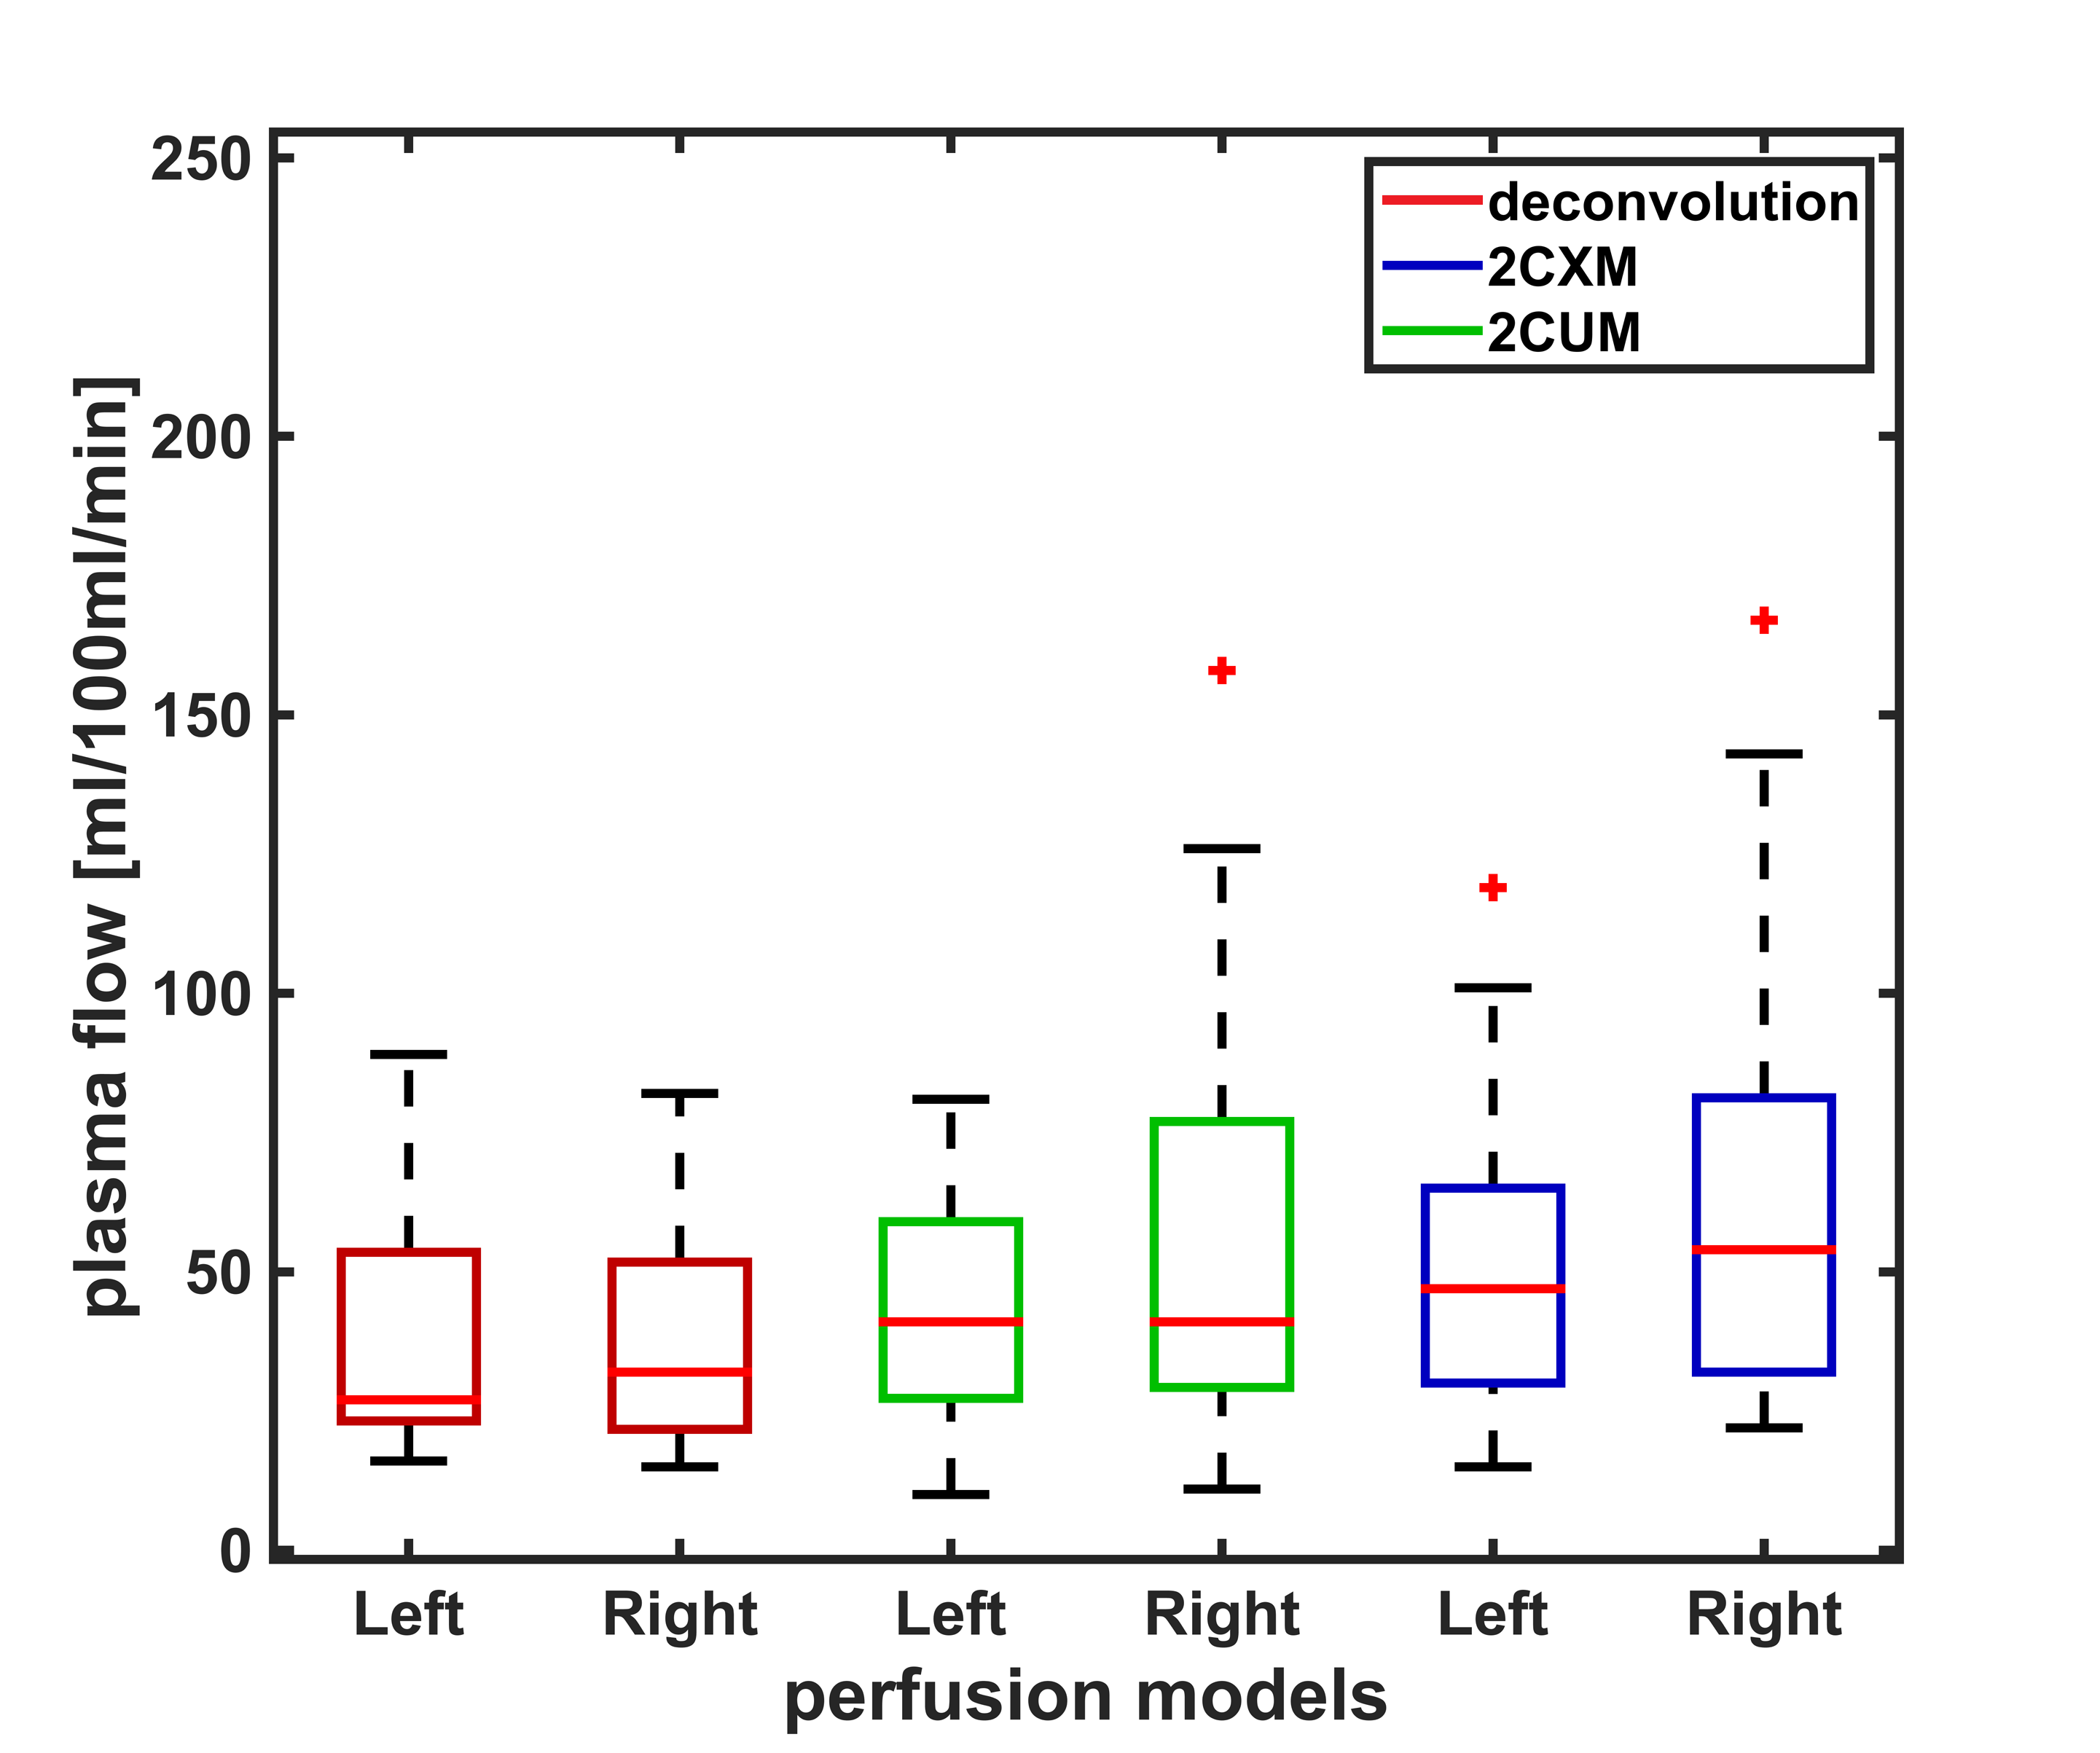
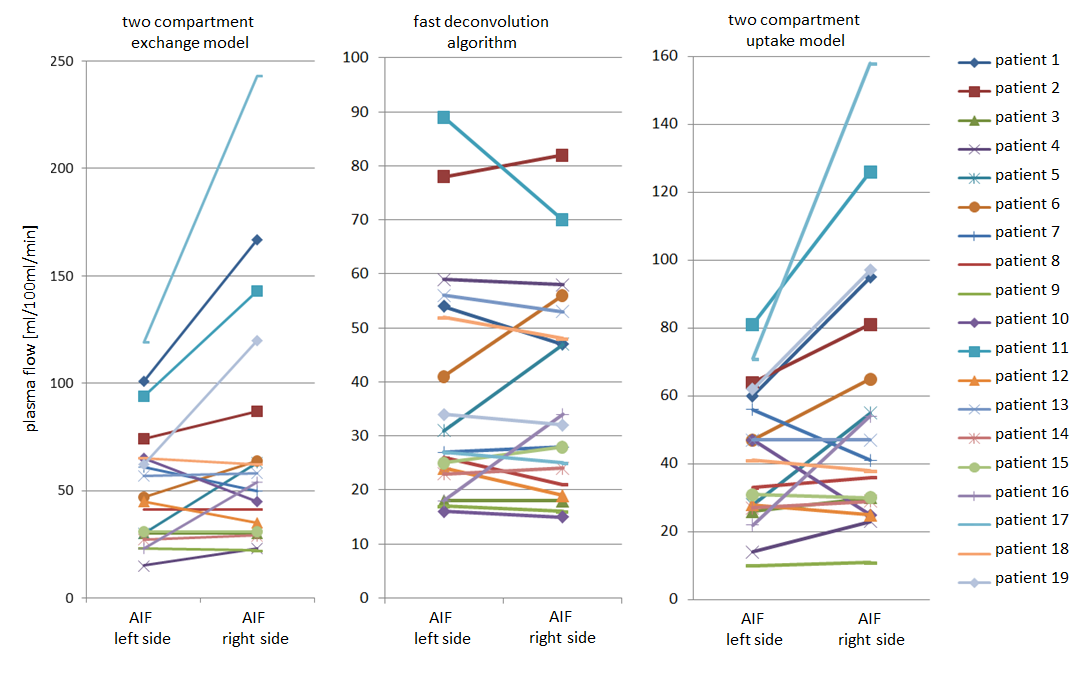
Figure 2 summarizes the calculated plasma flow values for left and right AIF as well as the three models. There are only slight differences between median values for left and right AIF, however a large variance within the groups can be observed which is also reflected in the mean and standard deviation (deconvolution (left, right): 38±21, 38±20 ml/100ml/min; 2CXM (left, right): 42±20, 56±39 ml/100ml/min; 2CUM (left, right): 53±30, 72±58 ml/100ml/min). To illustrate the change in PF between the two AIF selections, the corresponding data points were connected by a line (Figure 3). To further analyze this, we examined the differences between the two AIF selections. On average these differences amount to 30±26 ml/100ml/min. Statistical analysis showed no significant differences (p >0.05) for the fast deconvolution model. However, for the 2CXM (p=0.04) and 2CUM (p=0.02) a significant difference was found.Discussion
The initial results show, that the quantification of the perfusion is dependent on the selection of the AIF (left, right) when performing DCE-MRI in rectal cancer. Significant differences in PF between the two AIFs are found for the 2CXM and 2CUM, but not for the deconvolution approach. This might be due to the fact that we did not observe obvious delay in the two AIFs but in their shape and therefore, might influence the 3(4) parameter fit of the two-compartment models. However, in all models, differences between left and right AIF were observed (Figure 3). Our findings are in agreement with reports of the influence of the AIF selection of quantification in DCE-MRI in other organs6. Therefore, the signal of both AIF should be considered, i.e. taking the mean value of all blood supplying arteries to become independent of the AIF selection8. This might improve the accuracy and reproducibility of quantitative perfusion parameters in rectal cancer patients and thus allow for better prediction of the treatment outcome.Acknowledgements
This research project is part of the Research Campus M²OLIE and funded by the German Federal Ministry of Education and Research (BMBF) within the Framework “Forschungscampus: public-private partnership for Innovations” under the funding code 13GW0092D.References
[1] Calamante et al. (2013). Arterial input function in perfusion MRI: A comprehensive review. Progress in nuclear magnetic resonance spectroscopy, 74:1-32
[2] Attenberger et al. (2014). Multi-parametric MRI of rectal cancer–Do quantitative functional MR measurements correlate with radiologic and pathologic tumor stages? European Journal of Radiology, 83:1036-1043
[3] Koh et al. (2013). Primary Colorectal Cancer: Use of Kinetic Modeling of Dynamic Contrast-enhanced CT Data to Predict Clinical Outcome, Radiology, 267(1):145-154
[4] Oberholzer et al. (2013). Rectal Cancer: Assessment of Response to Neoadjuvant Chemoradiation by Dynamic Contrast-Enhanced MRI, journal of magnetic resonance imaging, 38:119–126 (2013)
[5] F. Zöllner, T. Gaa, F. Zimmer, M. Ong, P. Riffel, D. Hausmann, S. Schoenberg and M. Weis. Quantitative perfusion imaging in magnetic resonance imaging. Radiologe, 56 (2), pp.113-123 (2016).
[6] Cutajar, M., Mendichovszky, I. a, Tofts, P. S., Gordon, I. (2010). The importance of AIF ROI selection in DCE-MRI renography: reproducibility and variability of renal perfusion and filtration. European Journal of Radiology, 74(3), e 154–60.
[7] F. Zöllner, M. Daab, S. Sourbron, L. Schad, S. Schoenberg and G. Weisser. An open source software for analysis of dynamic contrast enhanced magnetic resonance images: UMMPerfusion revisited.BMC Med Imaging, 16 (7), pp.1-13 (2016)
[8] T. Gaa, S. Sudarski, F. Lietzmann, L. Schad and F. Zoellner. Quantitative DCE-MRI of rectal cancer: influence of multiple blood supplies and its corresponding arterial input functions on perfusion parameters. Proc. ESMRMB 2015 Congress , Edinburgh, UK , (2015) 32, p.597
Figures