4380
R2* relaxation affects pharmacokinetic analysis of DCE-MRI at high field strength1MR Cancer Group, Department of Circulation and Medical Imaging, NTNU Norwegian University of Science and Technology, Trondheim, Norway
Synopsis
In DCE-MRI, the effect of the r2* relaxivity of gadolinium-based contrast agents is often assumed to be negligible. Here, the validity of this assumption at 7T was tested. DCE-MRI was performed on two preclinical cancer models using a spoiled multiple gradient-echo acquisition, which enabled correction for transverse relaxation. Not accounting for R2* resulted in underestimation of the Tofts pharmacokinetic parameters, with Ktrans being the most affected and vp the least. Simulations showed that the R2* effect can be significant even at 3T in highly perfused regions but can be mitigated by decreasing TE and TR or increasing the flip angle.
Purpose
It is standard to neglect transverse relaxation in DCE-MRI, but this may not be valid at high field strengths. In this study, we 1) characterized the effect of gadolinium-induced R2* enhancement on DCE-MRI at 7T using a multiple gradient-echo sequence, and 2) used simulations to determine the dependence of the R2* effect on field strength and sequence parameters.Methods
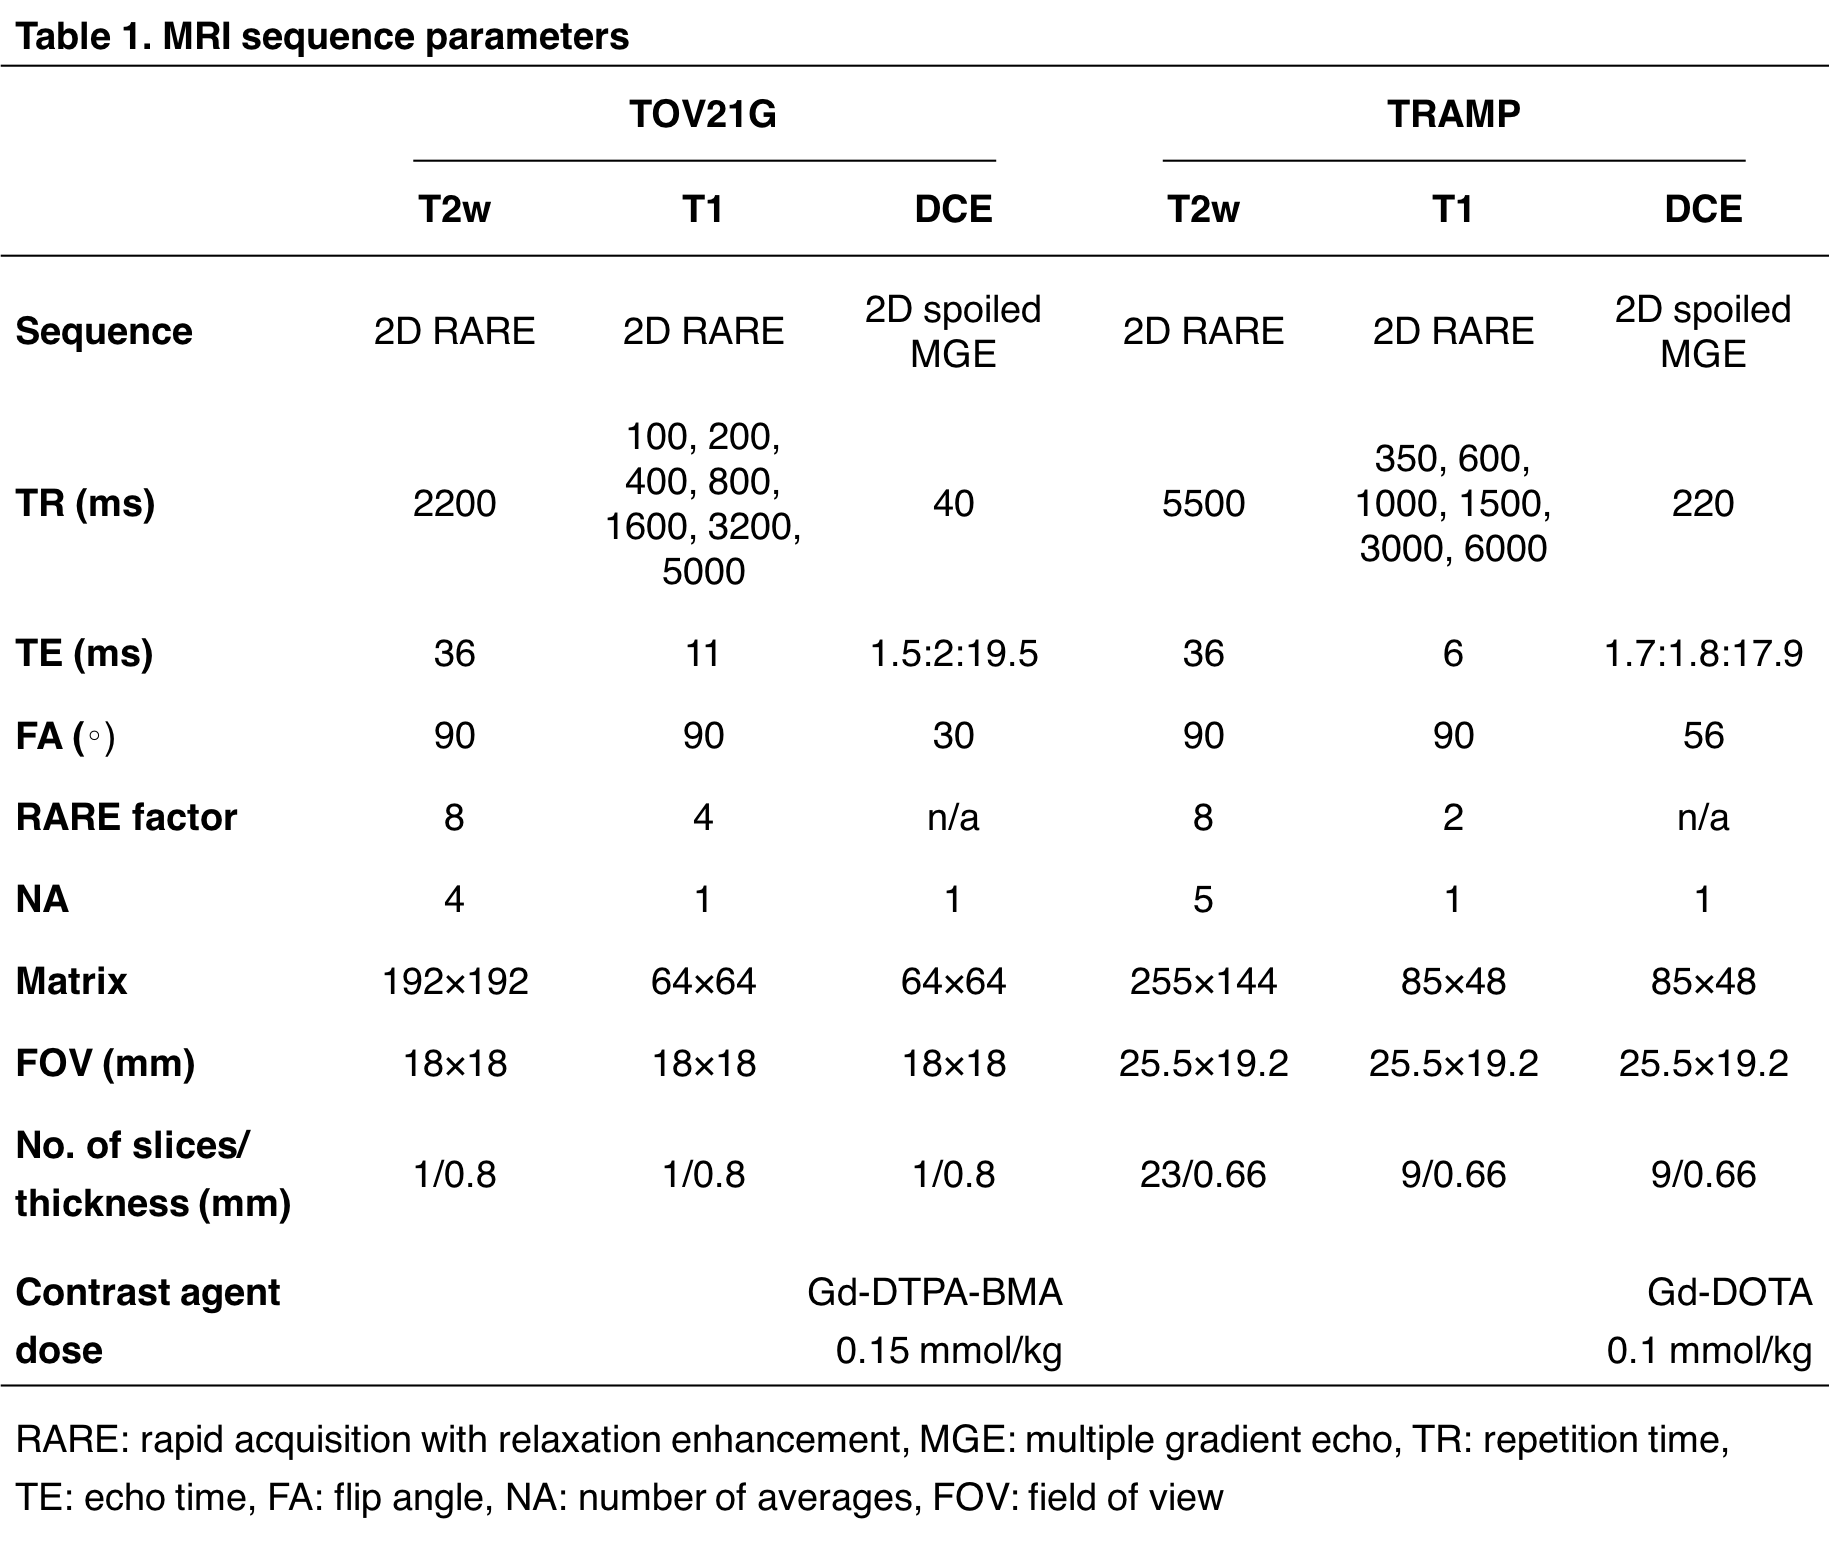
In vivo MRI using a Bruker 7T scanner was performed on a mouse bearing a subcutaneous TOV21G human ovarian cancer xenograft on the hind limb (n=1) and on transgenic adenocarcinoma of the mouse prostate (TRAMP) mice (n=7). High-resolution T2w images were acquired for delineation of tumor/prostate regions of interest (ROI). A RARE sequence with variable TRs was used for calculation of baseline R1. DCE-MRI data were acquired using a spoiled multiple gradient-echo sequence (sequence details in Table 1).
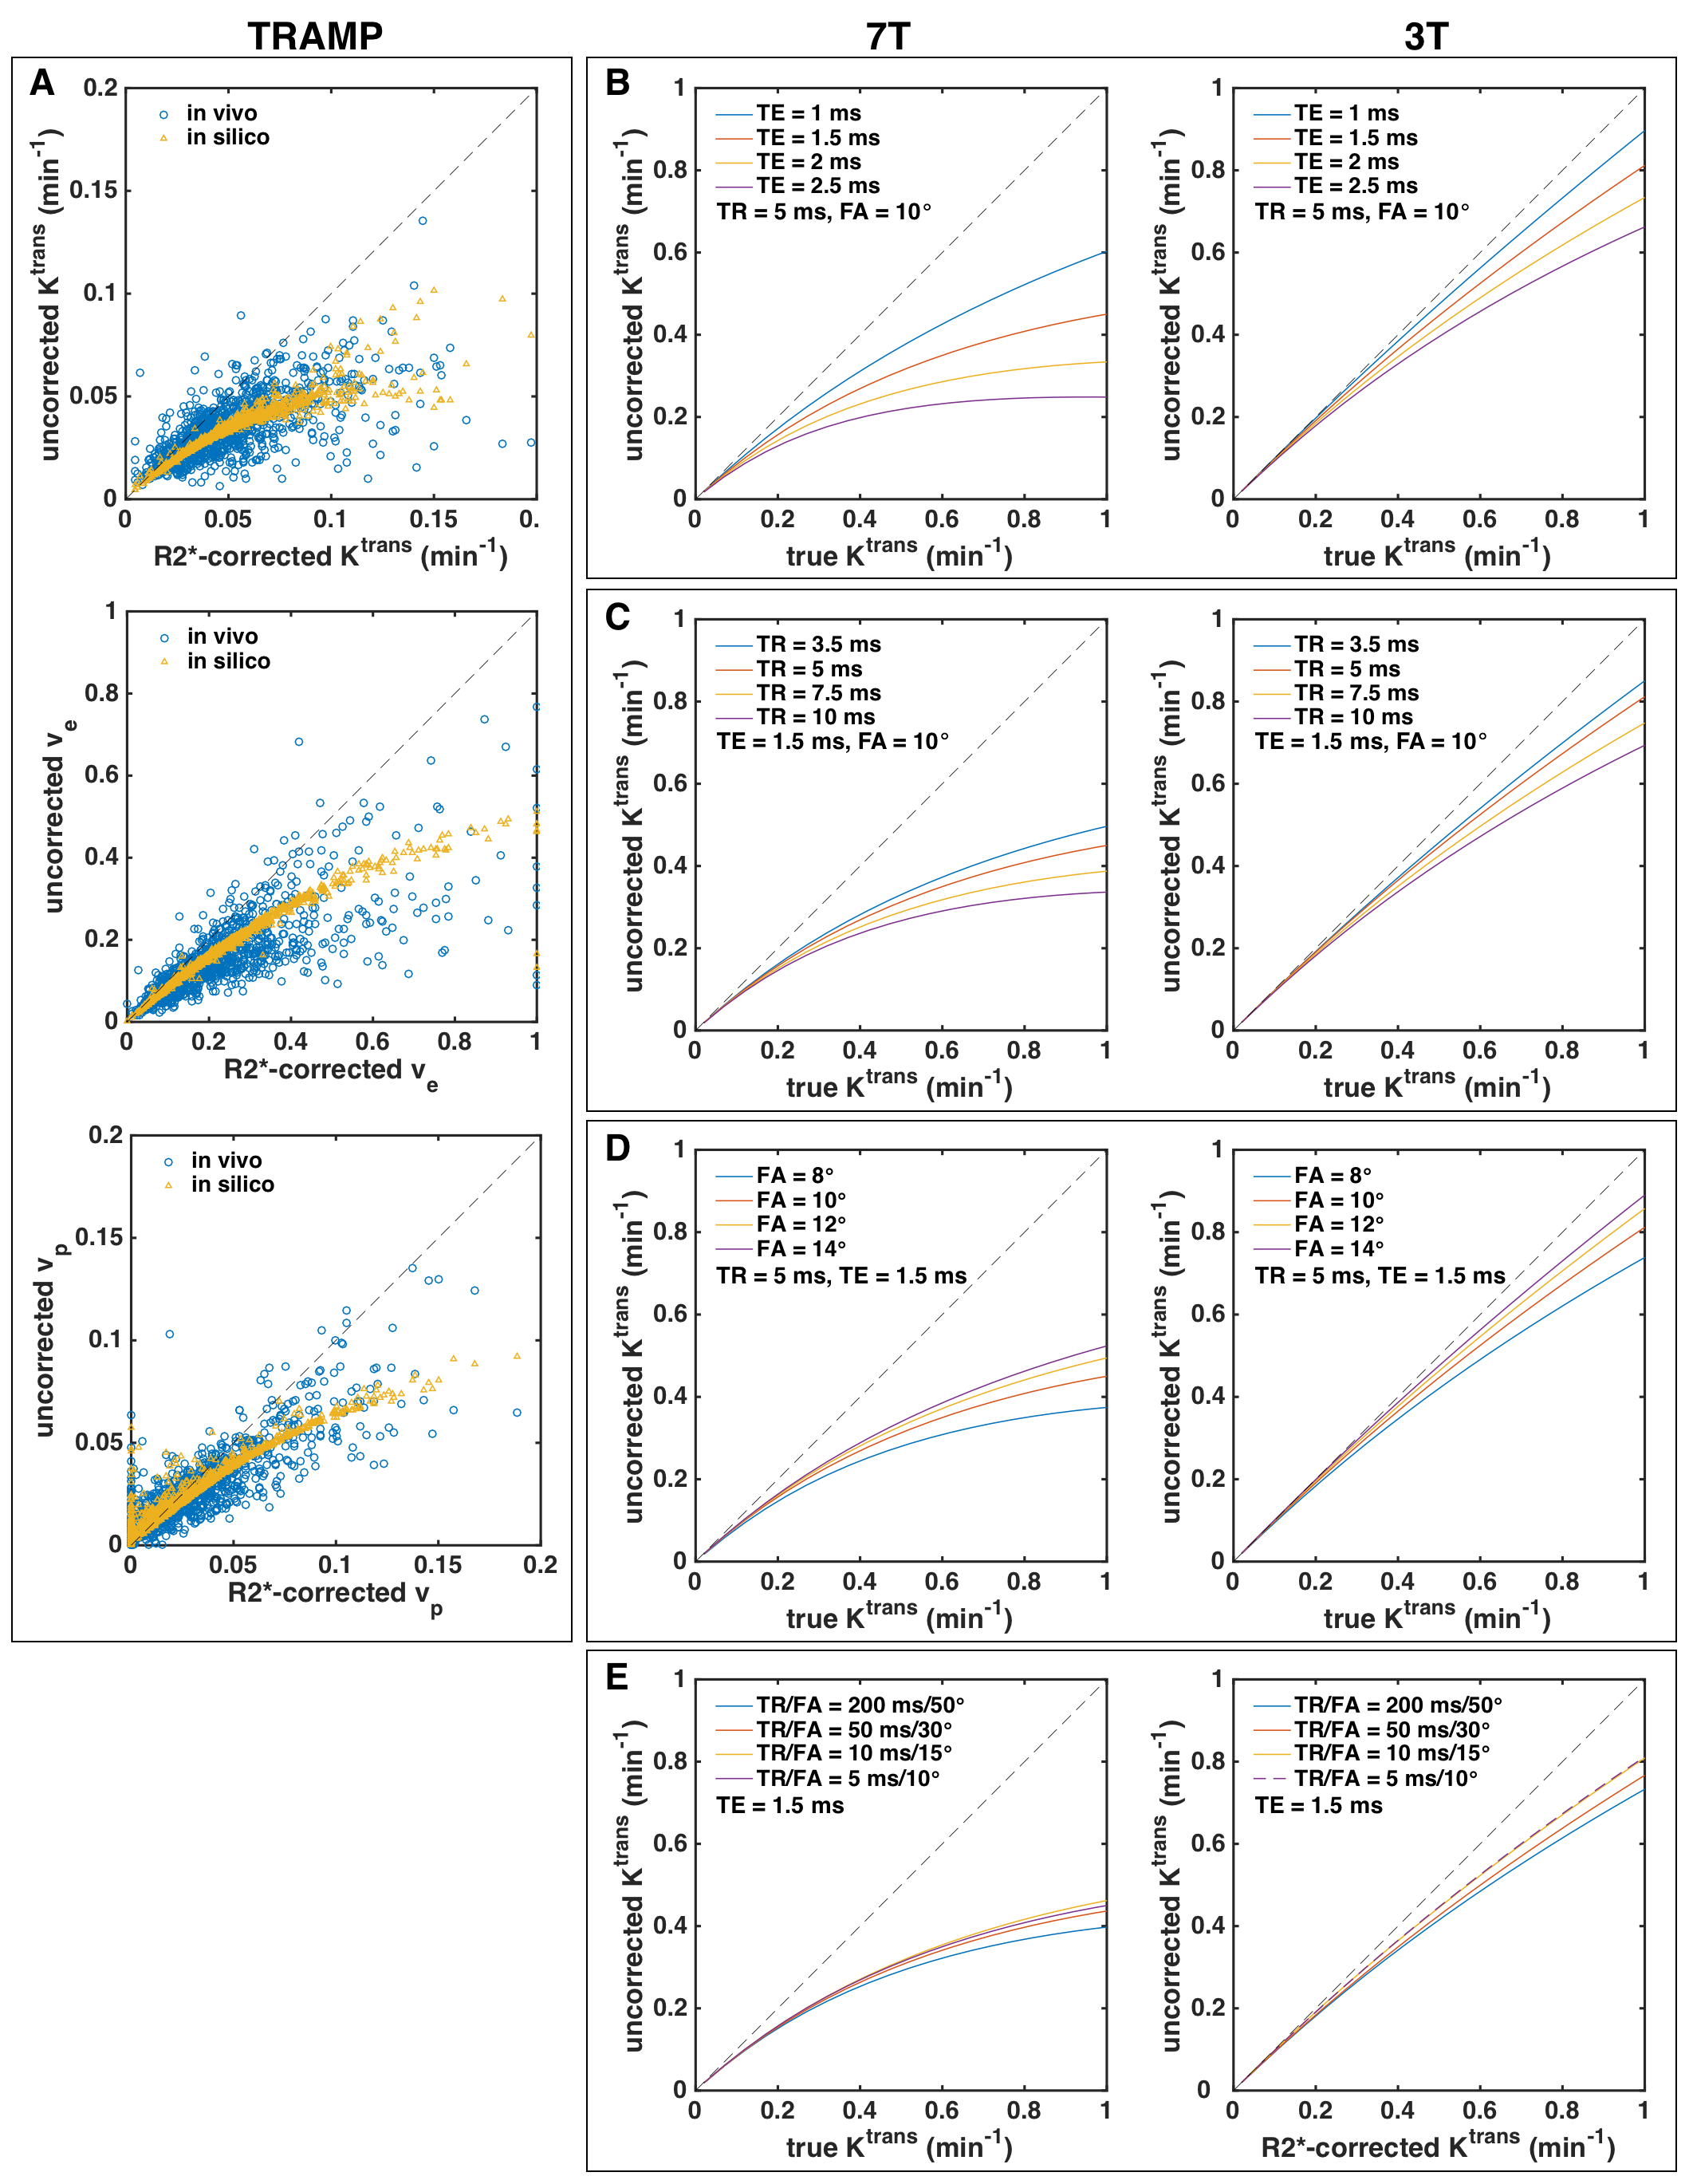
Dynamic R2* maps were computed from multi-echo-DCE-MRI data using mono-exponential fitting. R2*-corrected DCE analysis was performed using the estimated signal intensities at TE=0 obtained from the fitting; standard, uncorrected analysis was performed using the first echo signal intensity. For pharmacokinetic analysis, population-based bi-exponential AIFs and the extended Tofts model were used to estimate Ktrans, ve, and vp. All analyses were performed voxel-wise for manually defined tumor/prostate ROIs. Non-enhancing voxels (signal enhancement one minute post-injection ≤50%) and voxels with poor fits (R2≤0.5) were excluded.
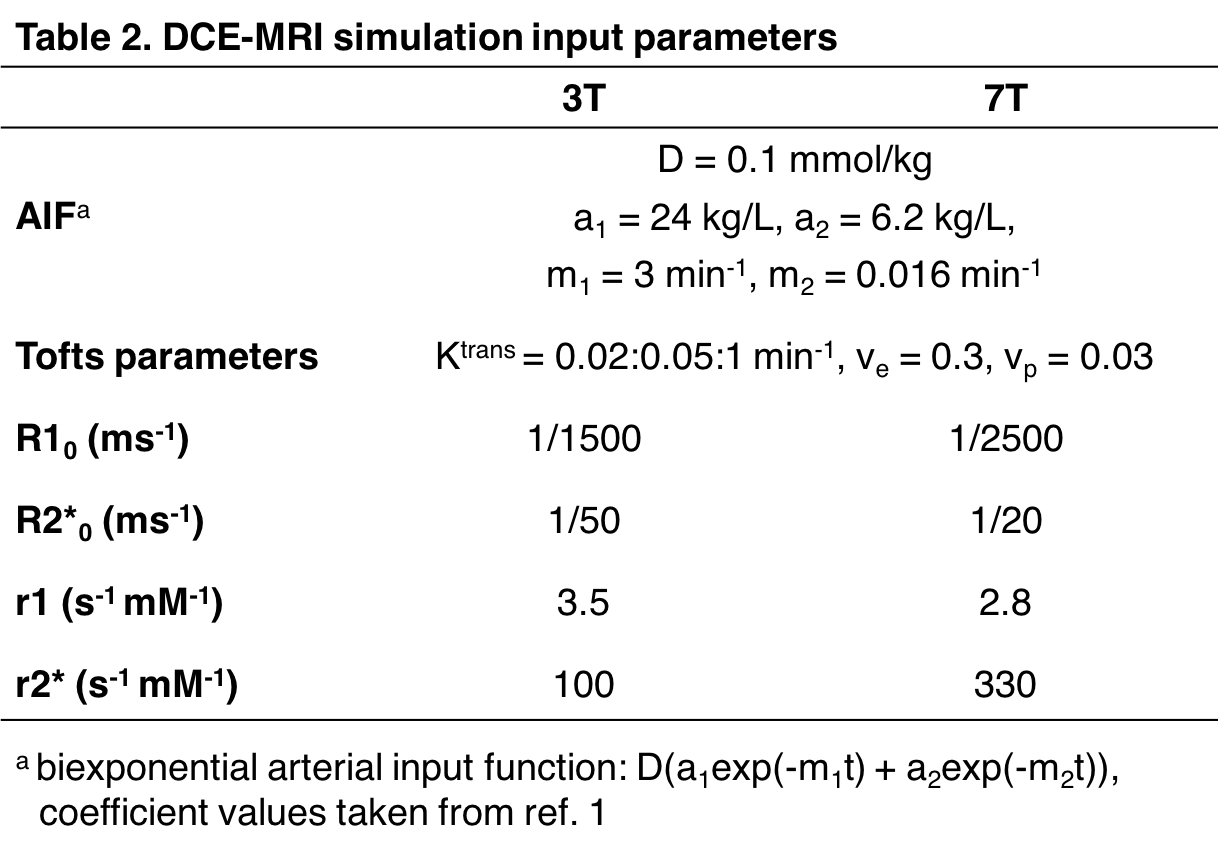
Simulations were performed to further investigate the R2* effect on DCE-MRI. Concentration-time curves were generated using the extended Tofts model and subsequently converted to R1- and R2*-time curves assuming constant r1 and r2* relaxivities. These were then fed into the Bloch equations to simulate the DCE-MRI signal, from which the Tofts parameters were estimated without accounting for R2* relaxation. For validation, simulations were run using the in vivo parameters and R2*-corrected Tofts parameters measured from a TRAMP mouse. Then, using the constants presented in Table 21, the pulse sequence parameters TR, TE, and flip angle (FA) were varied to determine their influence on the R2* effect.
Results
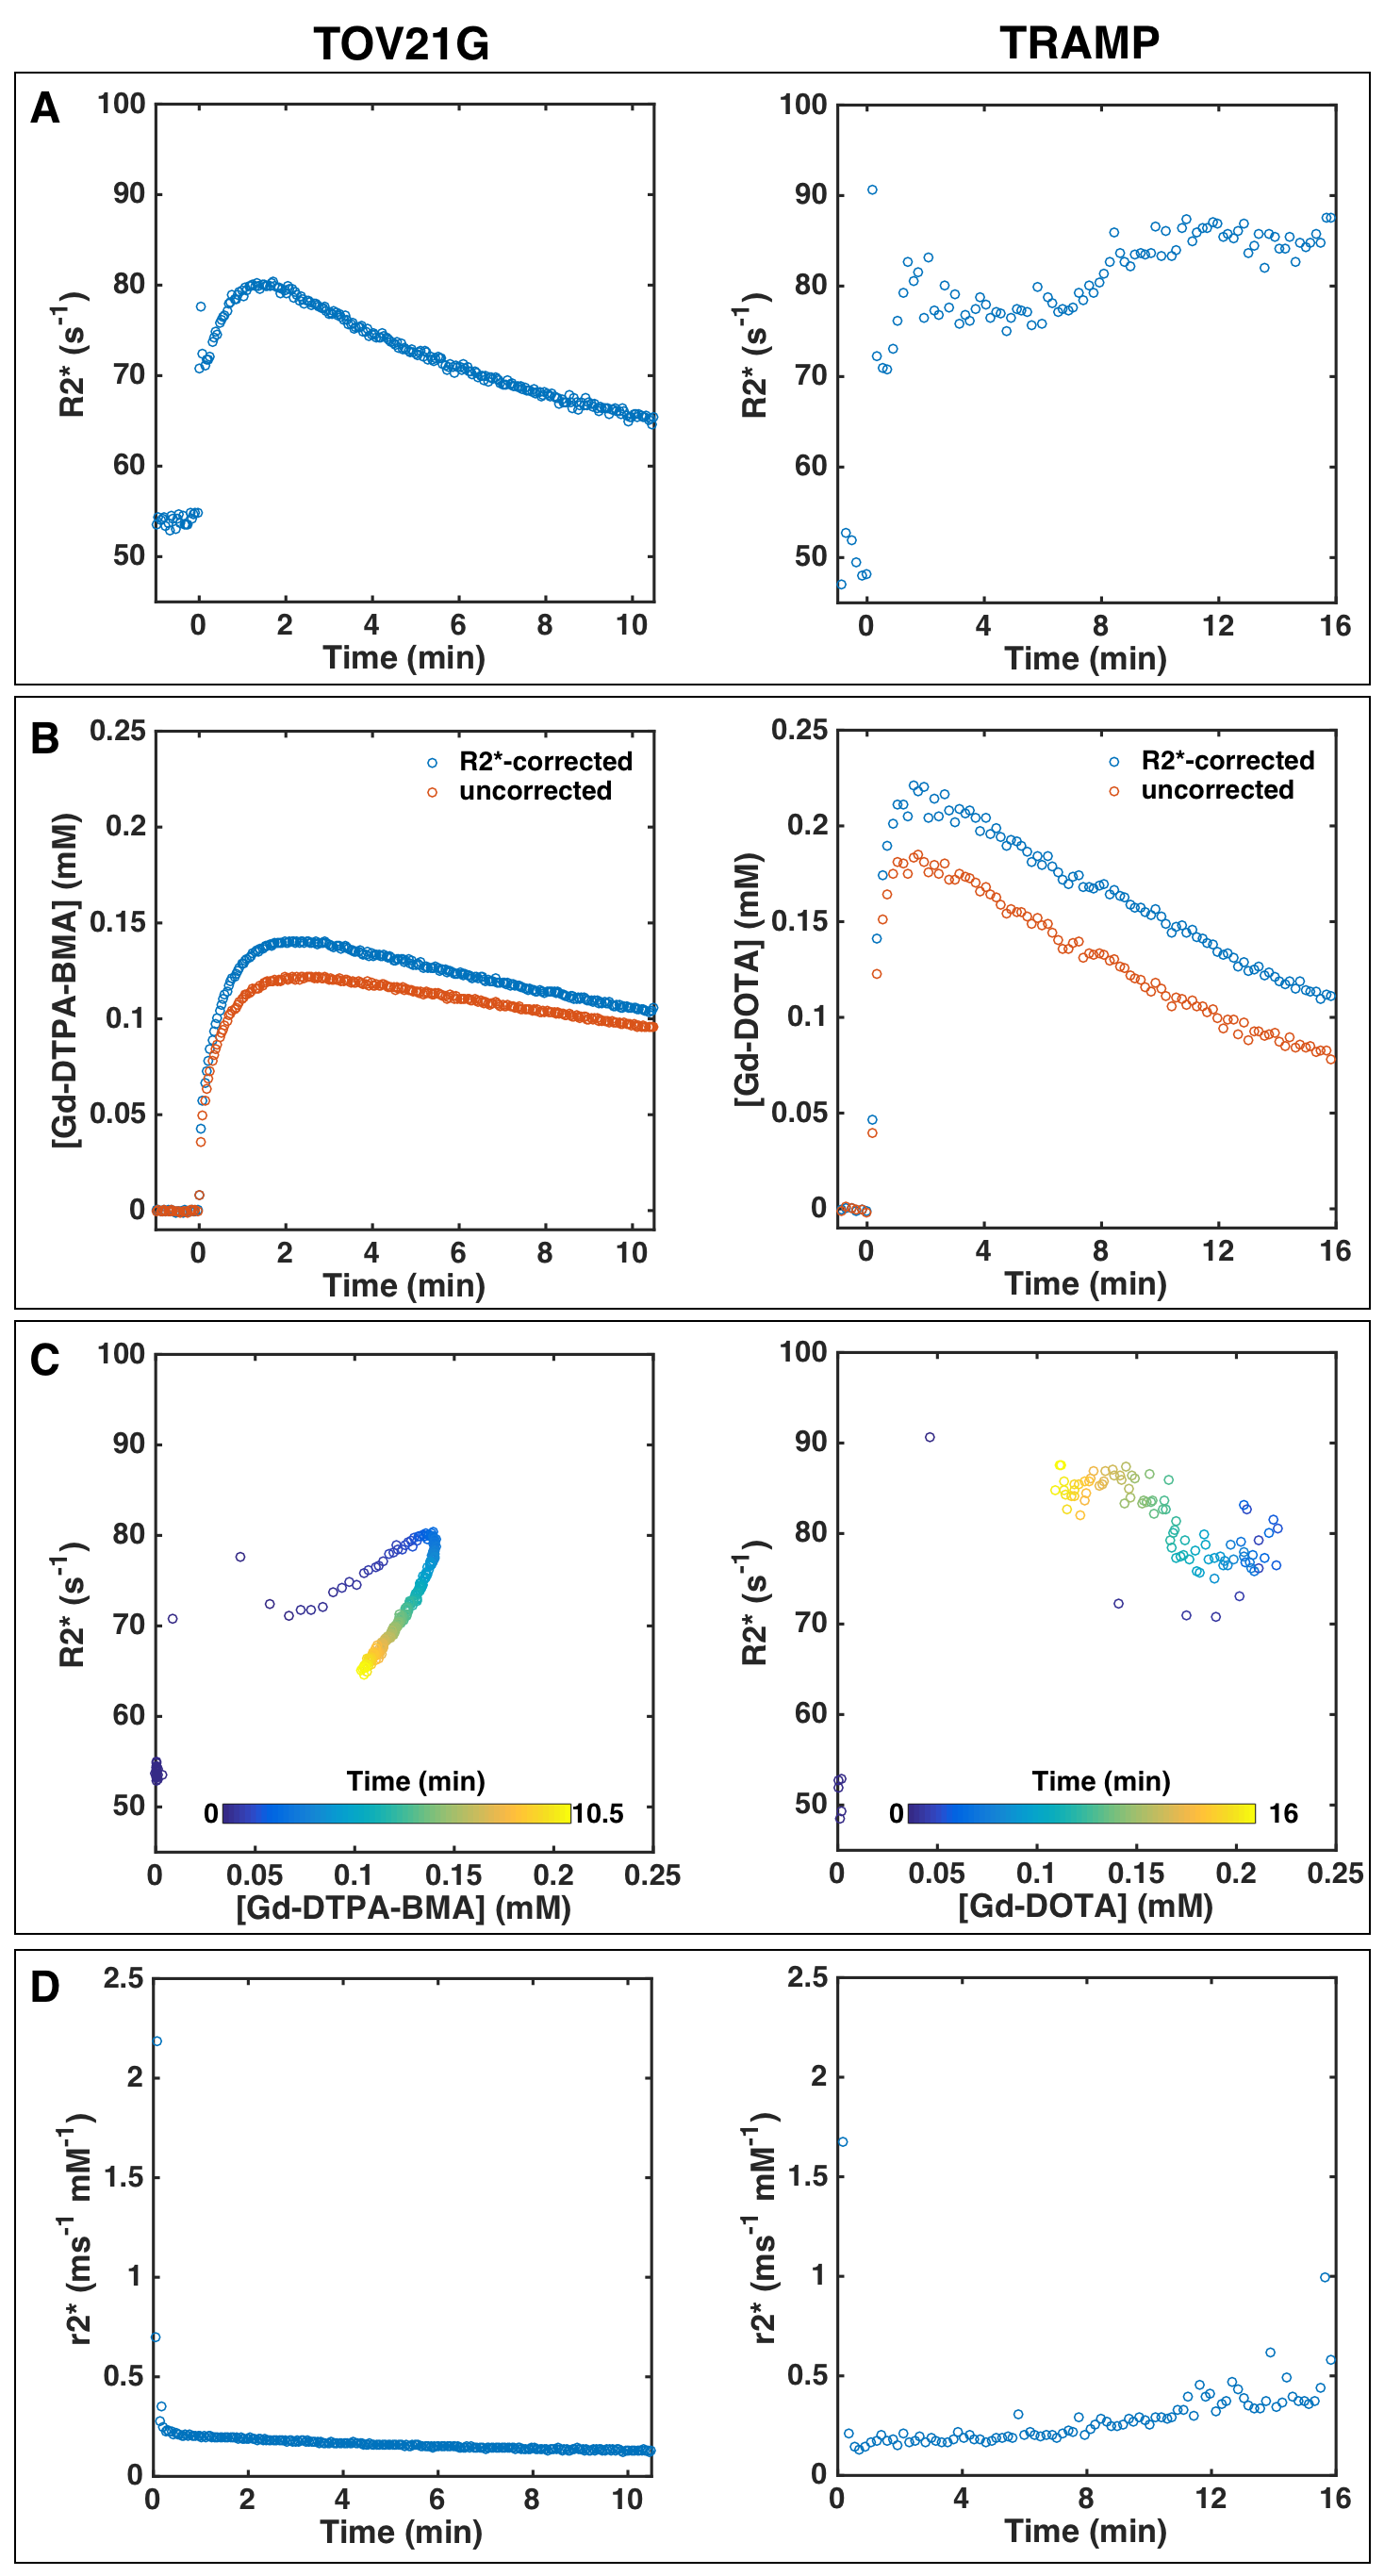
Gadolinium-based contrast agent (GBCA) administration significantly enhanced R2* relaxation (Figure 1A), which resulted in underestimation of GBCA concentration when R2* relaxation was not accounted for (Figure 1B). R2* did not have a simple linear dependence on GBCA concentration but exhibited non-monotonic, hysteretic behavior (Figure 1C). Immediately after contrast agent injection, r2* was very high (Figure 1D) when the GBCA was still compartmentalized in the blood vessels and quickly dropped as the agent extravasated. The spatiotemporal mean r2* relaxivities were 0.34 and 0.33±0.16 (group mean±s.d.) ms-1 mM-1 for TOV21G (Gd-DTPA-BMA) and TRAMP (Gd-DOTA), respectively.
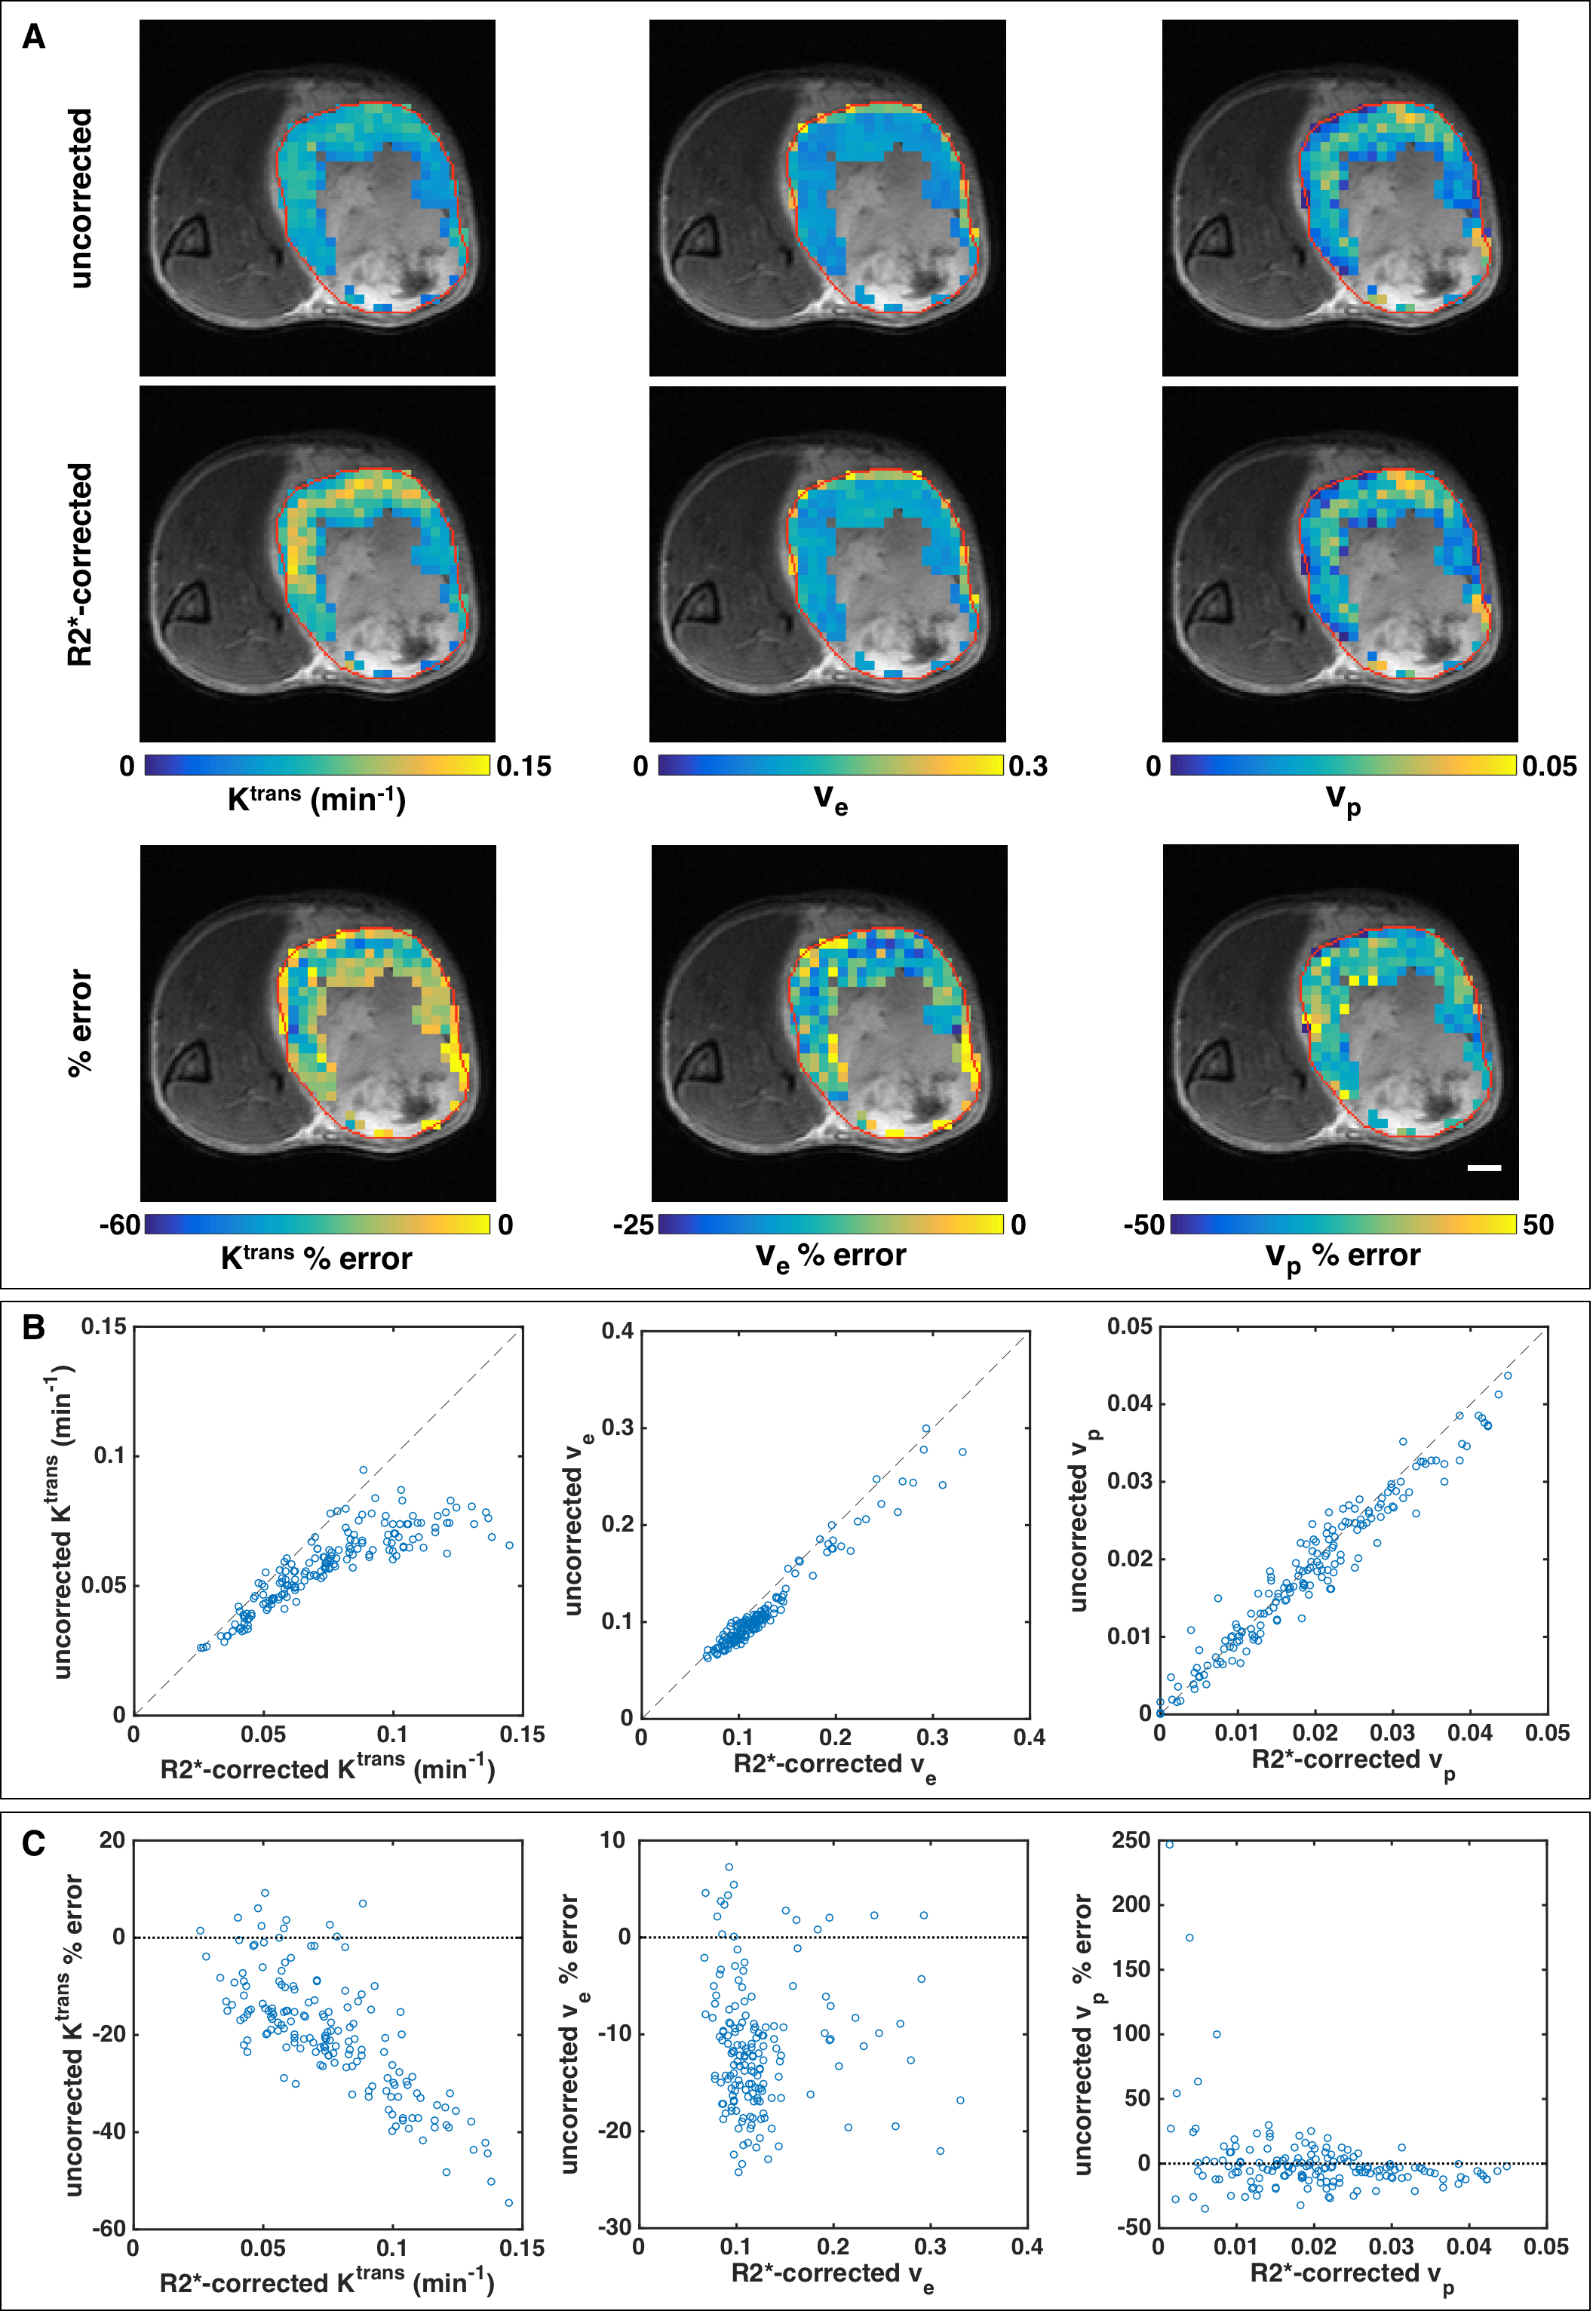
In the TOV21G tumor, failing to correct for R2* resulted in a 20% median underestimation of Ktrans, but the percent error increased with Ktrans and approached 60% underestimation in highly perfused regions (Figure 2). The median percent errors for ve and vp were -12% and -4%, respectively. For the TRAMP mice, Ktrans, ve, and vp were underestimated by 18%±5%, 20%±5%, and 9%±5%, respectively. Median percent errors are reported because of outliers with small parameter values and large percent errors (Figure 2C, right column).
Simulated Tofts parameters were in good agreement with the corresponding in vivo data (Figure 3A). For all three parameters, R2* decay had similar nonlinear effects on quantitative accuracy. Thus, further simulations focused on Ktrans only. As expected, shortening TE decreased the R2* effect (Figure 3B), but achieving very short TEs is often unfeasible with standard DCE-MRI sequences. The R2* effect can also be reduced by decreasing TR or increasing FA (Figure 3C-D). However, the optimal FA with regards to SNR, CNR, and reproducibility decreases with decreasing TR2; so there is limited ability to minimize the R2* effect by adjusting these sequence parameters (Figure 3E).
Discussion
A previous study performed at 4.7T found that not correcting for R2* decay led to 14% and 8% underestimation of Ktrans and ve, respectively, in colorectal tumor xenografts3. These errors are smaller, presumably because of the lower field strength, but in line with our results. Ktrans appears most affected and vp least affected by R2*. The non-linearity of the R2* effect makes it difficult to correct retrospectively; it limits the dynamic range of contrast enhancement, thereby reducing the conspicuity of highly perfused/angiogenic regions (Figure 2A); and it could obfuscate assessment of treatment response, particularly to anti-angiogenic drugs. Heavily T1-weighted sequences are used for DCE-MRI to minimize the R2* effect, but this may not be enough at 7T or even at 3T for highly perfused tissue or AIF measurement4,5. Multi-echo acquisition enables correction of R2* decay and improves the accuracy of DCE-MRI at high field strengths.Acknowledgements
This work was funded by the Liaison Committee between the Central Norway Regional Health Authority and the Norwegian University of Science and Technology (NTNU).References
1. Schmid VJ, Whitcher B, Padhani AR, and Yang GZ. Quantitative analysis of dynamic contrast-enhanced MR images based on Bayesian P-splines. IEEE Trans Med Imaging. 2009;28(6):789-98.
2. De Naeyer D, Verhulst J, Ceelen W, et al. Flip angle optimization for dynamic contrast-enhanced MRI-studies with spoiled gradient echo pulse sequences. Phys Med Biol. 2011;56(16):5373-95.
3. Heilmann M, Walczak C, Vautier J, et al. Simultaneous dynamic T1 and T2* measurement for AIF assessment combined with DCE MRI in a mouse tumor model. Magn Reson Mater Phy. 2007;20(4):193-203.
4. de Bazelaire C, Rofsky NM, Duhamel G, et al. Combined T2* and T1 measurements for improved perfusion and permeability studies in high field using dynamic contrast enhancement. Eur Radiol. 2006;16(9):2083-91.
5. Kleppestø M, Larsson C, Groote I, et al. T2*-correction in dynamic contrast-enhanced MRI from double-echo acquisitions. J Magn Reson Imaging. 2014;39(5):1314-19.
Figures