4379
Differential diagnosis of hepatocellular carcinoma and hepatic metastases using Radiomics Features from Quantitative DCE-MRI1First Affiliated Hospital of Dalian Medical University, Dalian, People's Republic of China, 2GE Healthcare, Lifescience, China
Synopsis
To evaluate the value of Ktrans and HPI (hepatic arterial perfusion index), and their radiomics features in the differential diagnosis of hepatocellular carcinoma (HCC) and hepatic metastases from colorectal cancer (HM) using dynamics contrast enhanced MRI (DCE-MRI). Exchange model with dual input-based arterial input function was used to obtain the radiomics features that can provide a comprehensive assessment of tumors’ physiologic properties including vascular permeability, microcirculation and hemodynamic information. Our results indicated that IDM (Ktrans), inertia and correlation (HPI) are of great significance to differentiate HM and HCC.
Purpose
To investigate the value of Ktrans (the volume transfer constant from plasma to the extracellular extravascular space) and HPI (hepatic arterial perfusion index), and their radiomics features in the differential diagnosisdifferentiation of hepatocellular carcinoma (HCC) and hepatic metastases from colorectal cancer (HM) using radiomics features extracted from dynamics contrast enhanced MRI (DCE-MRI).Materials and Methods:
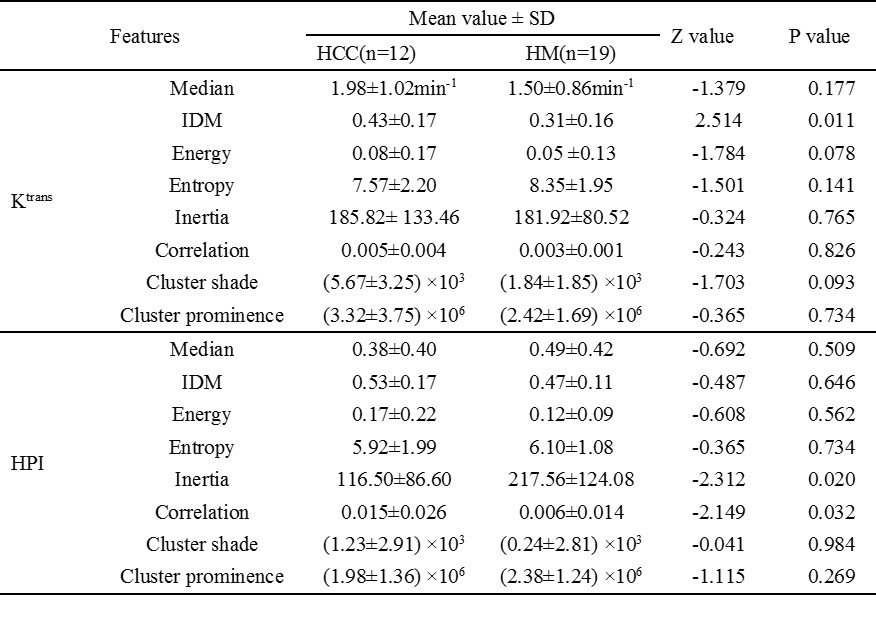
Institutional Review Board approval was secured for the collection and analysis of this retrospective study with a waiver of informed consent. We retrospectively collected data from 41 patients that were performed with HCC or metastasis who underwent pre-operative MRI exam between December 2015 and October 2016 were collected. Among them, 27 patients were Colorectal Adenocarcinoma with liver metastases and 14 were HCC, confirmed by imaging follow-up or by surgery and pathology. Inclusion criteria were as follows: patients without chemotherapy or radiation therapy, distance from focal to the edge of liver≧2.0 cm, tumor size≧1.0 cm. Finally, 31 cases were available for analysis, including 19 HM (61%) and 12 HCC (39%). All pre-operative MRI scans were performed on a 3.0 T scanners (GE Healthcare, Signa HDxt)., DCE-MRI were acquired with 3D LAVA sequence which was consisted of multi-Flip Angle (FA) contrast free image acquisition (FA=3°, 6°, 9°, 12°) for T1 mapping, and a continuous multiphase acquisition (FA=12°) to capture contrast media wash in and out. The flip and dynamic images were using the same parameters but different FA: TR/TE 3.1/1.3 ms; matrix 288*180, FOV 38 CM, slice thickness 5.0 mm, with 30 phases, 6 seconds each phase and a total of 6~7min. 0.1mmol/kg body weight of Gd-DTPA-BMA (Omniscan, GE) was injected after the first dynamic phase, at a rate of 3ml/s and followed by 20ml saline flush. All images were transferred to Omni-Kinetics software (GE Healthcare) for analysis. After motion correction by using 3D non-rigid registration, two radiologists reviewed the MRI images and defined the 2D region of interest (ROI) at the slice with the maximum diameter of the lesion. Exchange model with dual input-based arterial input function (AIF) was used to obtain the median value of Ktrans, HPI and the corresponding radiomics features included including shape, histogram and gray level covariant matrix (GLCM) texture features. Wilcoxon test was used to compare the differences of the GLCM textureradiomics features. Receiver operating characteristic (ROC) curve was plotted to assess diagnostic efficiency of them.Results:
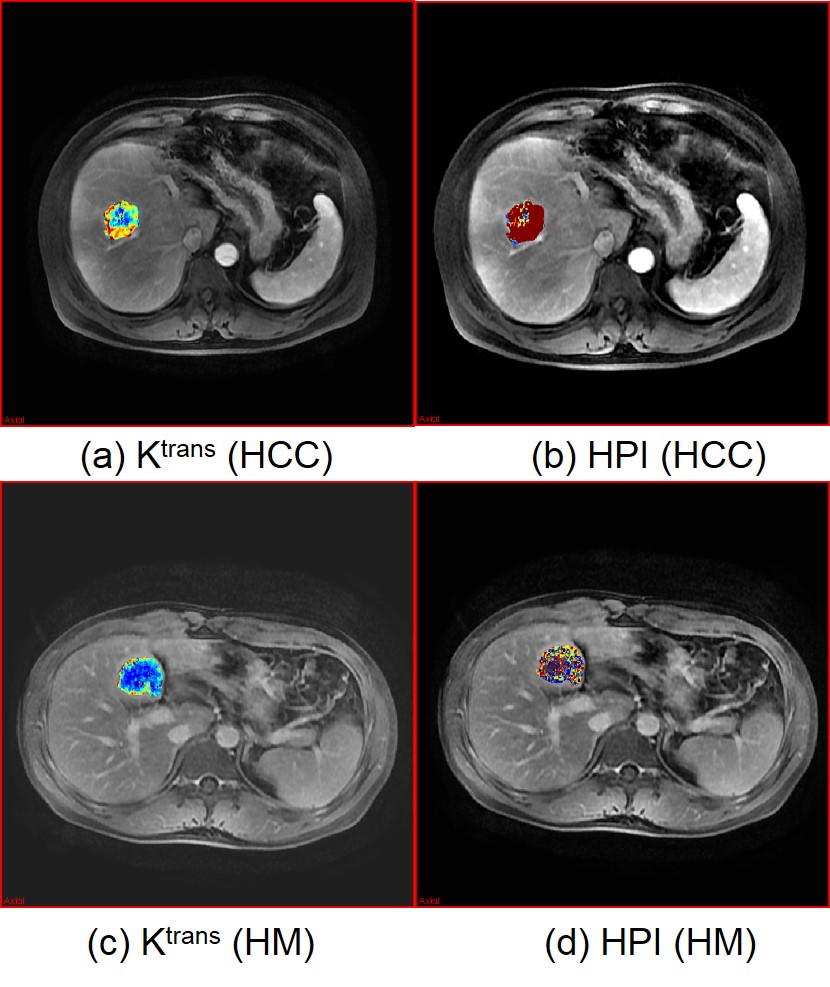
Median values of both ktrans and HPI had no statistical difference between the two groups. Inverse Difference Moment (IDM) from Ktrans, Inertia and Correlation from HPI were statistically significant between the two groups, P values were 0.011, 0.020 and 0.032, respectively. There were no differences between HCC and HM about other texture features (Shown in Table 1). The corresponding color maps were shown in Figure 1.
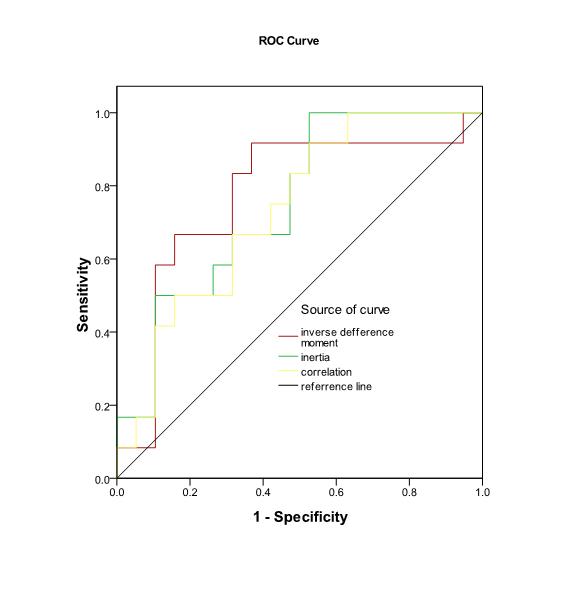
When IDM (Ktrans)≥0.29, Inertia (HPI)≤247.53 or Correlation(HPI)≥0.0018, area under the ROC curve (AUC) related to the diagnosis of HCC were 0.772, 0.750 and 0.732, respectively. Sensitivity were 91.7%, 100% and 91.7%, respectively. Specificity were 63.2%, 52.6% and 63.2%, respectively. (Shown in Figure 2)
Discussion:
The liver is a dual vascular supplied organ which is supplied by both the portal vein (75%) and the hepatic artery (25%)[1]. A new vascular network in both HCC and HM that increases the arterial supply rather than the portal supply develops to meet increased oxygen and metabolic demands[2]. Hemodynamic change of a lesion is one of the essential factors for diagnosing liver disease because most liver diseases and tumors affect blood flow either regionally or in general. The median HPI values obtained from the HM and HCC were significantly higher than those obtained from the whole liver[3]. The dual input pharmacokinetics model and extracted radiomics features made it possible to reflect vascular permeability, microcirculation and hemodynamic information so as to provide a more comprehensive assessment of tumors’ physiologic properties including heterogeneity and make individual treatment plan as well as therapeutic effect evaluations.
The GLCM texture features include the surface structure of the object arrangement of important information[4], IDM value reflects the local homogeneity of image texture. The larger the value is, the more uniformity the local image is. Correlation shows the linear dependency of gray level values in the GLCM and characterize the degree of fluctuation. Inertia measures the resolution of the image texture, the deeper the grooves are, the better the contrast is.
Conclusion:
Our results indicated that IDM (Ktrans), inertia and correlation (HPI) are of great significance to differentiate HM and HCC.Acknowledgements
No acknowledgement found.References
[1] Keiko Miyazaki, David J. Collins, Simon Walker-Samuel, et al. Quantitative mapping of hepatic perfusion index using MR imaging: a potential reproducible tool for assessing tumor response to treatment with the antiangiogenic compound BIBF 1120, a potent triple angiokinase inhibitor. Eur Radiol. 2008, 18(7): 1414-1421.
[2] Kim KW, Lee JM, Kim JH, et al. CT color mapping of the arterial enhancement fraction of VX2 carcinoma implanted in rabbit liver: comparison with perfusion CT. Am J Roentgenol. 2011, 196(1):102-108.
[3] Kim KW, Lee JM, Klotz E, et al. Quantitative CT color mapping of the arterial enhancement fraction of the liver to detect hepatocellular carcinoma. Radiology. 2009,250(2):425-434.
[4] Haralick RM, Shanmugam K, dInstein IH. Textural features for image classification. System, Man and Cybernetics, IEEE Transactions on, 1973,(6):610-621.
Figures