4377
Utilizing correlations between Ktrans and plasma volume fraction estimates improves extended Kety modelling of DCE-MRI data1CRUK Cancer Imaging Centre, Division of Radiotherapy and Imaging, Institute of Cancer Research, Sutton, United Kingdom
Synopsis
The extended Kety model is widely used for deriving quantitative perfusion and vascularity measures from DCE-MRI. In practice the signal contribution from the plasma space can be low compared to the signal-to-noise ratio (SNR) of the data which leads to cases where Ktrans is non-zero (indicating delivery of contrast to the tissues), but where the plasma volume fraction is estimated as zero: a logical contradiction. This work describes a model and fitting methodology to overcome this that makes use of a relationship between Ktrans and the plasma volume fraction to ensure both are positive or both are zero.
Background
The extended Kety model1,2 (EKM) is widely used for deriving quantitative perfusion and vascularity measures from DCE-MRI. When applying this model it is assumed that the MR signal is sensitive to contrast in the plasma and extra-cellular spaces, but in practice the contribution from the plasma space can be low compared to the signal-to-noise ratio (SNR) of the data. This leads to cases where $$$K^{trans}$$$ (volume transfer constant) is non-zero – indicating the presence and therefore delivery of contrast to the tissues – but $$$v_p$$$ (plasma volume fraction) is estimated as zero: a logical contradiction. This work describes a model and fitting methodology to overcome this that makes use of a relationship between $$$K^{trans}$$$ and $$$v_p$$$ to ensure both are positive or both are zero.Methods
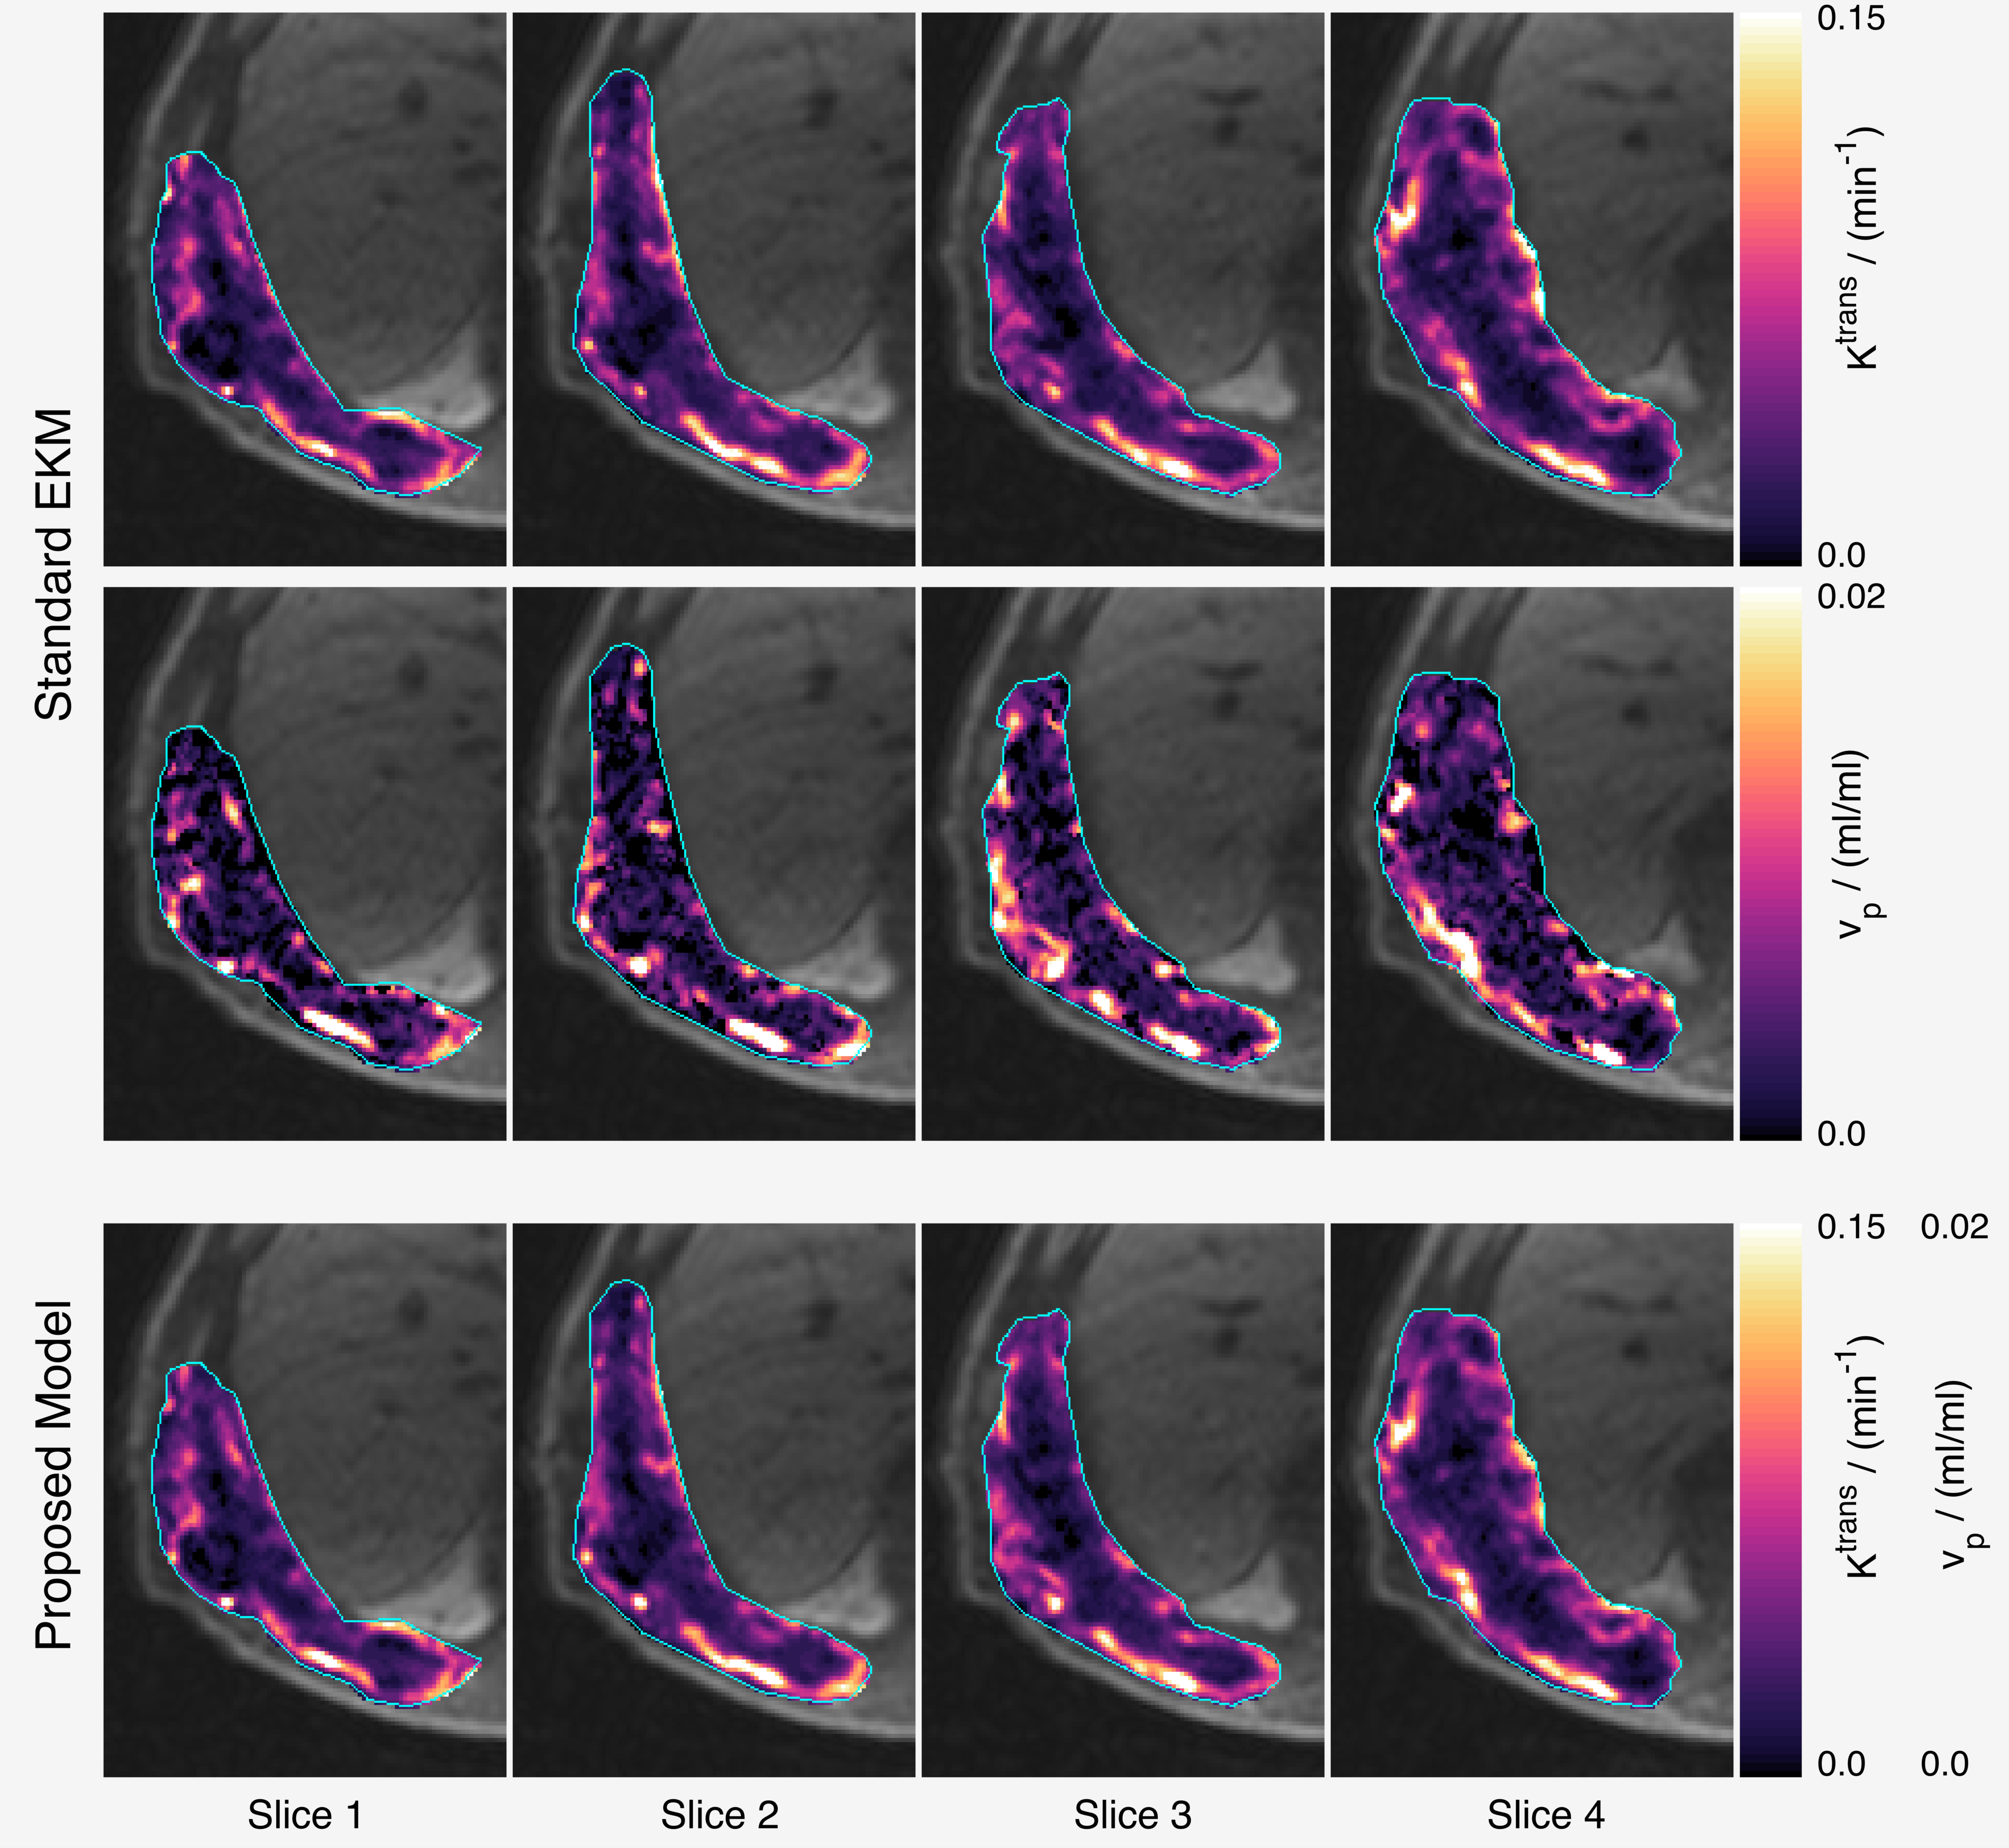
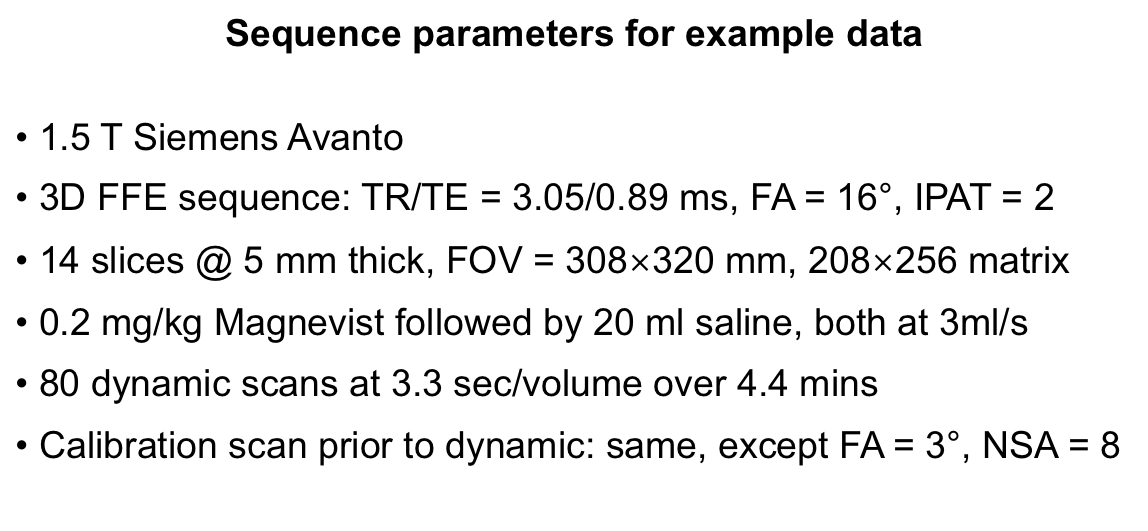
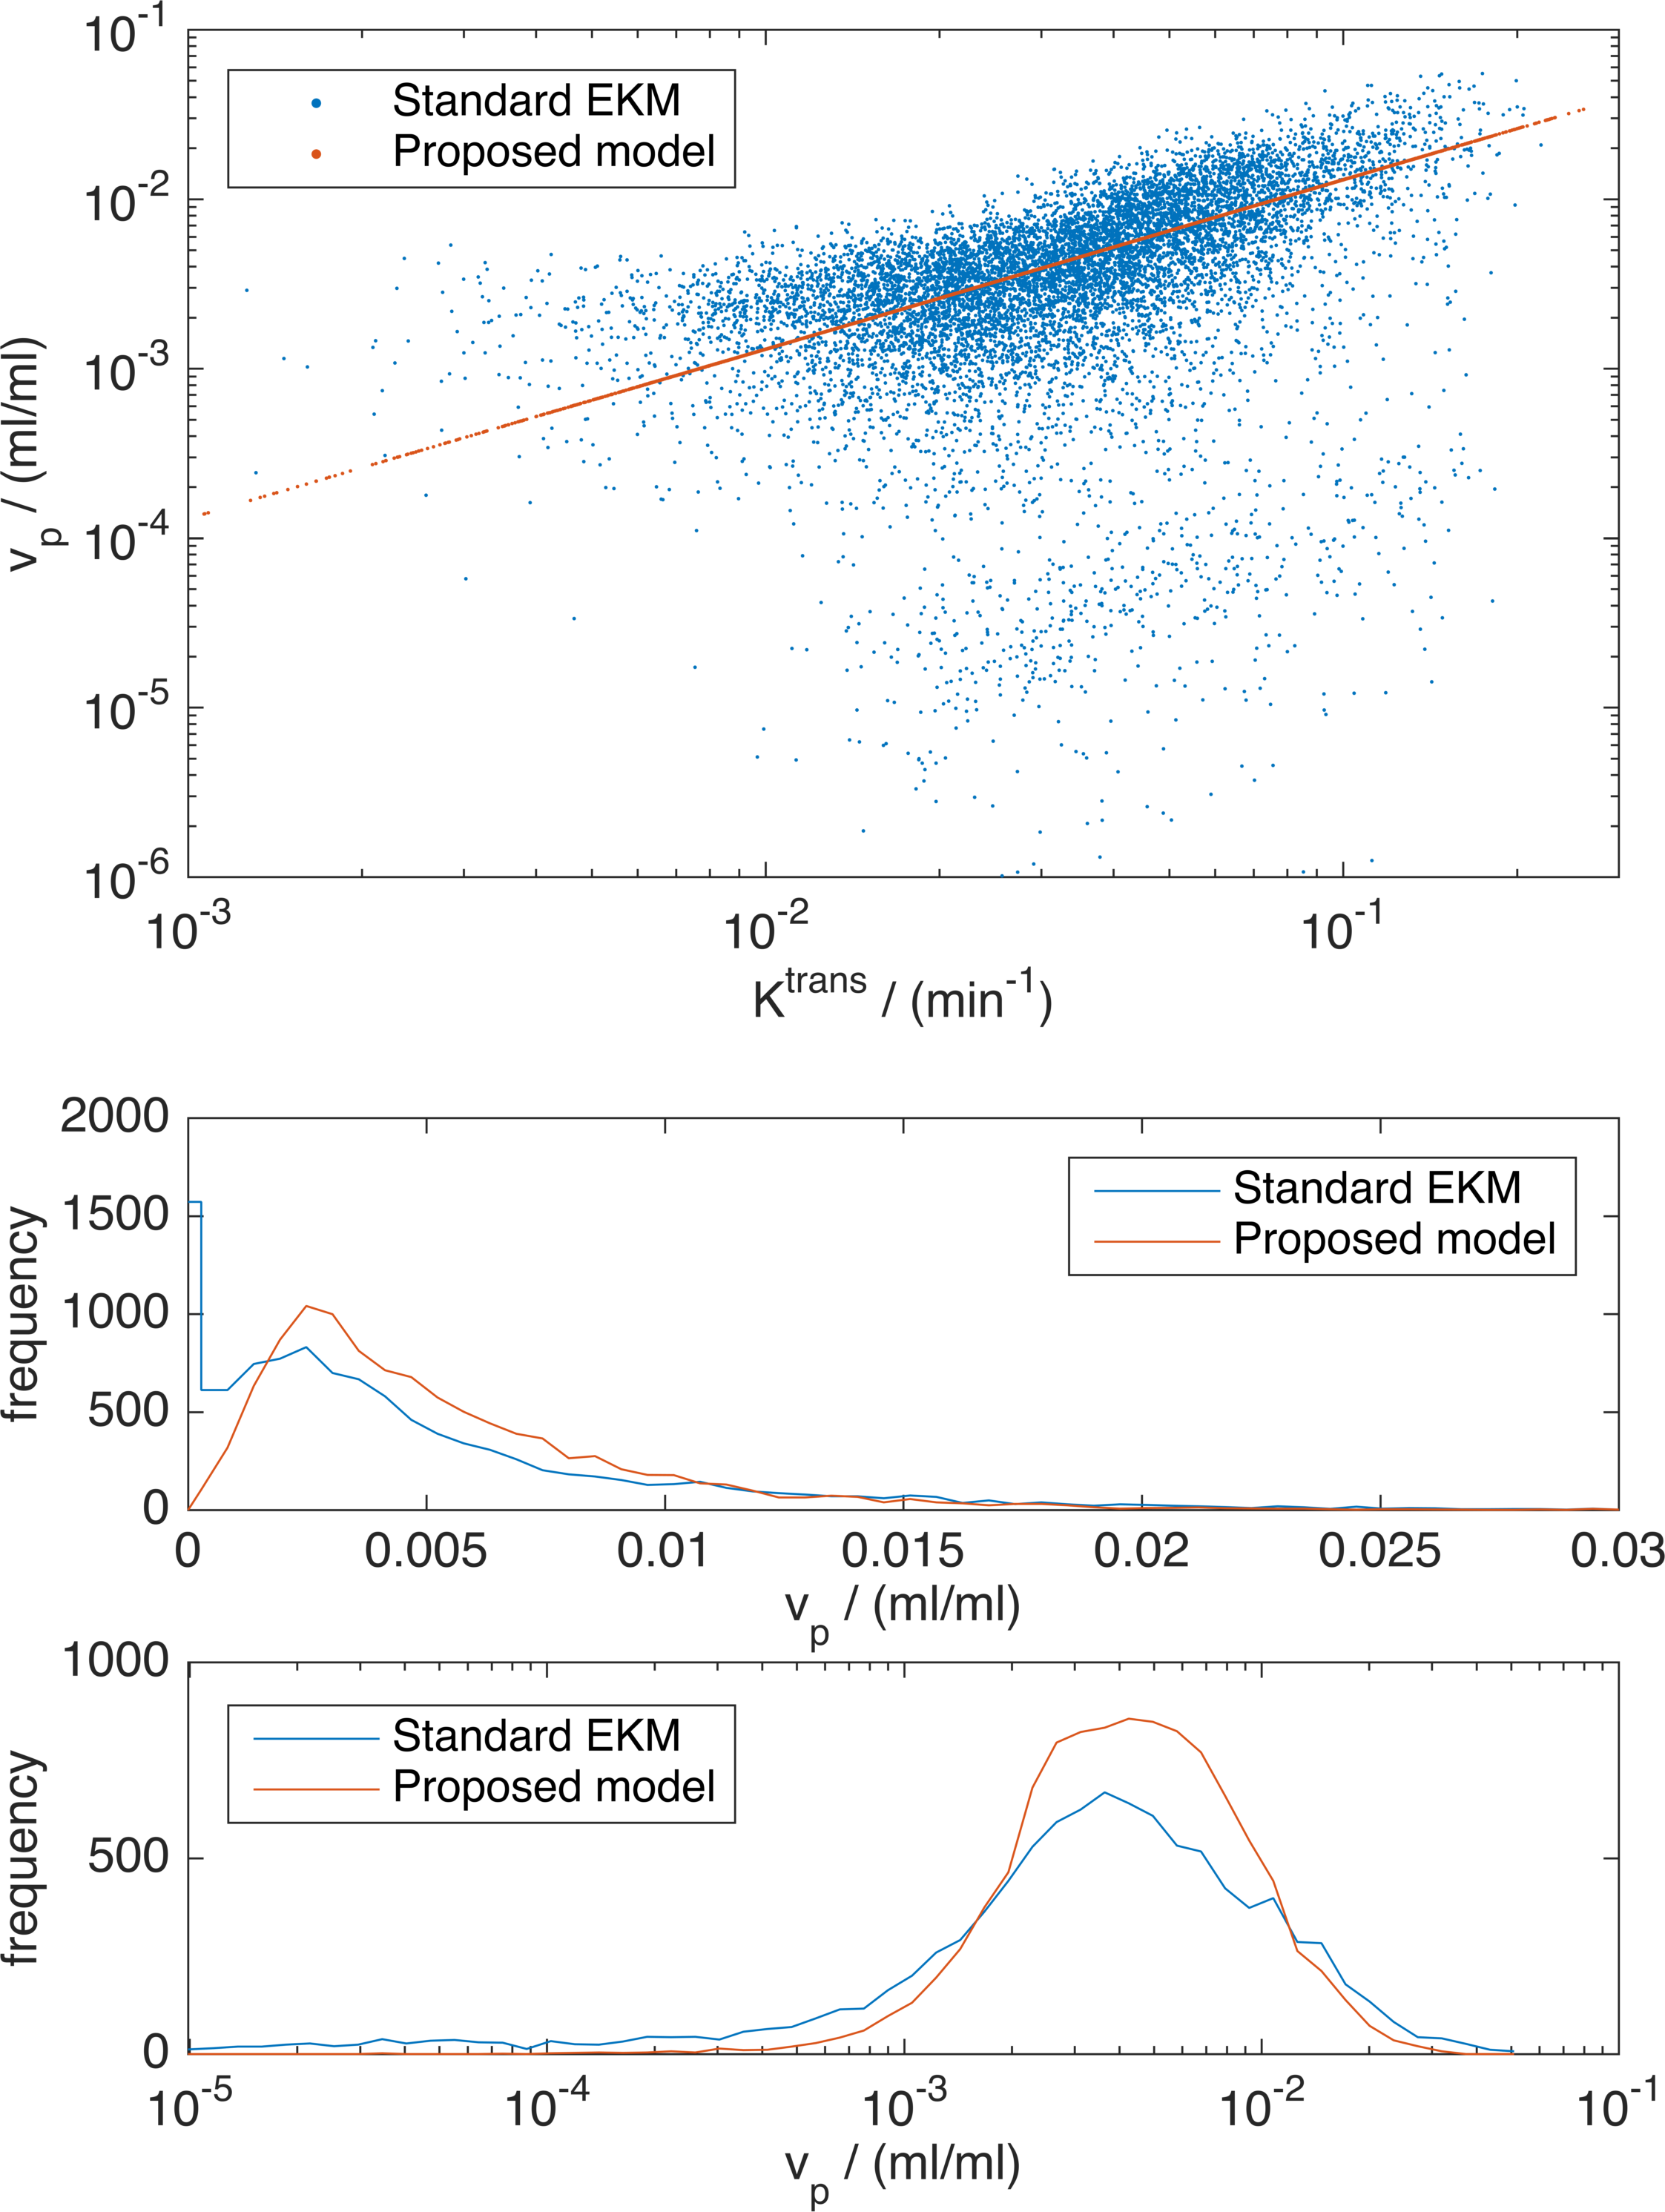
For a large class of two-compartment models the following relations apply: $$$v_\mathrm{p}=T_\mathrm{c}F_\mathrm{p}\;$$$and $$$K^\mathrm{trans} = EF_\mathrm{p},\;$$$where $$$T_\mathrm{c}=\;$$$capillary mean transit time, $$$F_\mathrm{p}=\;$$$plasma flow, and $$$E=\;$$$extraction fraction. Let $$$\beta=T_\mathrm{c}/E,\;$$$then $$$v_\mathrm{p}=\beta{}K^\mathrm{trans},\;$$$so that if $$$K^\mathrm{trans}>0,\;v_\mathrm{p}\;$$$cannot be zero since $$$E<1\;$$$and $$$T_\mathrm{c}>0$$$. Figure 1 presents maps of $$$K^\mathrm{trans}\;$$$and $$$v_\mathrm{p}\;$$$obtained from a chest wall mass, showing a striking correlation between these parameters in this example when fitted with the EKM (see figure 2 for the measurement parameters for these data). Figure 3 presents the corresponding scatter plot showing the same correlation, and also the presence of two clusters of voxels – the upper cluster correlates with $$$K^\mathrm{trans},\;$$$the lower has small $$$v_\mathrm{p}\;$$$estimates that are likely to be underestimates due to poor SNR. Given the above relation between $$$v_\mathrm{p}\;$$$and $$$K^\mathrm{trans},\;$$$the observed correlation suggests that in these data, $$$\beta\;$$$is approximately constant over the tumor, so we directly incorporate this condition into the modelling framework to avoid the contradiction identified above. The total tissue concentration for the EKM is
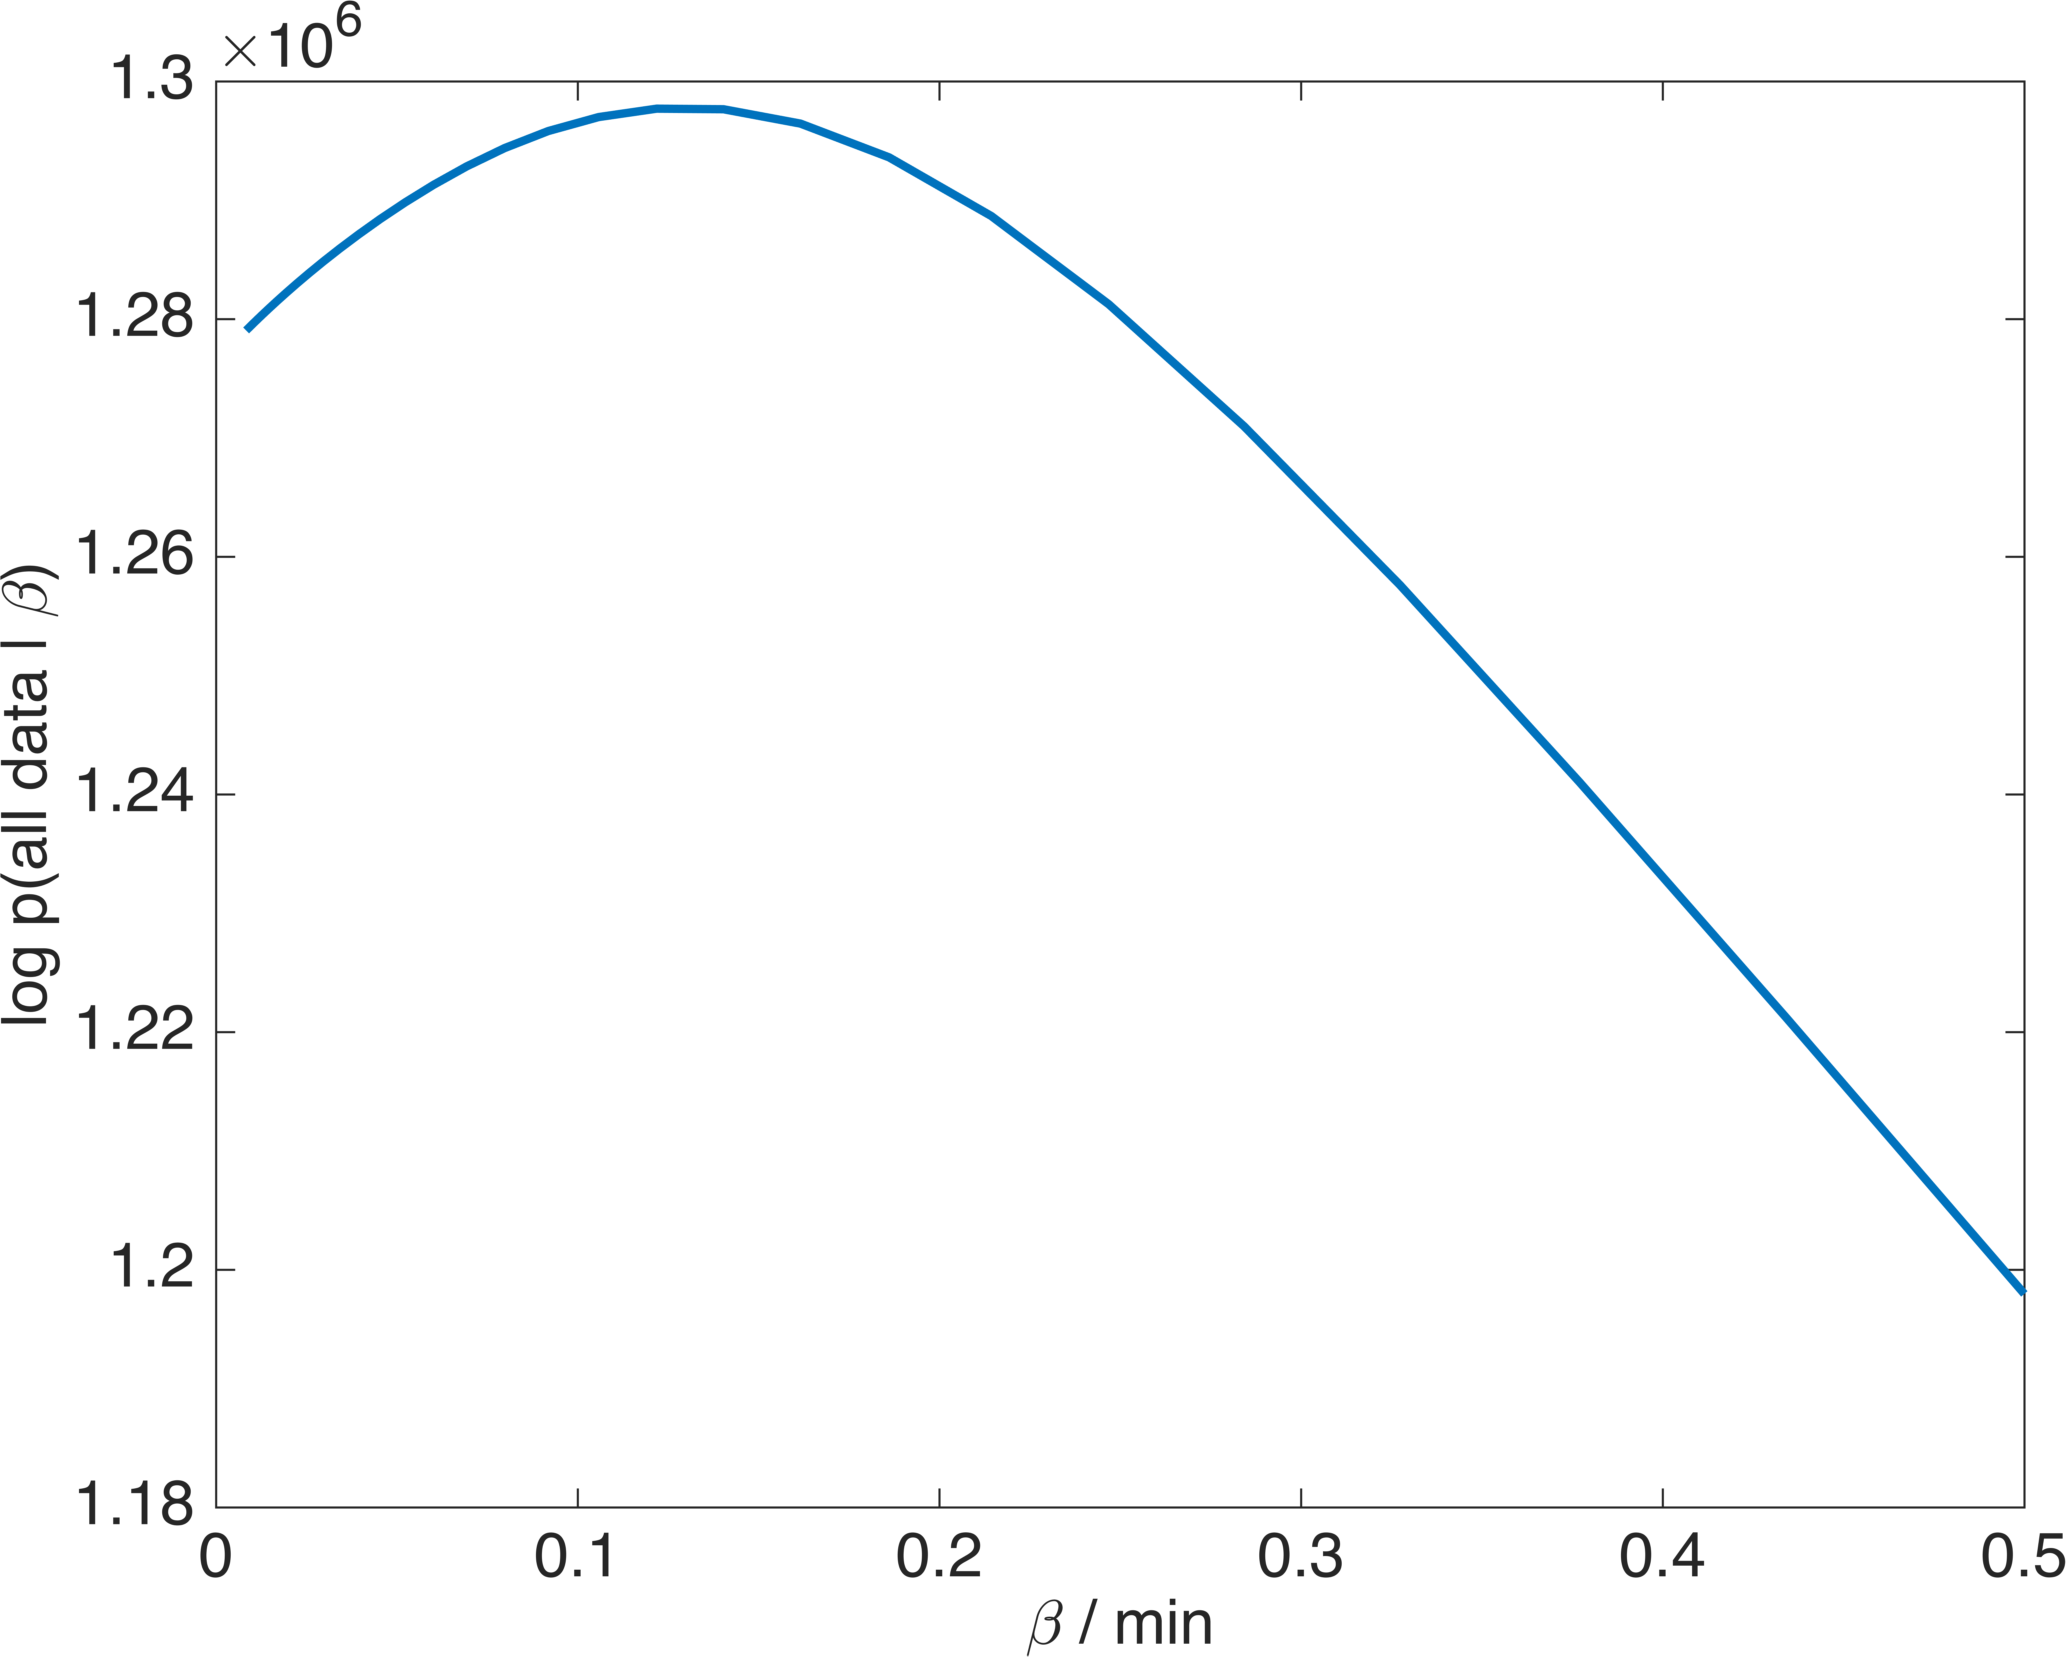
$$C_\mathrm{t}(t+t_\mathrm{0})\;\;=\;\;v_\mathrm{p}C_\mathrm{p}(t)+K^\mathrm{trans}C_\mathrm{p}(t)\otimes\exp(−k_\mathrm{ep}t)\;\;=\;\;K^\mathrm{trans}C_\mathrm{p}(t)\otimes\left(\beta{}\delta(t)+\exp(−k_\mathrm{ep}t)\right)$$ where $$$C_\mathrm{p}(t)$$$ is the arterial input function, $$$K^\mathrm{trans},\;k_\mathrm{ep}\;$$$and$$$\;t_\mathrm{0}\;$$$are to be estimated per voxel, and $$$\beta\;$$$is the same value for all voxels. To estimate $$$\beta\;$$$we use a Bayesian approach as follows. The voxel parameters (and their uncertainty) are accounted for with the marginalized likelihood for the data in voxel $$$i$$$ $$p\big(\mathrm{data}_i\;|\;\beta\big)=\int\!\!\!\!\int\!\!\!\!\int{}p\!\left(\mathrm{data}_i\;|\;K^\mathrm{trans},\,k_\mathrm{ep},\,t_\mathrm{0},\,\beta\right)\;p\!\left(K^\mathrm{trans},k_\mathrm{ep},t_\mathrm{0}\right)\;\mathrm{d}K^\mathrm{trans}\;\mathrm{d}k_\mathrm{ep}\;\mathrm{d}t_\mathrm{0}$$ where the first term under the integral is the data likelihood (Gaussian noise with a Jeffrey’s prior for the noise variance4) and the second term is the prior distribution over the voxel parameters (uniform over$$$\;$$$0$$$\,<K^\mathrm{trans},\,k_\mathrm{ep}<\,$$$3$$$\;$$$min-1, and uniform over 10 sec interval for $$$t_\mathrm{0}$$$). This integral is evaluated using a fixed grid (N=50) for $$$K^\mathrm{trans},\,k_\mathrm{ep}\;$$$and$$$\;t_\mathrm{0}$$$. Since $$$\beta\;$$$is taken to be constant over the volume, the complete marginalized likelihood for the whole tumour is $$p\big(\mathrm{all}\;\mathrm{data}\;|\;\beta\big)=\prod_ip\big(\mathrm{data}_i\;|\;\beta\big)$$ from which the maximum likelihood estimate of $$$\beta\;$$$is obtained by evaluating this over a fixed grid (N=100) of $$$\beta\;$$$from 0$$$\;$$$to$$$\;$$$0.5$$$\;$$$min. A population-averaged arterial input function5,6 was used in fitting both the EKM and the proposed model.
Results
Figure 4 shows the likelihood function for the example data where the maximum likelihood estimate is $$$\beta=T_\mathrm{c}/E=\;$$$0.13$$$\;$$$min$$$\;=\;$$$7.8$$$\;$$$sec. Since $$$E<1,\;$$$this implies that the capillary transit time is at least 7.8$$$\;$$$sec, which is consistent with published values in tumours7,8. Mean/median estimates for $$$v_\mathrm{p}\;$$$from this example are 5.03/3.34×10-3ml/ml for the standard EKM and 5.34/4.23×10-3ml/ml for the proposed model.Discussion
Estimates of $$$v_\mathrm{p}\;$$$are the most difficult to obtain with DCE-MRI because typical values in tissues imply that the signal from the plasma space is often close to the noise threshold of the data. Intra-tumour heterogeneity of $$$v_\mathrm{p}\;$$$estimates (figs 1 and 3) arises from genuine physiological heterogeneity combined with estimation errors, and the balance of these can be over-dominated by estimation errors, leading to unphysiologically low estimates. The cluster of voxels below the main cluster in the scatter plot (fig. 3) are an example of this, and some (unknown amount) of the scatter in $$$v_\mathrm{p}\;$$$of the main cluster is also due to estimation errors. By linking $$$v_\mathrm{p}\;$$$with $$$K^\mathrm{trans}\;$$$the aim is that the good estimation performance of $$$K^\mathrm{trans}\;$$$will boost that of $$$v_\mathrm{p},\;$$$but the theory shows that this is valid only if the ratio of the capillary mean transit time and the extraction fraction is (approximately) constant over the tumour. Exploratory results applying the proposed method to DCE-MRI data from an early phase clinical trial involving 27 patients has been submitted to this conference9, which indicates that treatment changes in $$$v_\mathrm{p}\;$$$are significant with the proposed model, but non-significant for the standard EKM. The proposed model addresses an important inconsistency with standard EKM modelling, and further work is needed to evaluate this approach in a range of tissues/tumours.Acknowledgements
CRUK and EPSRC support to the Cancer Imaging Centre at The Institute of Cancer Research and The Royal Marsden Hospital in association with the MRC and Department of Health (England) (C1060/A10334, C1060/A16464) and NHS funding to the NIHR Biomedical Research Centre and the Clinical Research Facility in Imaging at The Royal Marsden and the ICR.References
1. Kety SS. The theory and applications of the exchange of inert gas at the lungs and tissues, Pharmacol Rev. 1951; 3(1): 1-41.
2. Tofts PS. Modeling tracer kinetics in dynamic Gd-DTPA MR imaging, J Magn Reson Imaging 1997; 7(1): 91-101.
3. Sourbron SP, Buckley DL. Classic models for dynamic contrast-enhanced MRI. NMR Biomed. 2013; 26(8):1004-27.
4. Bernardo J and Smith A. Bayesian Theory (New York: Wiley, 2000).
5. Orton MR, d’Arcy JA, Walker-Samuel S, et al., Computationally efficient vascular input function models for quantitative kinetic modelling using DCE-MRI, Phys Med Biol 2008; 53(5): 1225-1239.
6. Parker GJ, Roberts C, Macdonald A, et al., Experimentally-derived functional forms for a population-averaged high-temporal-resolution arterial input function for dynamic contrast-enhanced MRI, Magn Reson Med 2006; 56(5): 993-1000.
7. Donaldson SB, West CM, Davidson SE, Carrington BM, Hutchison G, Jones AP, Sourbron SP, Buckley DL. A comparison of tracer kinetic models for T1-weighted dynamic contrast-enhanced MRI: application in carcinoma of the cervix. Magn Reson Med. 2010; 63(3):691-700.
8. Sahani DV, Kalva SP, Hamberg LM, Hahn PF, Willett CG, Saini S, Mueller PR, Lee TY. Assessing tumor perfusion and treatment response in rectal cancer with multisection CT: initial observations. Radiology. 2005; 234(3):785-92.
9. Rata M, Khurum K, Collins D, Tunariu N, Koh D-M, d’Arcy J, Chau I, Cunningham D, Leach MO, Orton MR. Evaluation of DCE-MRI-derived parameters when monitoring antiangiogenic effects in liver metastases: towards increased reliability of plasma volume fraction estimates. Submitted to: Proc Intl Soc Mag Reson Med, 25 (2017).
Figures