4376
Predicting MGMT expression levels in glioma patients using multi-inversion-time PASL1Neurosurgery, Beijing Tiantan Hospital, Beijing, People's Republic of China, 2MR Collaborations NE Asia, Siemens Healthcare, Beijing, People's Republic of China, 3Application Development, Siemens Healthcare, Erlangen, Germany, 4Neuroimaging center, Beijing Neurosurgical Insitute, Beijing, People's Republic of China, 5Neurosurgery, Beijing Neurosurgical Insitute, Beijing, People's Republic of China
Synopsis
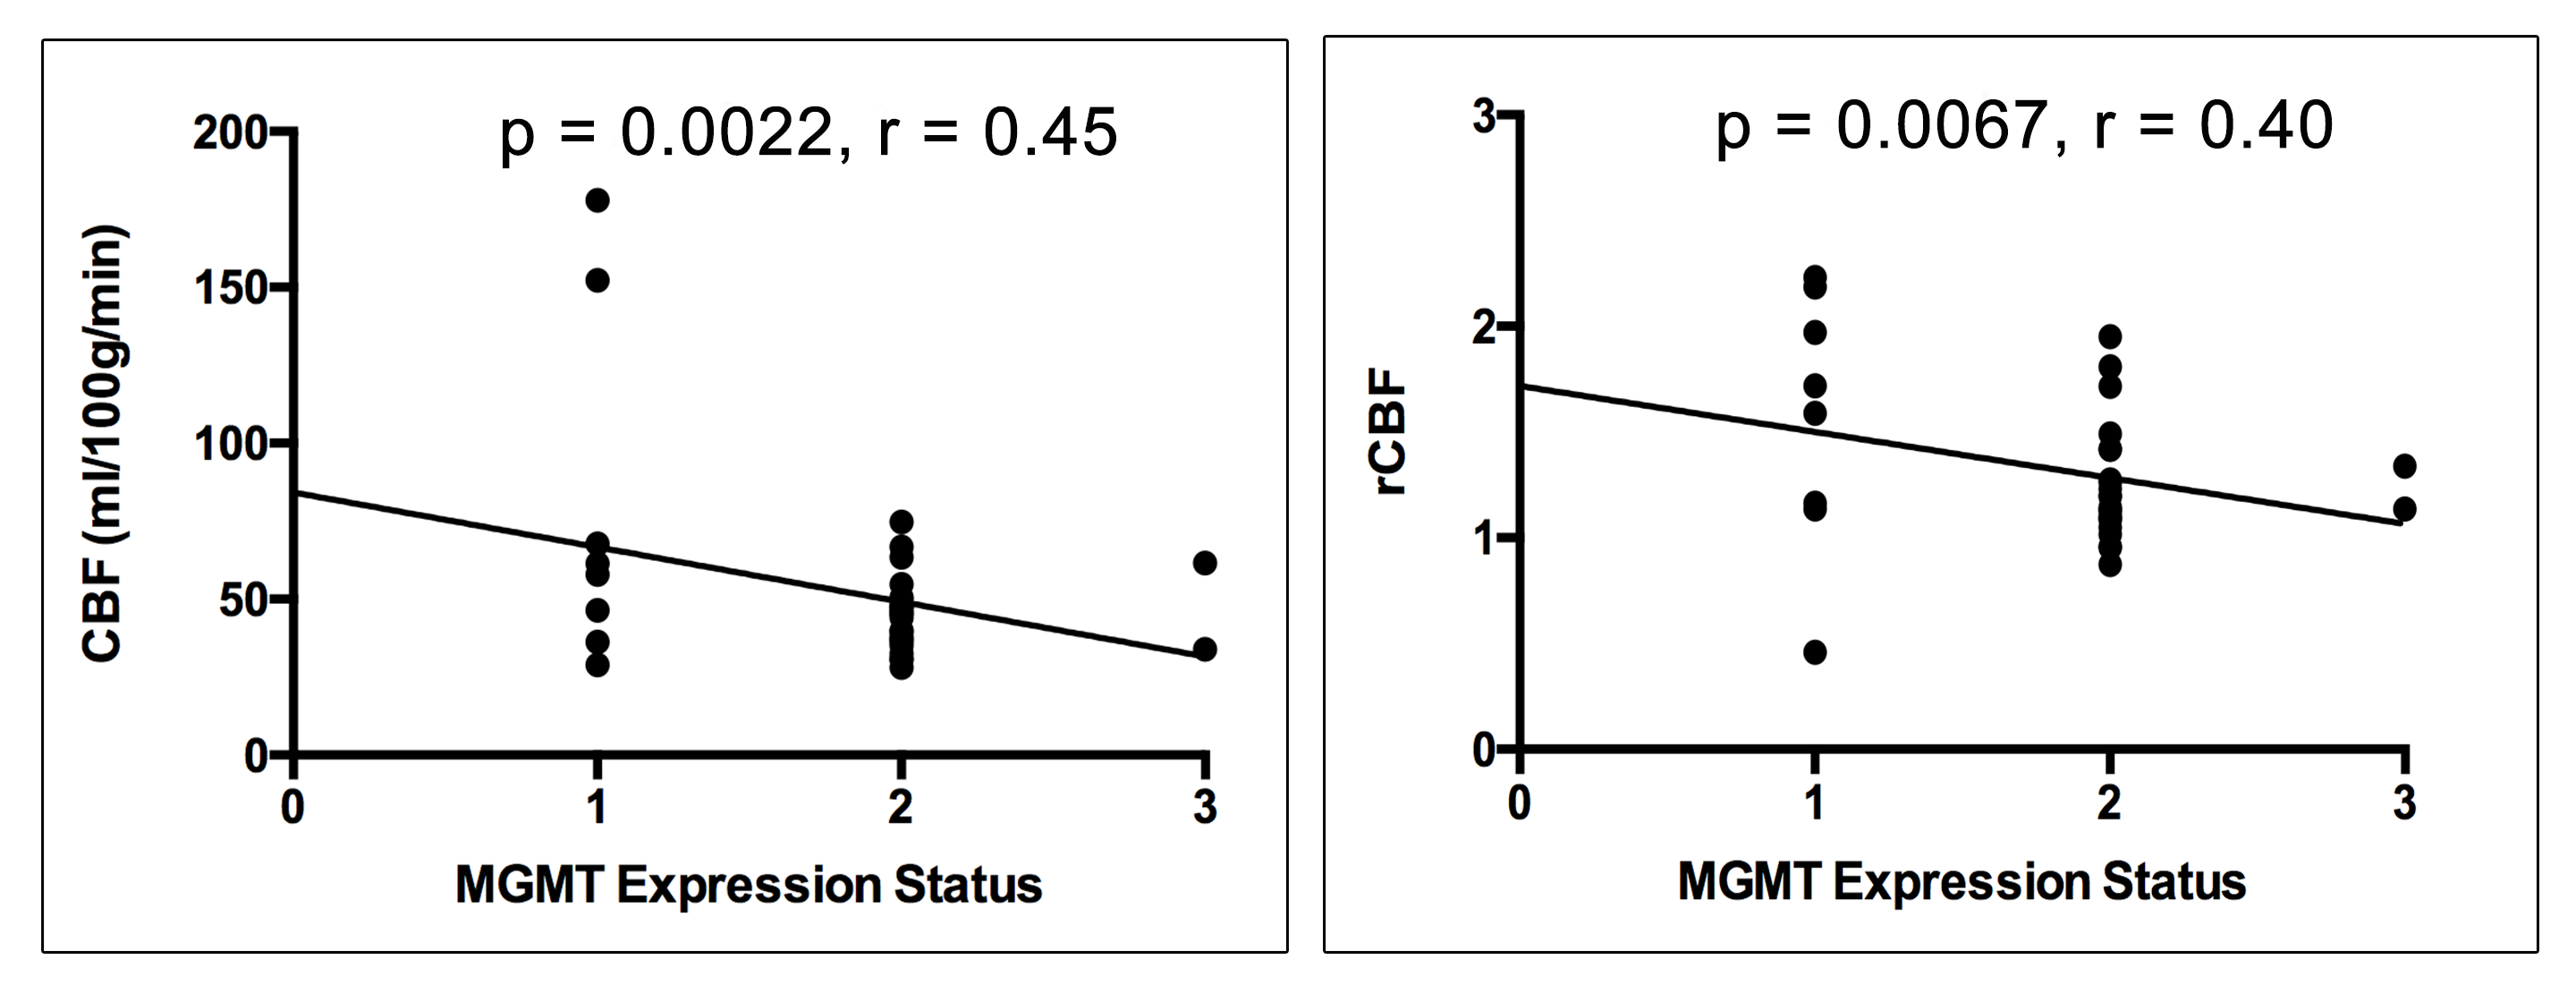
To evaluate the differences in cerebral blood flow between glioma patients with high MGMT expression and those with low MGMT expression, we retrospectively compared cerebral blood flow in pre-operative MR images acquired using multi-inversion-time PASL from glioma patients with histopathologically confirmed high MGMT expression and those with histopathologically confirmed low MGMT expression. The results demonstrate that MGMT expression status significantly correlates with both quantitative CBF and relative CBF.
-
Introduction/Purpose
Gliomas are the most common primary brain
tumor in adults[1-3]. Improvement
in glioma treatment strategies has largely been based on continuous advances in
the identification of specific tumorous genetic alterations and on the
consequent therapies tailored to these alterations. For instance, O6-methylguanine
DNA methyltransferase (MGMT) is one such gene whose promoter methylation status
closely relates to patient outcomes[1, 4-6].
Currently, the most accurate methods for the identification of MGMT promoter
methylation status are post-operative pathological analysis and immuno-histochemical
(IHC) analysis. However, these methods require invasive procedures that are not
always feasible or convenient. Furthermore, because these methods are perioperative,
they do not always yield results soon enough to impact treatment planning. In
recent studies, arterial spin labeling (ASL) with multi-inversion time (mTI)
has been shown to more accurately measure cerebral blood flow and grade gliomas
than a standard single-TI protocol[7, 8]. In
this study we aimed to determine whether a correlation exists between MGMT promoter
methylation status and parameters obtained from mTI-ASL.-
Introduction/Purpose
Method
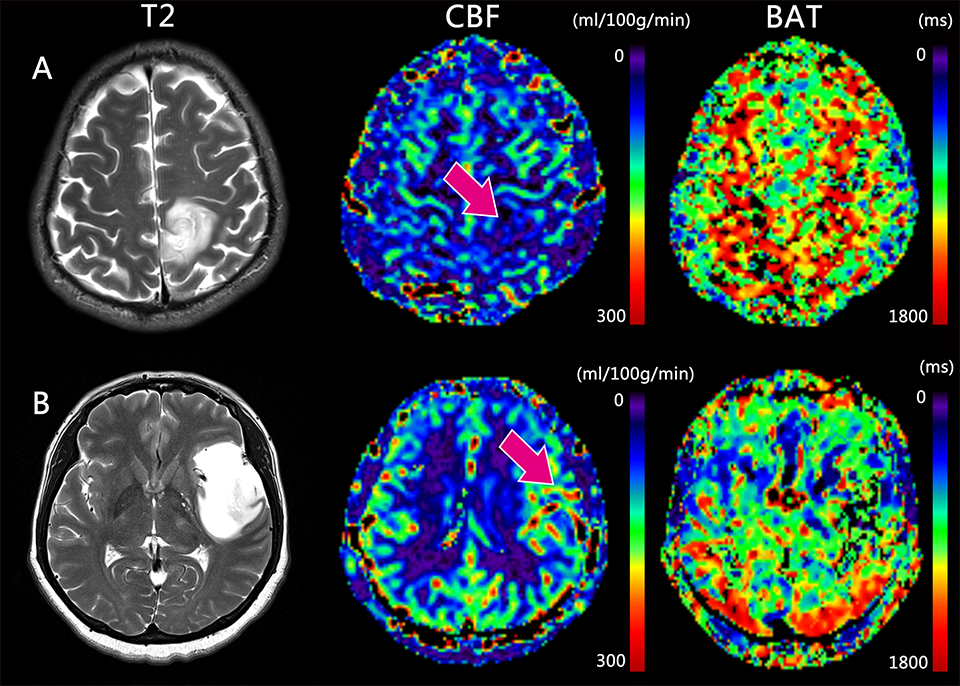
We retrospectively analyzed clinical data including demographics, MR images, and pathological information from 44 glioma patients treated at our institution between September 2015 and July 2016. All patients had undergone conventional magnetic resonance imaging and arterial spin labeling (ASL) imaging pre-operatively. Imaging data were collected on a MAGNETOM Prisma 3T MR scanner (Siemens, Erlangen, Germany). ASL images were acquired with a prototype sequence with the following parameters: TR/TE = 4600/22 ms, FOV = 220 × 220 mm2, GRAPPA (PE) 2, slice thickness = 4 mm, voxel size = 1.7 × 1.7 × 4.0 mm3, 16 slices, PASL PICORE Q2TIPS bolus length = 700 ms, 16 equidistant TIs between 470 to 3770 ms, bandwidth = 2442 Hz/Px, and total acquisition time = 5:09 min including an M0 scan. The quantitative value of cerebral blood flow (CBF) and bolus arrival time (BAT) were obtained by fitting the perfusion-weighted signal of 16TIs to a Buxton model. The relative values, marked as rCBF and rBAT, respectively, were obtained by dividing the absolute value of the tumor area by that of the contralateral normal-appearing gray-matter (GM) area for each patient. The pathological and immuno-histochemical data were collected from our institution’s neuro-pathology department. MGMT expression levels were identified as -, ±, + and ++ and ultimately corresponded to numbers 0, 1, 2, and 3 in the correlative analysis. Patients were divided into 2 groups according to their MGMT expression level for the t-test analysis: low expression (-, ±) and high expression (+, ++). The software Prism (version 6.0c, GraphPad Software, La Jolla, California, USA) was used to calculate statistical differences between the two groups. A two-sample t-test and ROC analysis were applied to test the differences and performances of CBF and rCBF in differentiating MGMT expression.Result
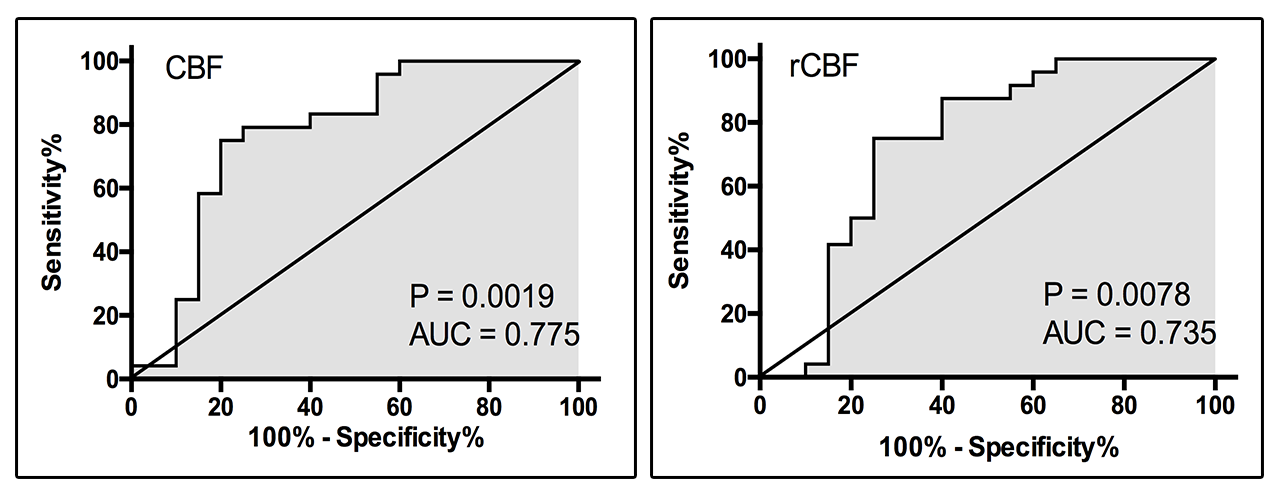
Patients were on average 43 years old with a minimum age of 24 years and a maximum age of 66 years. WHO grades ranged from II to IV. The results of the correlational analysis show that MGMT expression significantly negatively correlates with CBF (r=0.45, p = 0.002) and rCBF (r=0.40, p = 0.007) but does not significantly correlate with BAT (p = 0.74) and rBAT (p = 0.26) [Fig. 1]. Patients with high MGMT expression levels had significantly lower CBF (p < 0.001) and rCBF values (p = 0.007) than patients with low MGMT expression levels. The ROC analysis of CBF demonstrated an AUC = 0.775, sensitivity=75.0%, and specificity=80.0% as the best cut-off point in differentiating between the two MGMT expression level groups. The ROC analysis of rCBF demonstrated an AUC = 0.735, sensitivity=75.0%, and specificity=75.0% as the best cut-off point in differentiating between the two MGMT expression level groups [Fig. 2].Discussion
In this study, we found a positive correlation between MGMT expression status and perfusion parameters derived from ASL. CBF and rCBF values were significantly higher in the high MGMT expression group than in the low MGMT expression group [Fig. 3]. MGMT is a repair protein that specifically removes promutagenic alkyl groups from the O-6 position of guanine in DNA and thus protects tumor cells against alkylating agents[4, 9-11]. Patients with MGMT promoter methylation can be successfully treated with temozolomide and have a better prognosis[12-15]. Being able to determine MGMT expression status via MRI allows neurosurgeons and oncologists to plan their treatment protocols pre-operatively and non-invasively rather than having to rely on perioperative pathological analyses.Conclusion
The results of this study suggest that mTI-PASL-based MR perfusion imaging could be a potentially useful alternative to invasive pathological analyses for the prediction of MGMT expression status and thus can serve as a guide when selecting appropriate treatments especially for patients who cannot undergo invasive procedures.Acknowledgements
References
1. Jiang, T., et al., CGCG clinical practice guidelines for the management of adult diffuse gliomas. Cancer Lett, 2016. 375(2): p. 263-73.
2. Ostrom, Q.T., et al., CBTRUS statistical report: primary brain and central nervous system tumors diagnosed in the United States in 2007-2011. Neuro Oncol, 2014. 16 Suppl 4: p. iv1-63.
3. Wen, P.Y. and S. Kesari, Malignant gliomas in adults. N Engl J Med, 2008. 359(5): p. 492-507.
4. Riemenschneider, M.J., M.E. Hegi, and G. Reifenberger, MGMT promoter methylation in malignant gliomas. Target Oncol, 2010. 5(3): p. 161-5.
5. Kang, S.H., et al., O6-methylguanine DNA methyltransferase status determined by promoter methylation and immunohistochemistry in gliosarcoma and their clinical implications. J Neurooncol, 2011. 101(3): p. 477-86.
6. Idbaih, A., et al., Input of molecular analysis in medical management of primary brain tumor patients. Rev Neurol (Paris), 2015. 171(6-7): p. 457-65.
7. Yang, S., et al., Improving the Grading Accuracy of Astrocytic Neoplasms Noninvasively by Combining Timing Information with Cerebral Blood Flow: A Multi-TI Arterial Spin-Labeling MR Imaging Study. AJNR Am J Neuroradiol, 2016.
8. Warnert, E.A., et al., In vivo assessment of human brainstem cerebrovascular function: a multi-inversion time pulsed arterial spin labelling study. J Cereb Blood Flow Metab, 2014. 34(6): p. 956-63.
9. Siegal, T., Clinical Relevance of Prognostic and Predictive Molecular Markers in Gliomas. Adv Tech Stand Neurosurg, 2016(43): p. 91-108.
10. Kim, C., et al., Recurrent Glioblastoma: Combination of High Cerebral Blood Flow with MGMT Promoter Methylation Is Associated with Benefit from Low-Dose Temozolomide Rechallenge at First Recurrence. Radiology, 2016: p. 152152.
11. Zhang, W., et al., miR-181d: a predictive glioblastoma biomarker that downregulates MGMT expression. Neuro Oncol, 2012. 14(6): p. 712-9.
12. Hegi, M.E., et al., MGMT gene silencing and benefit from temozolomide in glioblastoma. N Engl J Med, 2005. 352(10): p. 997-1003.
13. Chamberlain, M.C., Prognostic or predictive value of MGMT promoter methylation in gliomas depends on IDH1 mutation. Neurology, 2014. 82(23): p. 2147-8.
14. Kreth, S., et al., In human glioblastomas transcript elongation by alternative polyadenylation and miRNA targeting is a potent mechanism of MGMT silencing. Acta Neuropathol, 2013. 125(5): p. 671-81.
15. Yang, P., et al., IDH mutation and MGMT promoter methylation in glioblastoma: results of a prospective registry. Oncotarget, 2015. 6(38): p. 40896-906.
Figures