4375
The Effects of AIF Quantification Variations on DCE-MRI Prediction of Soft Tissue Sarcoma Response to Preoperative Therapy: A Preliminary Multicenter Study1International School of Beaverton, Beaverton, OR, United States, 2Oregon Health & Science University, Portland, OR, United States, 3GE Global Research, 4Brigham and Women's Hospital, 5Icahn School of Medicine at Mt Sinai, 6University of Michigan, 7Medical College of Wisconsin, 8University of Pittsburgh, 9University College, 10Vanderbilt University, 11Massachusetts General Hospital, 12University of Washington, 13The University of Texas at Austin
Synopsis
Soft tissue sarcoma DCE-MRI data collected at baseline and after one chemotherapy cycle were shared among nine centers and individual arterial input functions (AIFs) were quantified with center-specific methods. Pharmacokinetic (PK) modeling of the data was performed with these AIFs and the Tofts model. Considerable variations in estimated PK parameters and the corresponding percent changes were observed due to AIF variations. kep is less susceptible to AIF variation than Ktrans and may be a more robust imaging biomarker of microvasculature. kep percent change correlates in a uniformly negative relationship with necrosis percentage of resection specimen across all individually measured AIFs.
Introduction
Inaccuracy in determination of arterial input function (AIF) is a major factor affecting the accuracy of parameters derived from pharmacokinetic (PK) modeling of dynamic contrast-enhanced (DCE) MRI data1. A recent multicenter study2 has shown that variations in AIF quantification from prostate DCE-MRI data using various methods can cause significant variations in PK parameters estimated with the standard Tofts model. However, only single-time point DCE-MRI data sets were used in that study. For longitudinal DCE-MRI assessment of cancer therapy response, it is important to evaluate the effects of AIF measurement variations on estimation of PK parameter changes, as well as the utility of DCE-MRI imaging biomarkers for evaluation of therapy response. In this collaborative multicenter study, we sought to investigate the effects of AIF variations on DCE-MRI prediction of soft tissue sarcoma response to preoperative therapy.Methods
3D DCE-MRI data were collected from soft tissue sarcoma patients at baseline (visit 1, V1), after one cycle of chemotherapy (after two weeks, V2), and after another eight weeks of chemoradiotherapy but before surgery (V3)3. Fourteen sagittal DCE-MRI data sets acquired at V1 and V2, with 7-11 s temporal resolution and ~ 10 min acquisition time, from seven patients with tumors located in the thigh were shared among nine centers within the Quantitative Imaging Network (QIN). Each center determined individual AIFs from the femoral artery (Fig. 1) using the DCE-MRI data with its site-specific method (automated, semi-automated, manual, etc.)2 and submitted them to the managing center, which then performed PK modeling of the tumor voxel DCE-MRI time-course data using the standard Tofts model. To ensure variations in derived parameters were from AIF variations only, all other inputs, including tumor ROI definition and pre-contrast T1, were kept the same in model fitting. Mean tumor values of the PK parameters, Ktrans, ve, and kep (= Ktrans/ve), were calculated by averaging voxel values within the tumor ROI. The percent change of the mean tumor parameter at V2 relative to V1, V21%, was also calculated. To assess agreements and variations of the PK parameters and the corresponding V21% percent changes, intra-class correlation coefficient (ICC) was computed. Additionally, Spearman’s correlations of the PK parameters and percent changes with the clinical response endpoint, necrosis percentage (NP) of the resected tumor specimens4, were performed.Results
Fig. 2 shows a column graph of the ICC values for V1, V2, and V21% PK parameters. For PK parameters at V1 and V2, Ktrans has lower ICC values (higher AIF-caused variations) than those of ve and kep. For V21% metrics, however, Ktran and kep have similar ICC values, which are both low compared to that of ve.
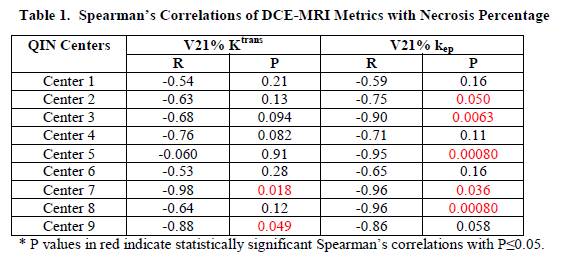
Table 1 summarizes the correlation coefficient R and P values for Spearman’s correlation between NP and V21% Ktrans and kep, respectively. Both V21% Ktrans and kep show negative correlations with NP – larger decreases in Ktrans and kep corresponding to higher NP (better clinical response to therapy) – for results obtained with all the AIFs measured by individual centers. Compared to V21% Ktrans, V21% kep generally shows stronger correlation with NP with greater absolute R values and smaller P values, and has more statistically significant correlations (n = 5 vs. 2).Discussions
The preliminary findings from this multicenter study of soft tissue sarcoma DCE-MRI data analysis confirm the results of a previous multicenter study of prostate DCE-MRI data analysis2, suggesting that, compared to Ktrans, the kep parameter is less susceptible to AIF variations and could be a more robust imaging biomarker of microvasculature. Since the AIF-caused inter-center PK parameter variations are largely systematic for a single time-point study2, the fact that comparable variations in V21% metrics were observed (Fig. 2) in this study suggests that random errors in AIF quantification, such as ROI or voxel placement in the artery, partial volume averaging, and inflow effects, were probably embedded in estimated PK parameters in a longitudinal study. Nonetheless, the uniform sign of correlations between V21% metrics, especially V21% kep, and surgical specimen NP across all center-specific AIF measurements demonstrates the robustness of DCE-MRI for prediction of soft tissue sarcoma therapy response despite uncertainties in AIF determination. Comparison of individually measured AIFs with a population-averaged AIF5 within the context of DCE-MRI evaluation of therapy response will be the next goal of investigation. Further, the results from this study need to be validated with a larger cohort and with data from different tumor types.Acknowledgements
Grant Support: NIH U01-CA154602, U01-CA151261, U01-CA183848, U01-CA154601, U01-CA148131, U01-CA176110, U01-CA172320, U01-CA142565, U01-CA166104, U01-CA140230.References
Khalifa F, et al. Med Phys 2014;41:124301.
Huang W, et al. Tomography 2016;2:56-66.
Meyer JM, et al. Clin Cancer Res 2013;19:6902-6911.
Eilber FC, et al. J Clin Oncol 2001; 19:3203-3209.
Rata M, et al. Eur Radiol 2016;26:1991-1998.
Figures