4374
Appearance of Changes From Focal Therapy on Multiparametric Prostate Magnetic Resonance Imaging1Department of Radiology, Weill Cornell Medical College, New York, NY, United States, 2Radiology, UCLA Geffen School of Medicine, Los Angeles, CA, United States, 3Urology, UCLA Geffen School of Medicine, Los Angeles, CA, United States, 4School of Medicine, UCLA Geffen School of Medicine, Los Angeles, CA, United States
Synopsis
Understanding the changes corresponding to focal therapy of prostate cancer on MRI is paramount to appropriate management, as serum tests may fail to accurately monitor these patients.
Introduction
Multiparametric prostate magnetic resonance imaging (mpMRI) has emerged as the standard method for imaging cancer in the prostate.1 Standard methods of assessment show acceptable reader agreement.2 However, these methods were developed for optimal performance in the pre-treatment detection setting. Focal therapy, where only the abnormal part of an organ is treated, is emerging as an intriguing possibility for the treatment of organ-confined prostate cancer. As one might imagine, accurate imaging of the tumor before and after treatment will be paramount to both plan treatment as well as determine treatment efficacy, since the standard method of assessing treatment completeness, monitoring of serum prostate specific antigen levels, would be confounded by residual healthy prostate tissue which constitutively produces this kallikrein, albeit at lower levels than prostate cancers. Recognition of the range of normal appearance of tissue after treatment, and how this differs from residual disease in treatment failure, will be paramount in the successful monitoring of these patients. Although consensus has been reached as to how to image after treatment, standardized interpretation has not achieved the same degree of widespread acceptance is in the pre-treatment setting.3Methods
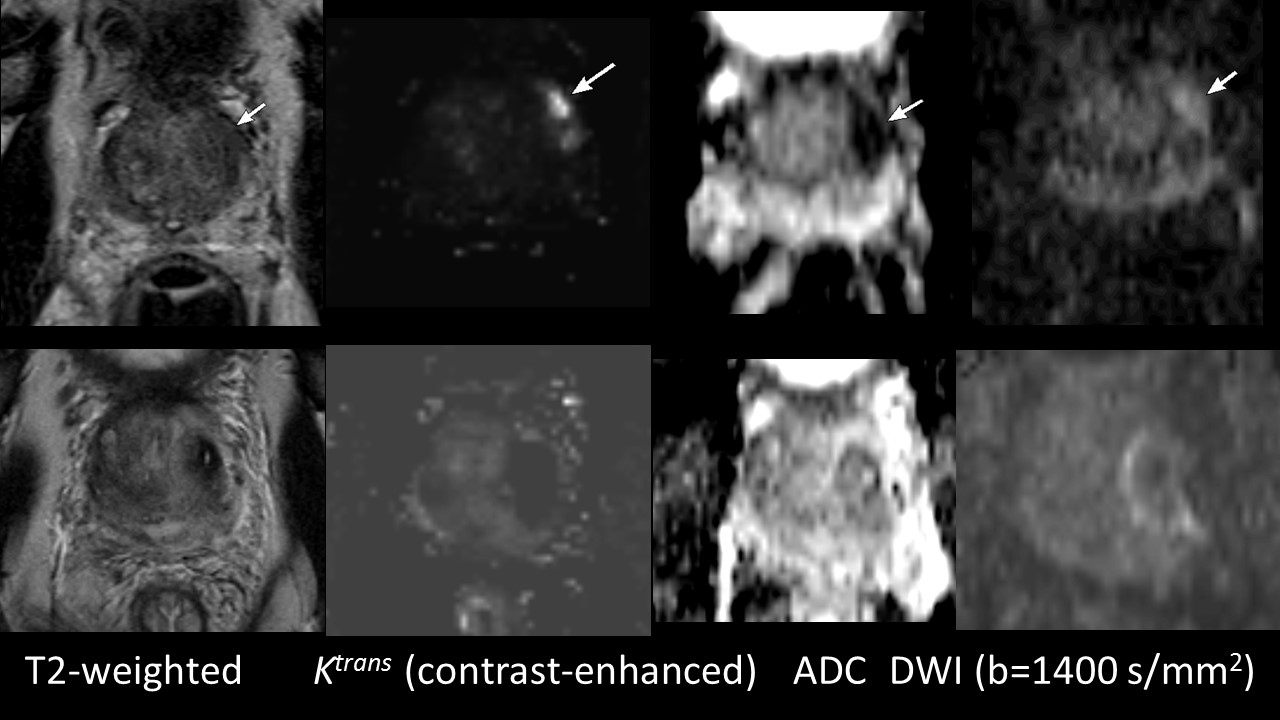
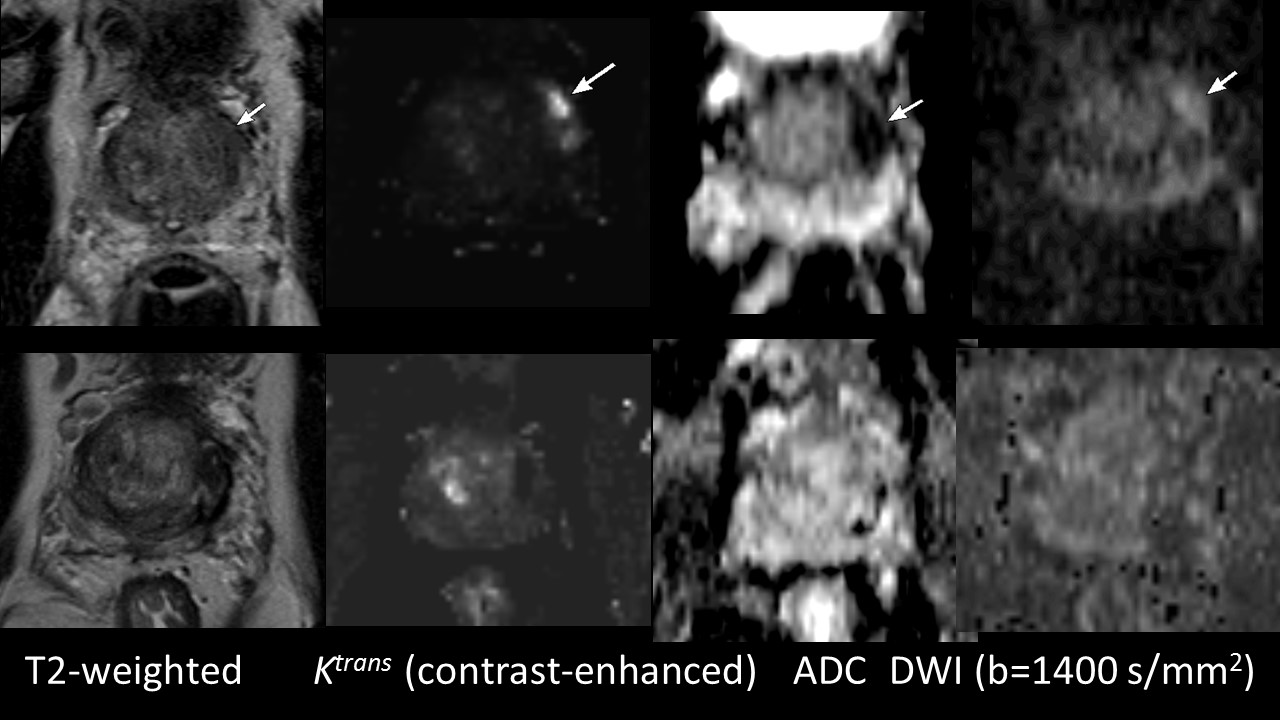
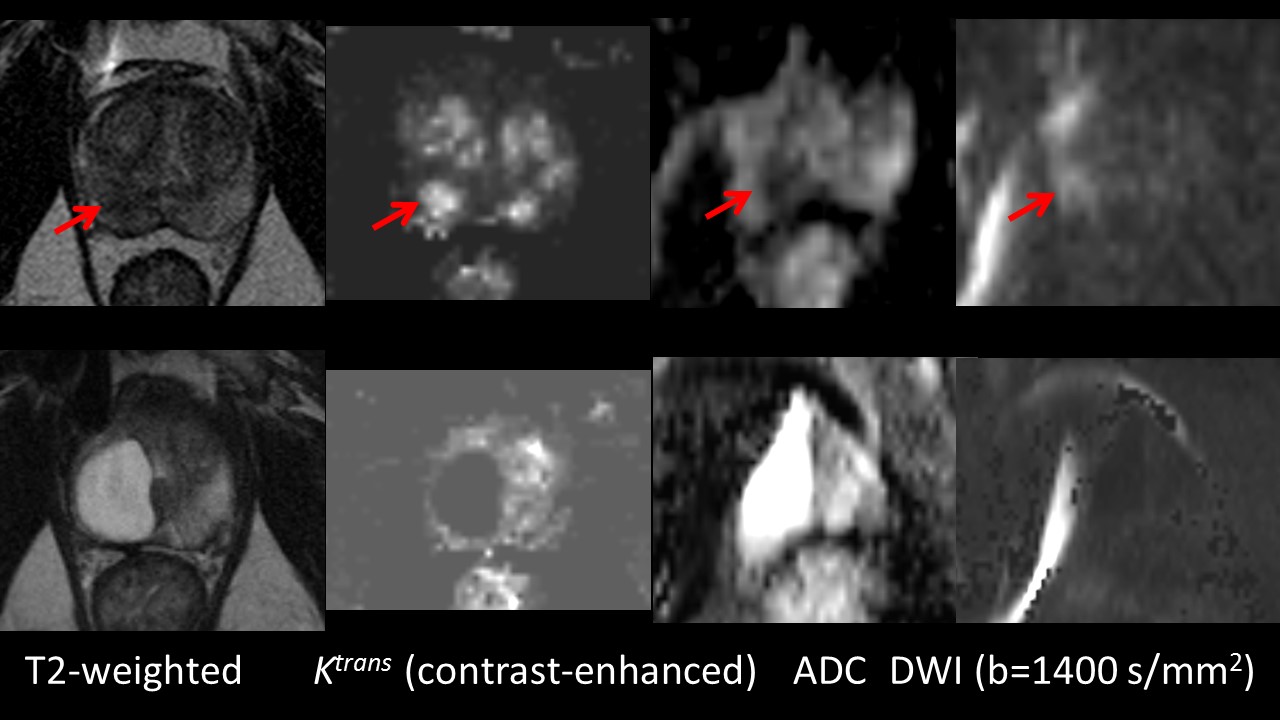
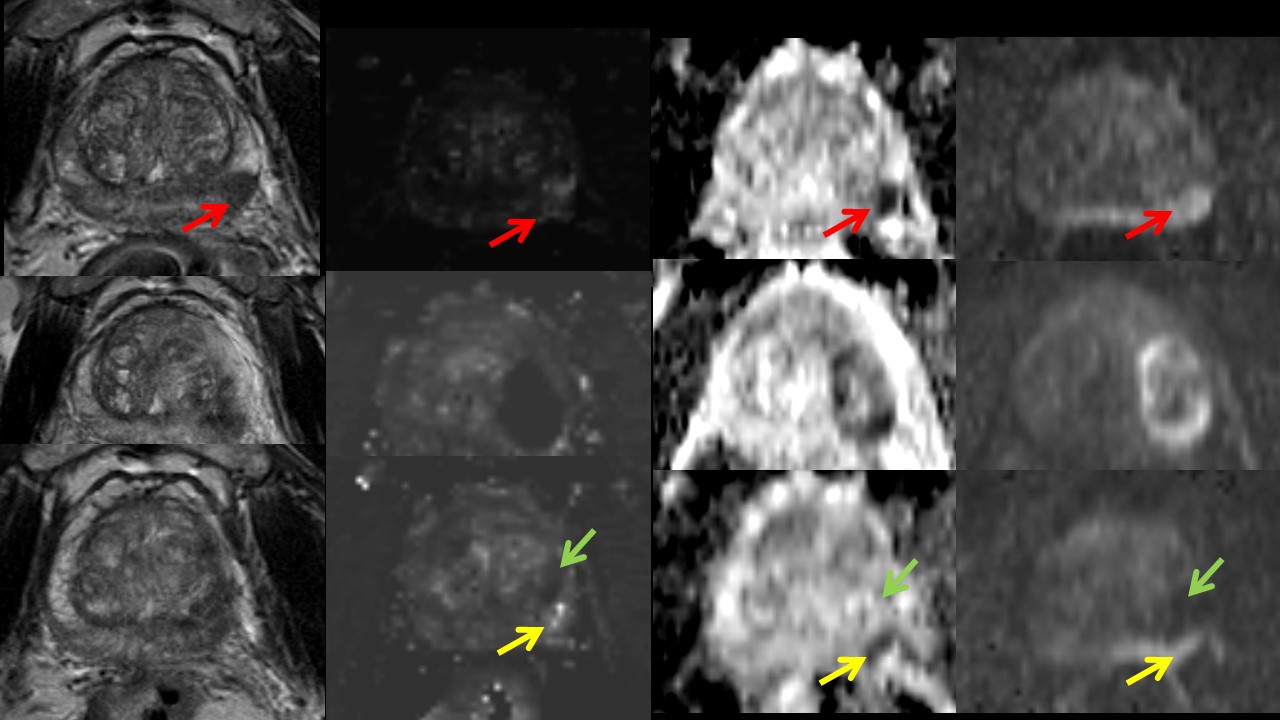
As part of a phase I clinical trial, 10 men were recruited to undergo focal laser ablation (FLA) of prostate tumors identified on transrectal ultrasound-magnetic resonance imaging (TRUS-MRI) image fusion targeted biopsy.4 The same mpMRI was performed immediately after treatment, and at 6 and 12 months, consisting of Axial 3D TSE T2 (Siemens SPACE, TR/TE 3800-5040/101 ETL 13, 14 cm FOV, 256 x 256 matrix, 1.5 mm contiguous slices), Axial and Coronal TSE T2 (TR 3800-5040 TE 101 ms, ETL 13-25, 3.6 mm, no gap, matrix 320 x 320, 20 x 20 cm FOV), Diffusion-weighted imaging (echoplanar, TR/TE 3900/60, 21 x 26 cm FOV, 130 x 160 matrix, 3.6 mm slices, 4 NEX, b-values 0, 100, 400, 800 s/mm2) with apparent diffusion coefficient (ADC) map, and Dynamic view-sharing gradient T1 (Siemens TWIST, TR./TE 3.9/1.4 ms, 12o flip angle, 26 x 26 cm FOV, 160 x 160 matrix, 3.6 mm slices, 4.75 s/acquisition over 6 minutes with 15 s injection delay, image analysis using iCAD Versavue), for MRI-ultrasound fusion targeted biopsy (Artemis, Eigen Inc.). All men underwent repeat biopsy of the treatment zone and any residual suspicious areas at 6 months. Images were reviewed by the radiologist in conjunction with the treating urologist. Representative images were chosen for both cases of complete eradication of tumor and residual disease.Findings
Immediately after treatment, all treatment zones show shorter T1 and T2 and absent perfusion. Generally, the ADC was higher after treatment. In most cases, the perfusion defect shrank or disappeared by the 6-month visit. Additionally, the treatment zone itself shrank to a smaller area of shorter T2, but with normalization of inherent T1. Changes on ADC were variable but largely higher after treatment. “Cystic” change, with simple fluid signal in the treatment zone, was present in 3/10 (30%) of cases. In those cases with residual tumor, this was most often conspicuous by a focal area of early enhancement and restricted (impaired) diffusion, with lower ADC and higher signal on the calculated high b-value diffusion-weighted image.Discussion
The appearance of prostate cancer prior to treatment is codified and well established. Its appearance after focal therapy, however, can be variable. Further, understanding the appearance of residual or recurrent disease is important as standard serum markers may not accurately reflect treatment success.5Acknowledgements
We would like to acknowledge the NIH for funding the phase 1 trialReferences
1: Weinreb JC, Barentsz JO, Choyke PL, Cornud F, Haider MA, Macura KJ, Margolis D, Schnall MD, Shtern F, Tempany CM, Thoeny HC, Verma S. PI-RADS Prostate Imaging - Reporting and Data System: 2015, Version 2. Eur Urol. 2016 Jan;69(1):16-40.
2: Rosenkrantz AB, Ginocchio LA, Cornfeld D, Froemming AT, Gupta RT, Turkbey B, Westphalen AC, Babb JS, Margolis DJ. Interobserver Reproducibility of the PI-RADS Version 2 Lexicon: A Multicenter Study of Six Experienced Prostate Radiologists. Radiology. 2016 Sep;280(3):793-804.
3: Muller BG, van den Bos W, Brausi M, Fütterer JJ, Ghai S, Pinto PA, Popeneciu IV, de Reijke TM, Robertson C, de la Rosette JJ, Scionti S, Turkbey B, Wijkstra H, Ukimura O, Polascik TJ. Follow-up modalities in focal therapy for prostate cancer: results from a Delphi consensus project. World J Urol. 2015 Oct;33(10):1503-9.
4: Natarajan S, Raman S, Priester AM, Garritano J, Margolis DJ, Lieu P, Macairan ML, Huang J, Grundfest W, Marks LS. Focal Laser Ablation of Prostate Cancer: Phase I Clinical Trial. J Urol. 2016 Jul;196(1):68-75.
5: Dickinson L, Ahmed HU, Hindley RG, McCartan N, Freeman A, Allen C, Emberton M, Kirkham AP. Prostate-specific antigen vs. magnetic resonance imaging parameters for assessing oncological outcomes after high intensity-focused ultrasound focal therapy for localized prostate cancer. Urol Oncol. 2016 Sep 20. pii: S1078-1439(16)30201-0.
Figures