4370
DCE-MRI Assessment of Breast Cancer Response to Neoadjuvant Chemotherapy: Early Prediction of Response and Evaluation of Residual Disease1Oregon Health & Science University, Portland, OR, United States
Synopsis
DCE-MRI was performed on 47 breast cancer patients (49 primary tumors) before, during, and after neoadjuvant chemotherapy (NACT). DCE-MRI data were subjected to Tofts model (TM) and Shutter-Speed model (SSM) pharmacokinetic (PK) analysis. Imaging metrics and the corresponding percent changes were correlated with binary pathologic complete response (pCR) and non-pCR endpoints, as well as residual cancer burden (RCB) index values. By NACT midpoint, several DCE-MRI PK parameters and percent changes are good early predictors of pCR vs. non-pCR, while tumor size is a poor predictor. Both PK parameters and tumor size after NACT completion are good markers of RCB. TM and SSM parameters perform equally well for prediction of NACT response and evaluation of RCB.
Introduction
Quantitative DCE-MRI has been shown effective for early prediction of breast cancer response to neoadjuvant chemotherapy (NACT)1,2. However, few have investigated the utility of DCE-MRI for evaluation of post-NACT residual disease, which can have important implications for surgical decision making of mastectomy vs. lumpectomy. In this study we compared quantitative imaging biomarkers estimated from pharmacokinetic (PK) analysis of DCE-MRI data with imaging tumor size measurement for early prediction of breast cancer NACT response and evaluation of residual disease, and the standard Tofts model (TM) with the Shutter-Speed model (SSM) PK analysis within the context of response assessment.Methods
47 patients with 49 primary breast tumors (two patients with 2 tumors each) who were treated with 6-8 cycles of NACT consented to research DCE-MRI performed at Visit 1 (V1) - before NACT, V2 - after first NACT cycle, V3 – midpoint (after 3-4 NACT cycles), and V4 - after NACT completion. Axial bilateral breast DCE-MRI was performed with 14-20 s temporal resolution and ~ 10 min acquisition time2. Tumor ROI was drawn on post-contrast images and tumor size in the longest diameter (LD) was measured according to the RECIST guidelines3. The ROI-averaged and pixel DCE time-course data were subjected to both the TM and SSM PK analyses to extract Ktrans, ve, kep (= Ktrans/ve), and τi (mean intracellular water lifetime, SSM only) parameters. The SSM accounts for, while the TM ignores, cross cell membrane water exchange kinetics2,4. The whole tumor mean parameter value was calculated as the weighted (by ROI pixel number) average of the single-slice ROI parameter values from all slices covering the entire contrast-enhanced tumor.
Pathologic response to NACT and residual cancer burden (RCB) were determined from post-NACT resection specimens5, with RCB including residual disease from the in-breast primary tumor and the positive lymph nodes5. The pathology endpoints were correlated with the MRI metrics using the univariate logistic regression (ULR) analysis and the Spearman’s correlation (SC).Results
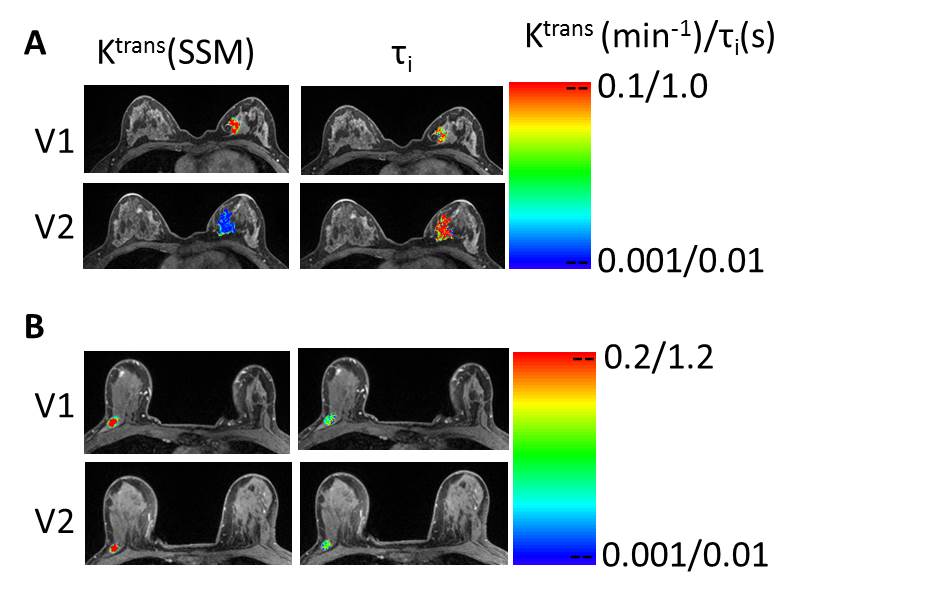
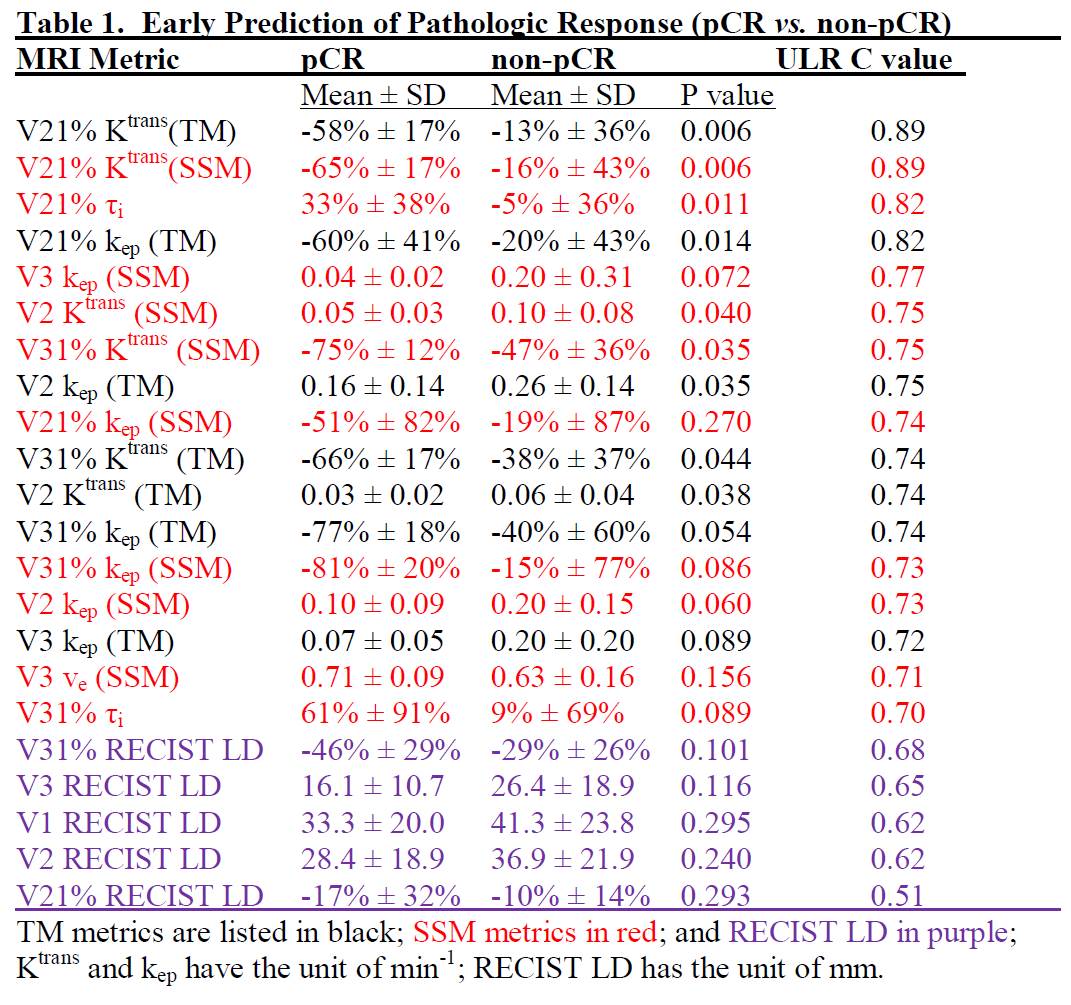
12 patients achieved pathologic complete response (pCR) (RCB = 0) while the other 35 (37 tumors) were non-pCRs. Table 1 shows the mean ± SD values of the PK parameters and the percent changes (e.g., V21%: percent change of V2 relative to V1) for the two groups and P values for comparison, as well as the ULR C statistics values (equivalent to AUC of ROC analysis) for early prediction of pCR vs. non-pCR. Only the metrics at V3 or earlier and with C ≥ 0.7 (indicating fair or better early predictor of response) are listed. RECIST LD and its percent changes are listed for comparison. V21% values of several PK parameters were good (C > 0.8) early predictors of response, with parameters of both PK models performing equally well. However, even at NACT midpoint (V3), RECIST LD and its percent changes remained poor (C < 0.7) predictors of response. Fig. 1 shows representative Ktrans(SSM) and τi color maps of a pCR (1A) and a non-pCR (1B) at V1 and V2. Compared to the non-pCR, the pCR tumor had considerable decrease in Ktrans and increase in τi after only one NACT cycle.
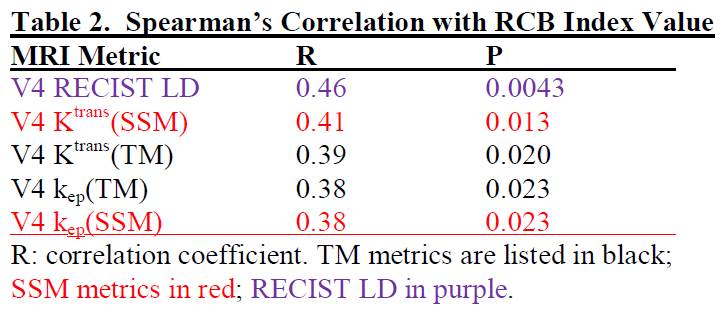
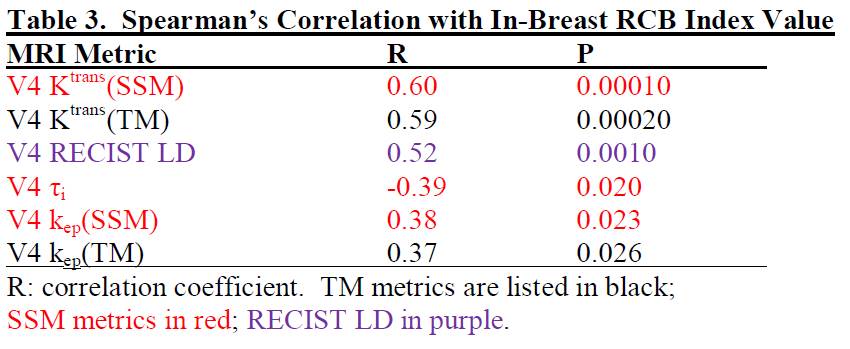
Table 2 lists coefficient R and P values for significant (P < 0.05) SC between V4 imaging metrics and RCB index value, while Table 3 is the Table 2 equivalent for in-breast RCB. After NACT completion, Ktrans and kep of both models and RECIST LD were positively correlated with RCB, while τi was negatively associated with in-breast RCB. The correlation was generally strengthened when in-breast RCB was used, as the imaging metrics were from the primary tumor only.Discussions
Results from this 49-tumor cohort indicate that functional changes as measured by DCE-MRI are superior to changes in tumor size for early prediction of NACT response. However, like PK parameters, tumor size is a valuable marker of RCB after NACT completion, suggesting tumor size measurement might be adequate for residual disease assessment and surgical decision making. PK parameters estimated with either model performed comparably well in early prediction of response and evaluation of RCB, suggesting that the systematic differences between the TM and SSM PK parameter values do not affect predictive capabilities. However, SSM analysis allows quantification of τi, a potential imaging biomarker of metabolic activity4,6. The utility of τi is clearly demonstrated in early prediction of response (Table 1) and assessment of RCB (Table 3). The potential of τi as a robust early predictor of breast cancer therapy response is further supported by our observation that it is the only pre-NACT imaging metric that correlates with RCB with near statistical significance (P = 0.053).Acknowledgements
Grant support: NIH U01 CA154602.References
Li et al., Transl Oncol 2014;7:14-22.
Tudorica et al., Transl Oncol 2016;9:8-17.
Therasse et al., J Natl Cancer Inst 2000;92:205-216.
Springer et al., NMR Biomed 2014;27:760-773.
Symmans et al., J Clin Oncol 2007;25:4414-4422.
Zhang et al., Biophys J 2011;101:2833-2842.
Figures