4369
The use of DCE MRI in predicting early chemo-radiotherapy treatment response for Larynx and hypopharynx carcinoma1Radiology, Peking Union Medical College, Cancer Institute & Hospital, Chinese Academy of Medical Sciences, BeiJing, People's Republic of China, 2Radiology, The Second Affiliated Hospital, Zhejiang University School of Medicine, HangZhou, People's Republic of China, 3GE MR Research China
Synopsis
In this work, we evaluated the utility of pretreatment semi-quantitative dynamic contrast-enhanced magnetic resonance imaging (MRI) in predicting early response to CRT (chemo-radiotherapy) in patients with larynx and hypopharynx carcinoma from primary tumors. To our knowledge, few studies correlate DCE-MRI semi-quantitative parameters on larynx and hypopharynx carcinoma. These quantitative methods do not require high computational power and were very suitable for clinical application.
Purpose
Larynx and hypopharynx carcinoma are common malignant neoplasms and feature poor overall survival rates [1]. Chemo-radiotherapy is a standard treatment for larynx and hypopharynx carcinoma [2]. However, treatment response varies by individuals, and resistance to chemo-radiotherapy is widely recognized as the main cause of relapse. It is hence desirable to have a biomarker that may predict treatment outcome and hence stratify patients for different treatment strategies. Dynamic contrast enhanced (DCE) MRI reveals the progress of angiogenesis and reveals vascularization at the tissue level and hence holds promise for predicting and monitoring treatment response. Its use in head and neck squamous cell carcinoma (HNSCC) has been previously reported and shown to be a viable biomarker [3]. In this work we investigate on the use of semi-quantitative parameters derived from DCE-MRI in predicting response to chemo-radiotherapy for larynx and hypopharynx carcinoma, which has not been previously reported.Method
A total of 62 patients were enrolled in this retrospective study and consent forms were obtained. 54 patients underwent chemotherapy and 8 patients underwent radiation therapy. All patients underwent two DCE-MRI scans (MR750, GE, USA), first exam was performed prior to treatment at the baseline and second exam was performed within 3 weeks after the completion of CRT. At the end of the treatment, patients were evaluated and classified as responders or non-responders according to the Response Evaluation Criteria in Solid Tumors (RECIST) criteria [3]. The DCE-MRI acquisition parameters were: TR/TE=2.8/1.3ms, FOV=26 cm, slice thickness/gap = 4.2/0 mm, FA =15°, 7s per phase, 40 phases. Time intensity curves (TIC), time to peak (TTP), maximum slope of increase (MSI), maximum slope of decrease (MSD) and positive enhancement integral (PEI) were derived. ROIs (30~50 mm2) were manually placed on identified tumors, avoiding visually large cystic or necrotic areas. Normality test for DCE-MRI parameters were done using the Kolmogorov-Smirnov test. The Student t test and Mann-Whitney U tests were used to compare the pre- and post-treatment DCE parameters (TTP, MSI, MSD and PEI), and parametric differences were tested using the statistical method of analysis of variance (ANOVA). ROC analyses were also used to ascertain the best discriminatory model in differentiating responders from non-responders. Diagnostic accuracy was determined using the values of area under curve (AUC), and the predicting cutoff value, sensitivity, and specificity were calculated as well.Results
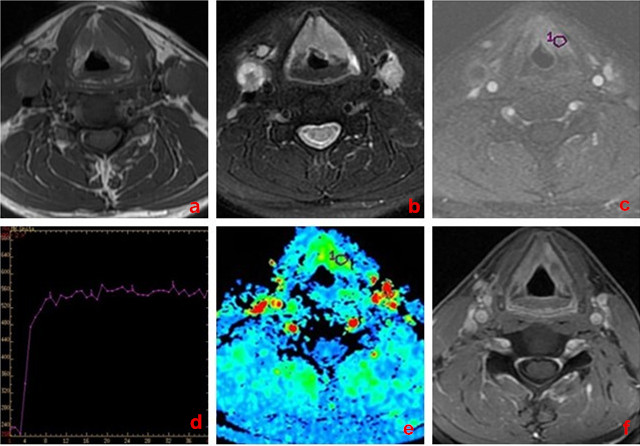
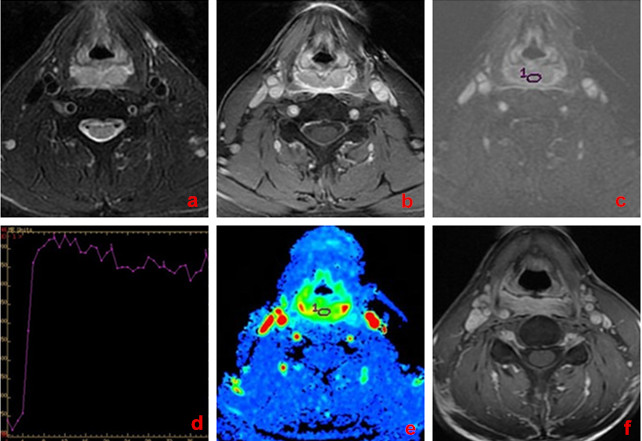
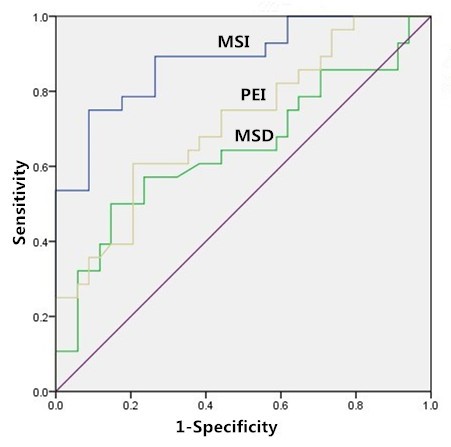
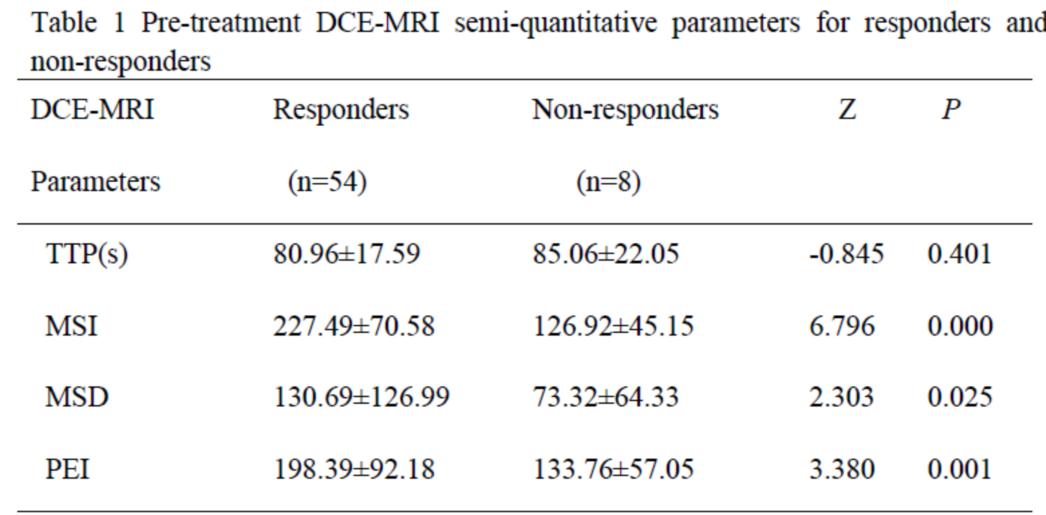
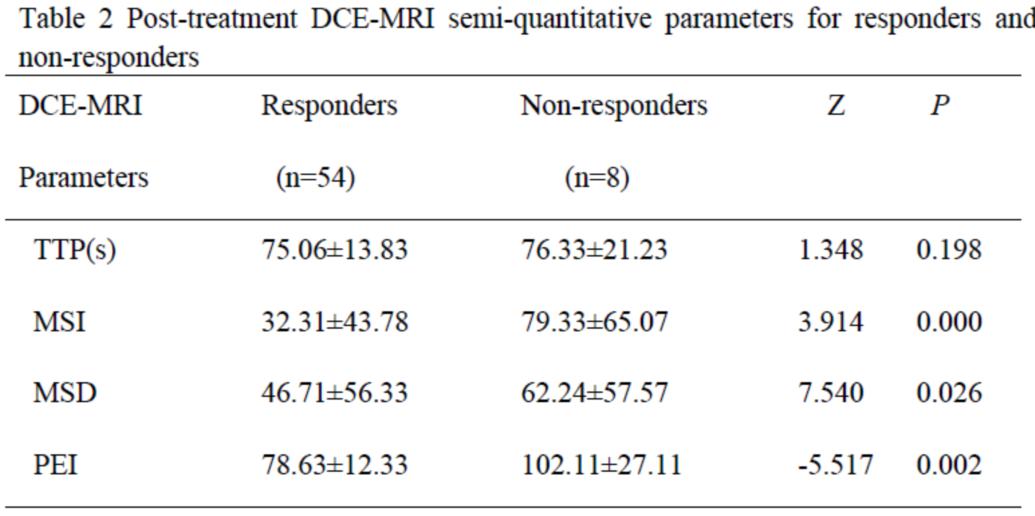
54 of 62 patients (87.1%) were categorized into the responder group (CR, n=28; PR, n=26; Figure 1) whereas the other 8 were considered non-responders (SD, n=8; Figure 2) at the end of treatment. For primary tumors, the pretreatment TTP, MSI, MSD, and PEI for responders were 80.96±17.59seconds, 227.49±70.58, 130.69±126.99, and 198.39±92.18, respectively; for non-responders they were 85.06 ± 22.05 seconds, 126.92±45.15, 73.32±64.33, and 133.76±57.05, respectively (P = 0.401, 0.000, 0.025, and 0.001, respectively, Table 2). The ROC curve analysis indicated that, the areas under curve (AUC) of pre-treatment MSI, MSD, PEI and post-treatment MSI, MSD, PEI were 0.882, 0.802, 0.758, 0.798, 0.721 and 0.678, respectively. The cutoff for pretreatment MSI value in best predicting responders was 154.81 and the corresponding sensitivity, and specificity were 89.3% and 73.5%, respectively (Figure 3).Discussion and conclusion
Our preliminary results indicated that higher pre-treatment MSI, MSD, PEI and lower post-treatment MSI, MSD, PEI may be associated with good response to chemo-radiotherapy in larynx and hypopharynx carcinoma. While pre- and post- treatment TTP both did not differ significantly between the responders and non-responders. These results are consistent with the idea that vascularization at the tissue level and tumor hypoxia in solid tumor may be closely related to chemo-radiotherapy sensitivity; the results also support the hypothesis that tumors with relatively higher blood volume and blood flow are associated with increased oxygenation levels leading to better response to chemo-radiation treatment. Overall, the semi-quantitative metrics (MSI, MSD, PEI) derived from DCE-MRI may be viable biomarkers for predicting response to chemo-radiotherapy for larynx and hypopharynx carcinoma.Acknowledgements
No acknowledgement found.References
[1] Kuo, P et al. Laryngoscope. 2014; 124:2064-9.[2] Takes, RP et al Head Neck. 2012 ; 34:270-81.[3] Kim, S et al AJNR Am J Neuroradiol. 2010; 31:262-8.
[2] Takes, RP et al Head Neck. 2012 ; 34:270-81.[3] Kim, S et al AJNR Am J Neuroradiol. 2010; 31:262-8.
[3] Kim, S et al AJNR Am J Neuroradiol. 2010; 31:262-8.
Figures