4366
Absence of oxygen enhanced changes in T2* within head and neck cancer metastatic cervical lymph nodes is associated with local disease recurrence within 2-years following chemoradiotherapy1Centre for Medical Imaging, University College London, London, United Kingdom, 2Medical Physics, University College London Hospital, London, United Kingdom, 3Research Department of Oncology, University College London, London, United Kingdom, 4Radiotherapy Department, University College London Hospital, London, United Kingdom
Synopsis
Hypoxia within head and neck squamous cell cancer metastatic lymph nodes is associated with poorer outcomes following chemoradiotherapy when measured directly using polarographic probes.
The utility of non-invasive pretreatment T2* measurement in prediction of chemoradiotherapeutic response was investigated. Our data suggest, however, that nodes demonstrating sustained post-therapy complete local response based on two-year follow-up are significantly more hypoxic compared with relapsing-nodes and paradoxically demonstrate a significant increase in hypoxia on breathing 100%-oxygen.
Following further work to ascertain the mechanisms of these observed changes, the differential response to oxygen and lower baseline oxygenation in responding-nodes could be exploited in risk stratification.
Purpose
To evaluate utility of metastatic lymph node (LN) T2* relaxation times breathing air and 100%-oxygen as predictors of chemoradiotherapeutic response in head and neck squamous cell cancer (HNSCC).Introduction
Hypoxia is induced by an inability of the vascular system to supply sufficient oxygen to growing tumours, and when measured directly by polarographic methods is associated with poorer outcomes following chemoradiotherapy in HNSCC LN disease [1]. Non-invasive MR measurement of nodal hypoxia is therefore an appealing target for risk-stratification in HNSCC patients. Specifically, deoxyhaemoglobin decreases the transverse relaxation time, T2*, from which tissue oxygenation may be inferred [2].Methods
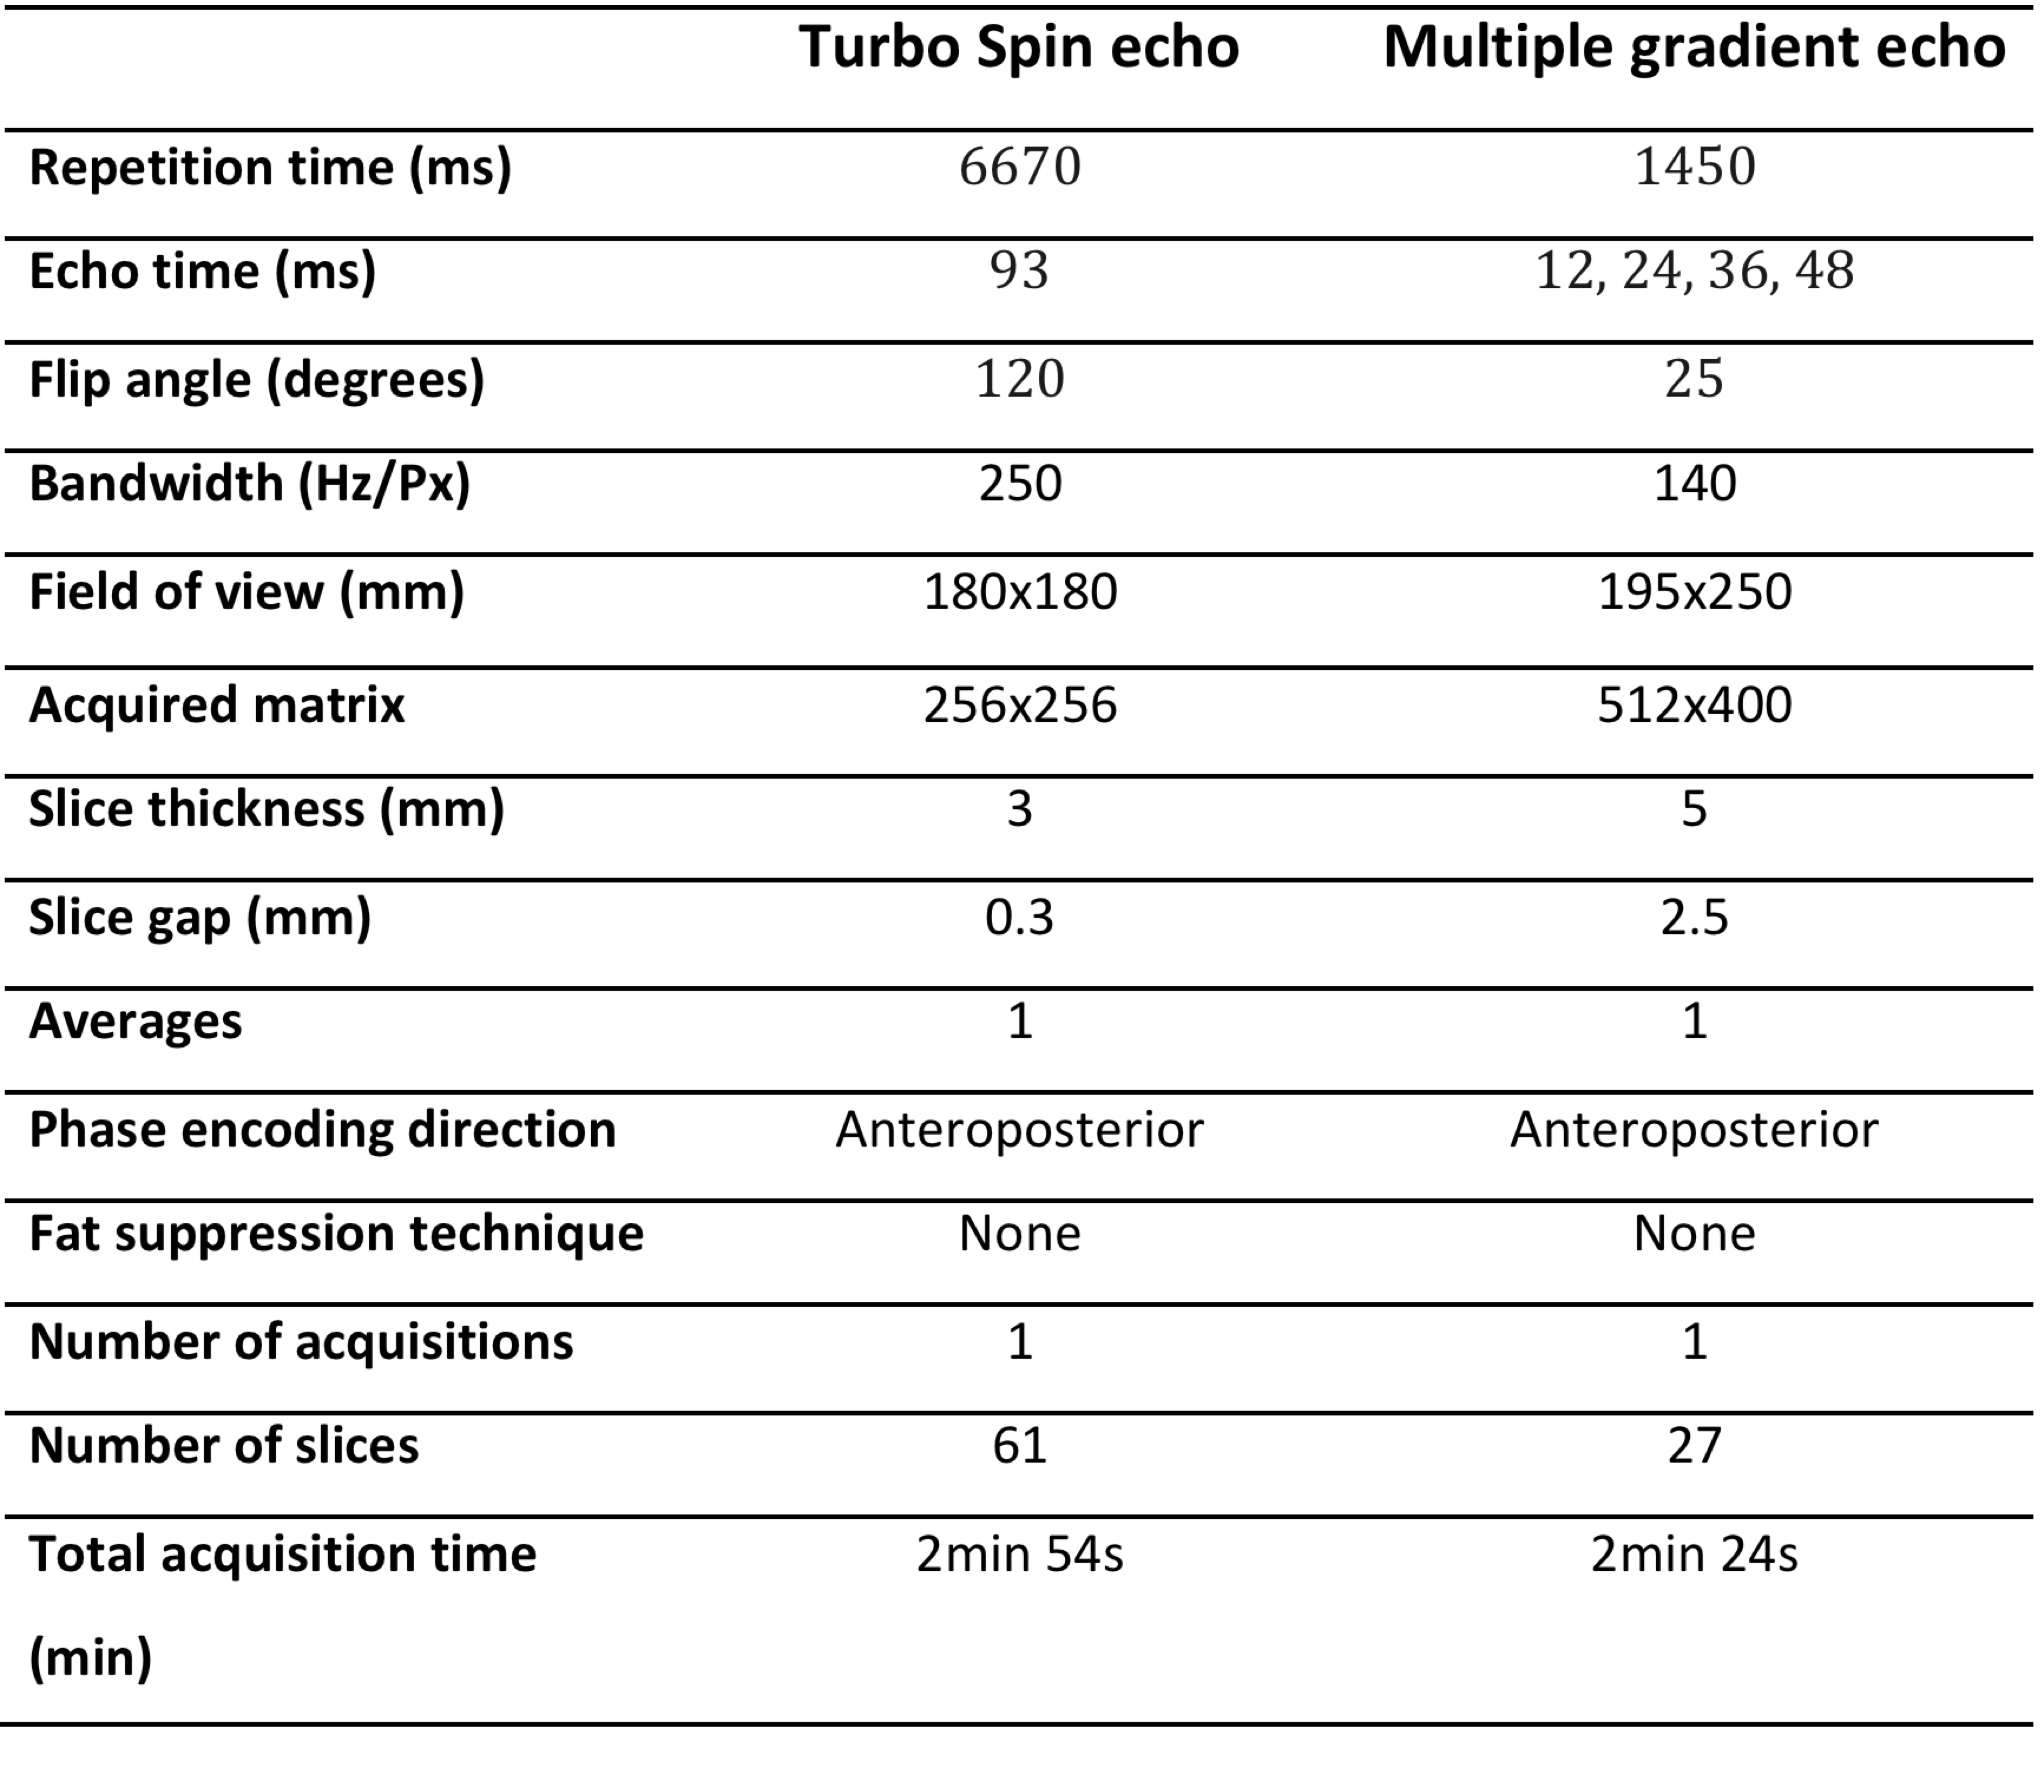
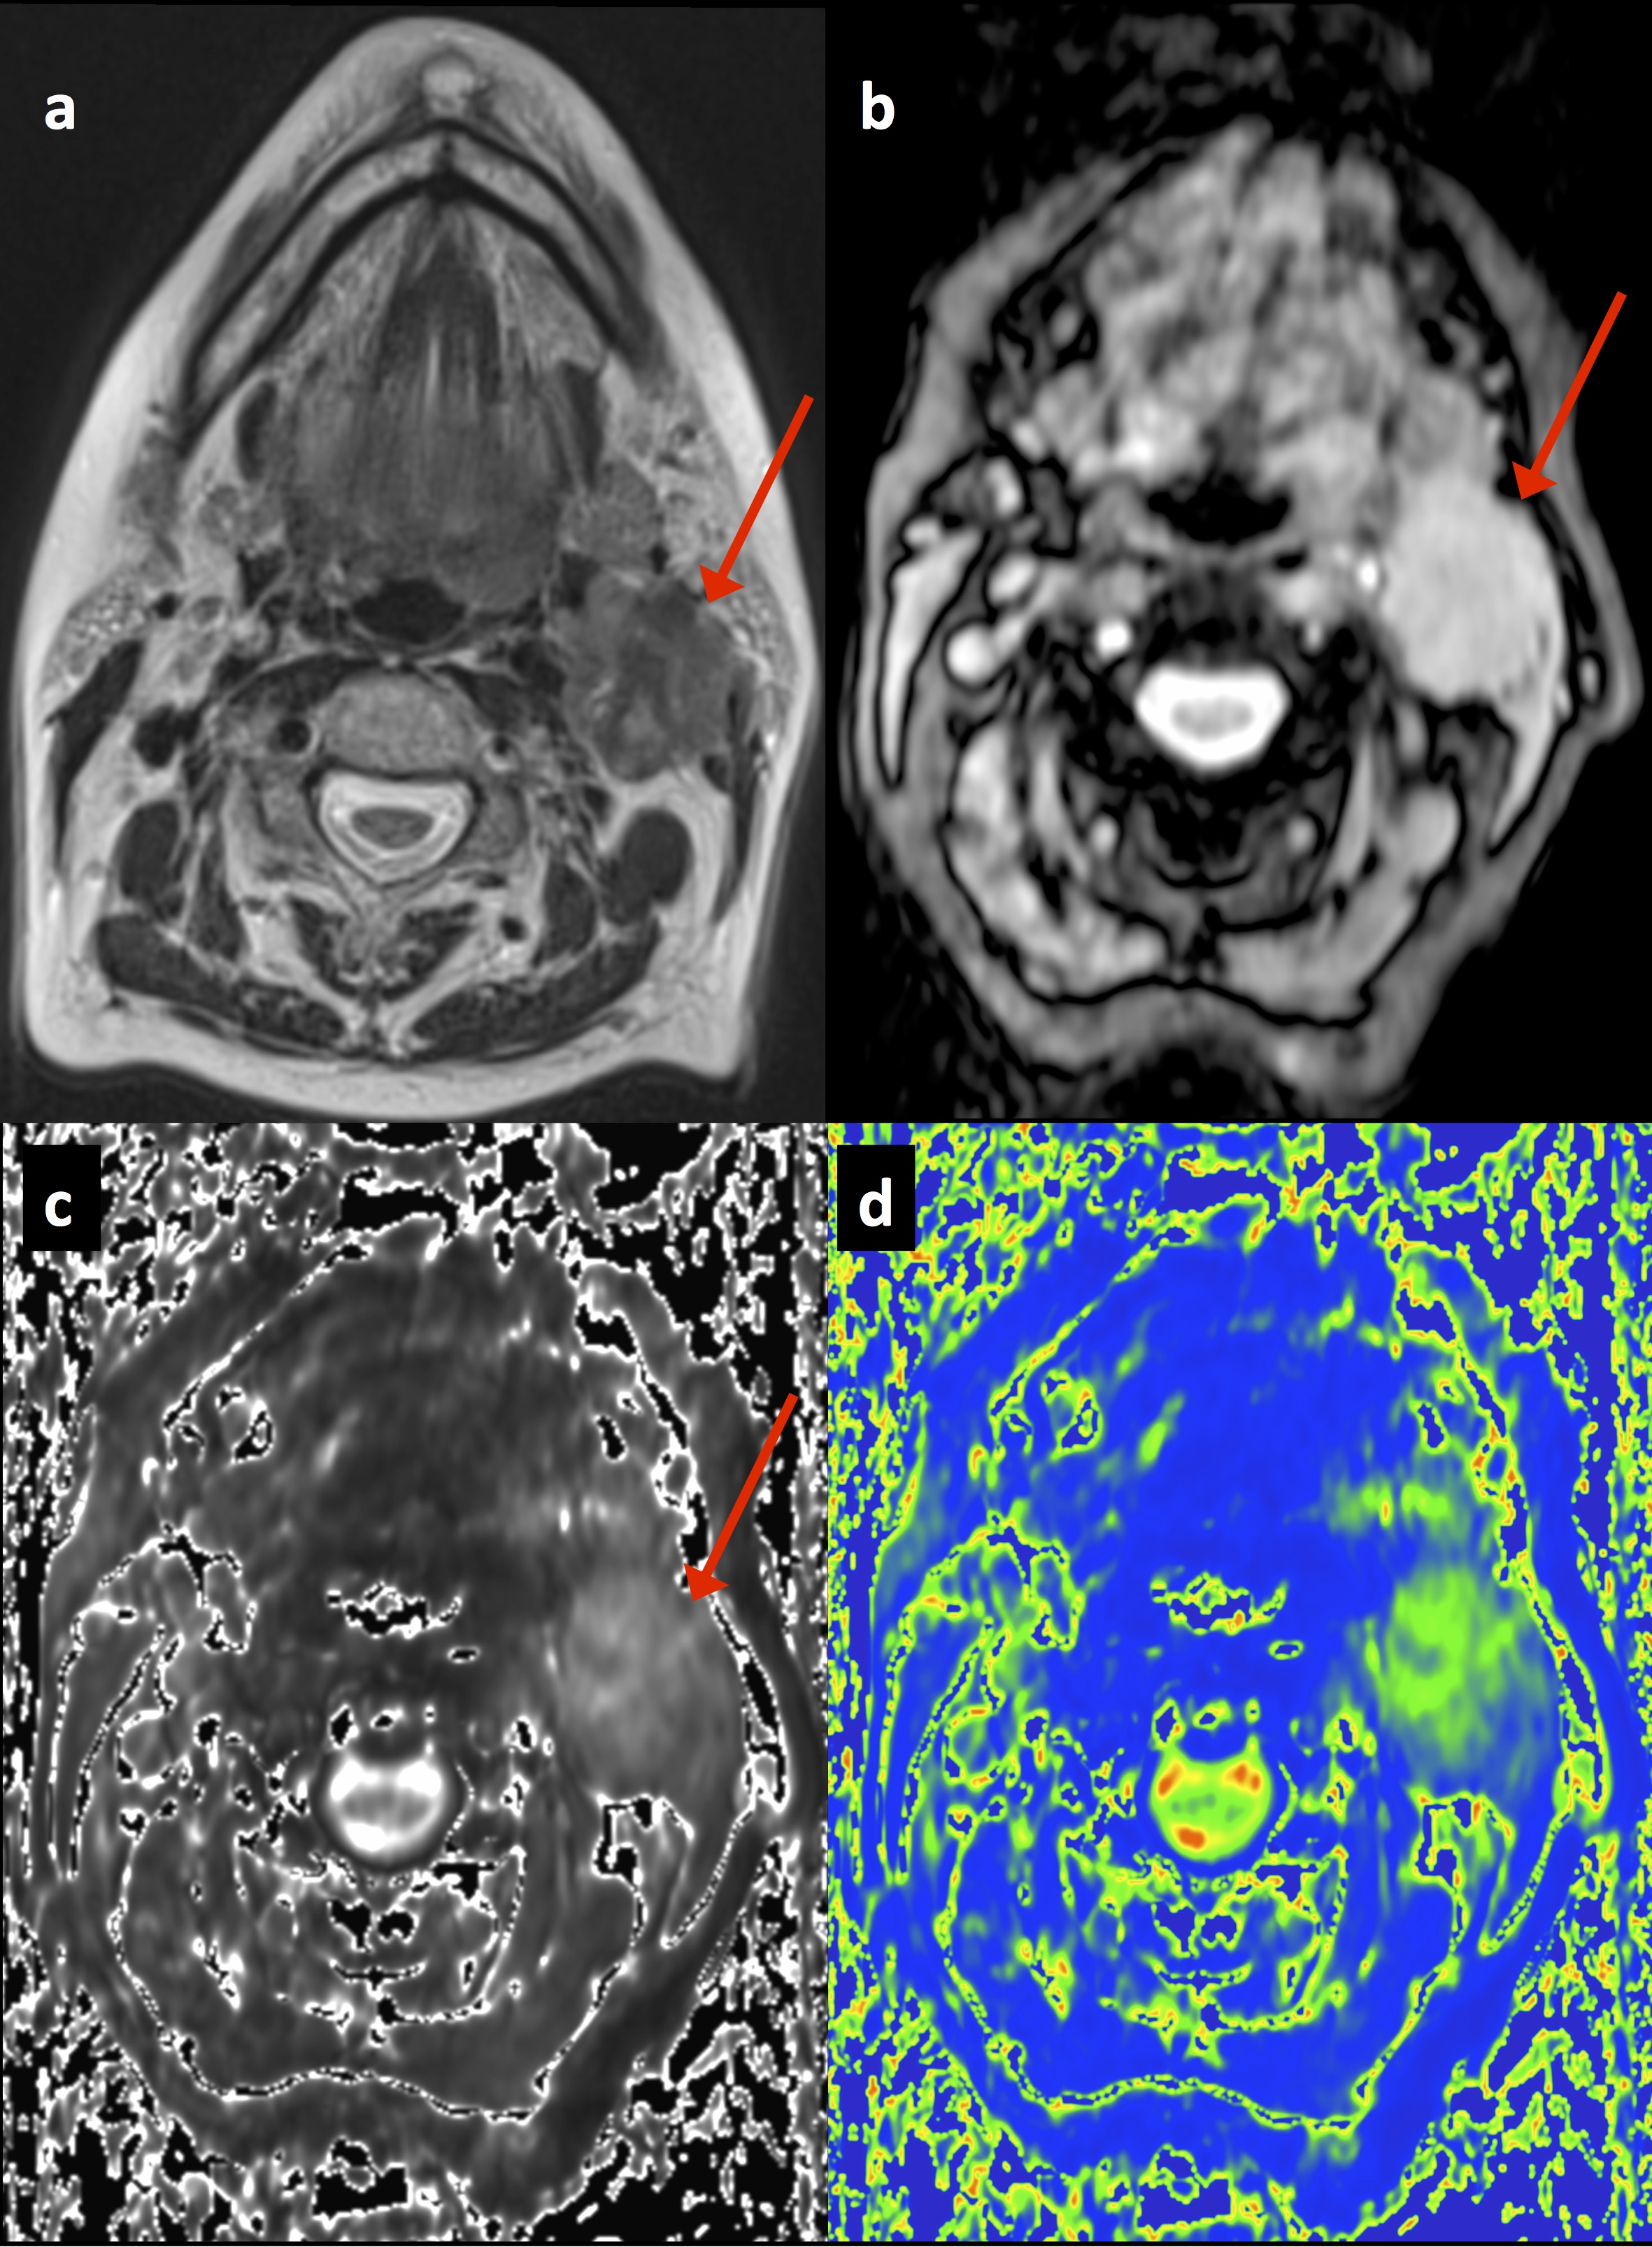
Institutional approval was obtained. Patients with histologically-proven HNSCC and N2/3 LN-disease [3] were recruited between February-2010 and September-2014. Forty-eight patients (mean-age 59.6years) underwent baseline 1.5T MRI (Avanto, Siemens, Erlangen, Germany) prior to chemoradiotherapy (median interval 22days). Conventional T2-weighted-sequences were followed by axial T2*-weighted-imaging of the neck using a standard multi-echo gradient-echo-sequence (Figure-1). T2* images were initially acquired with patient breathing room-air and then repeated after 100%-oxygen inhalation at 15L/min for four minutes via non-rebreather facemask continuing during scanning. T2* maps were produced using numerical-fitting algorithm [4] with Matlab(v7.13) on a pixel-by-pixel basis (Figure-2).
Two experienced specialist head and neck radiologists in consensus identified pathological nodes with reference to prior imaging and cytology/histology (though blinded to 2-year outcome) and used T2-weighted-images to document short-axis-diameter and qualitative radiological descriptors/classifiers such as nodal contours, enhancement-pattern and necrosis. Each node was then volumetrically contoured on both ‘air’ and ‘100%-oxygen’ 12ms T2*-weighted-images excluding foci of necrosis. Segmented volumes were then transferred to air and 100%-oxygen T2*-maps respectively. In total 170 nodal volumes-of-interest (median 3/patient; 1-13) were contoured. Median, skewness and kurtosis of pixel histograms were derived for each node from air and 100%-oxygen T2*-maps.
Multidisciplinary consensus review of at least two-years of clinical, imaging and histopathological follow-up was performed and each patient was categorized into sustained post-therapy complete local response (CR; n=33; 104 nodes) or recurrent/residual nodal disease relapse (RD; n=17; 66 nodes). Comparisons were made both for the largest-node per-patient (LNPP) and for all-nodes (AN).
Specifically, qualitative classifiers and short-axis nodal-diameter were compared between the outcome groups using Fishers exact and Mann Whitney tests respectively. Pairwise parameter differences between air and 100%-oxygen datasets were calculated using Wilcoxon signed-rank test. Histographic parameters were compared between each outcome group using Mann Whitney test.
Results
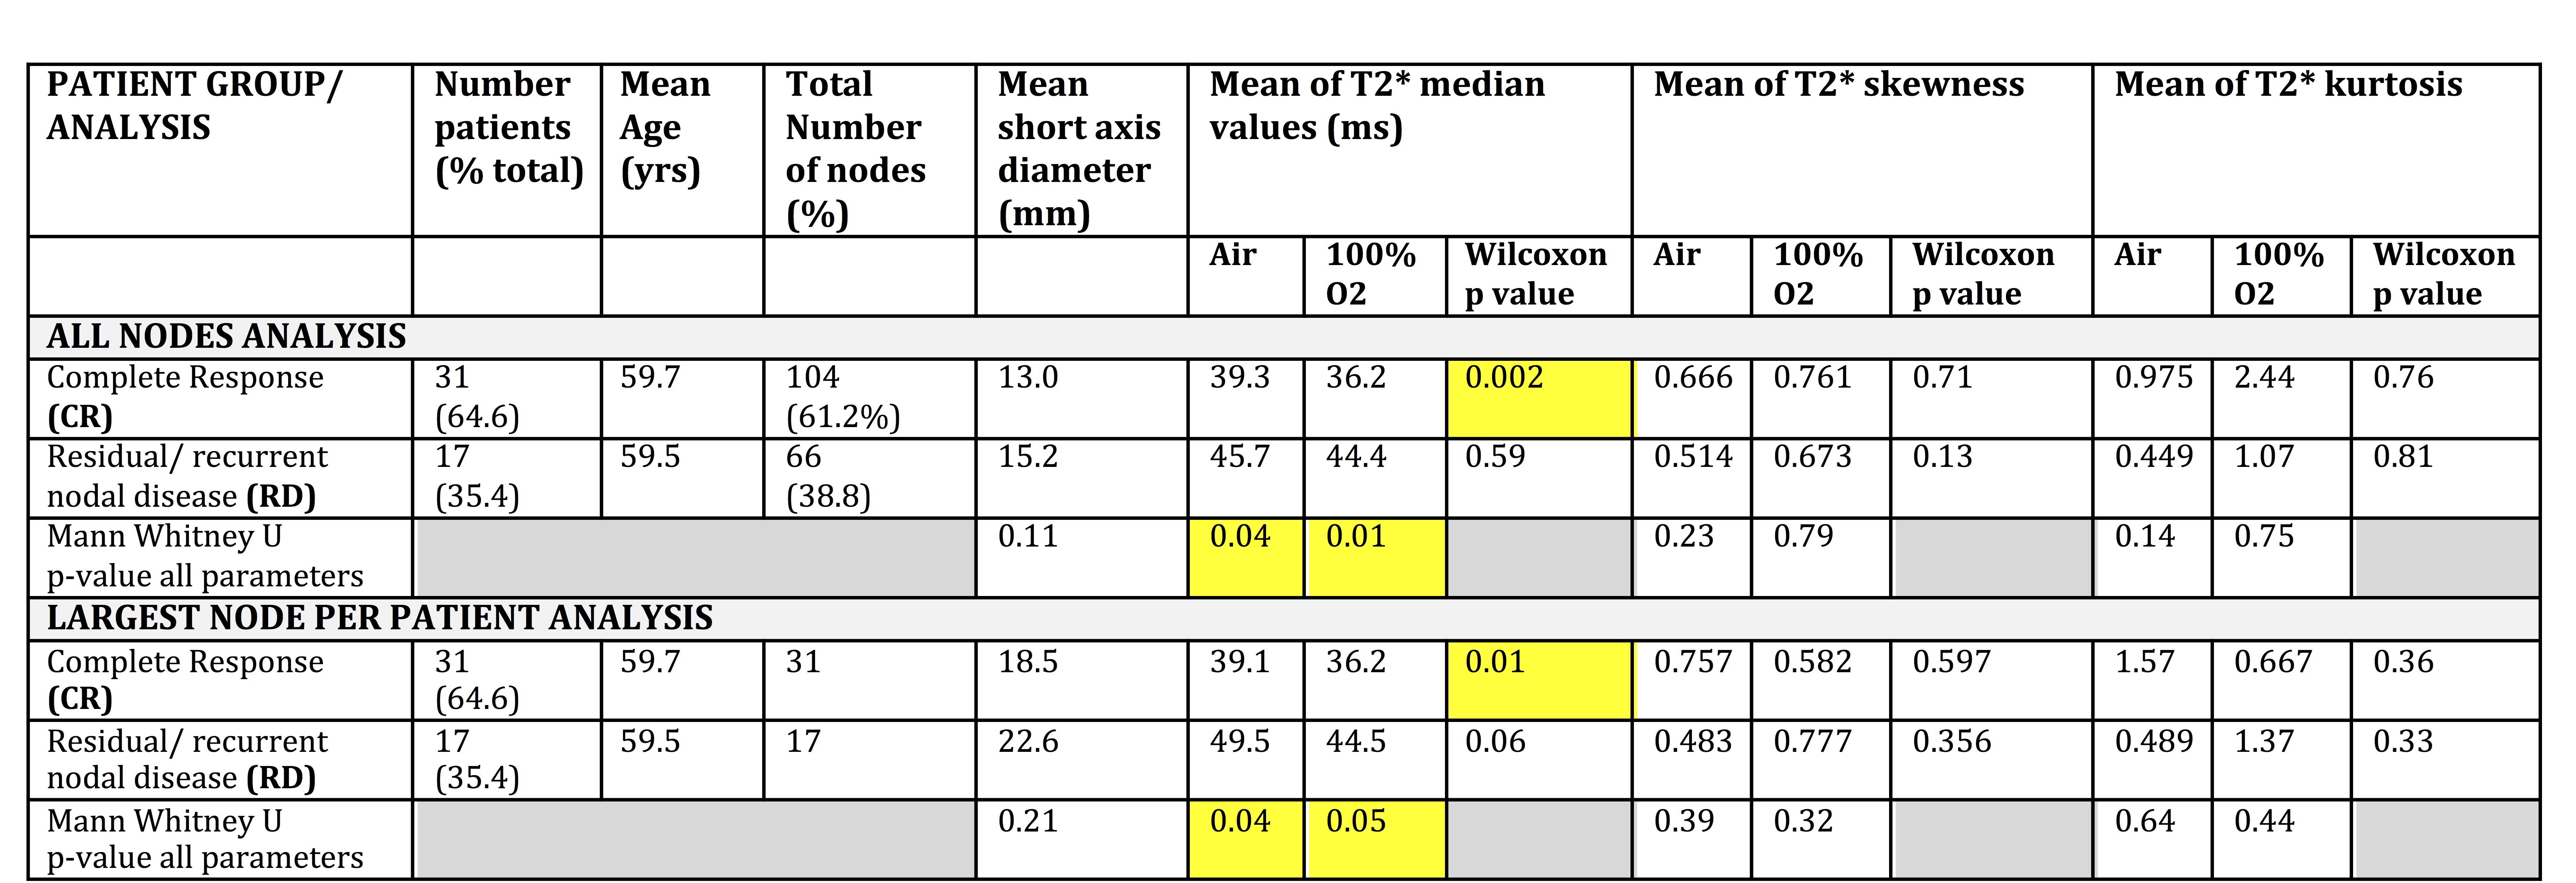
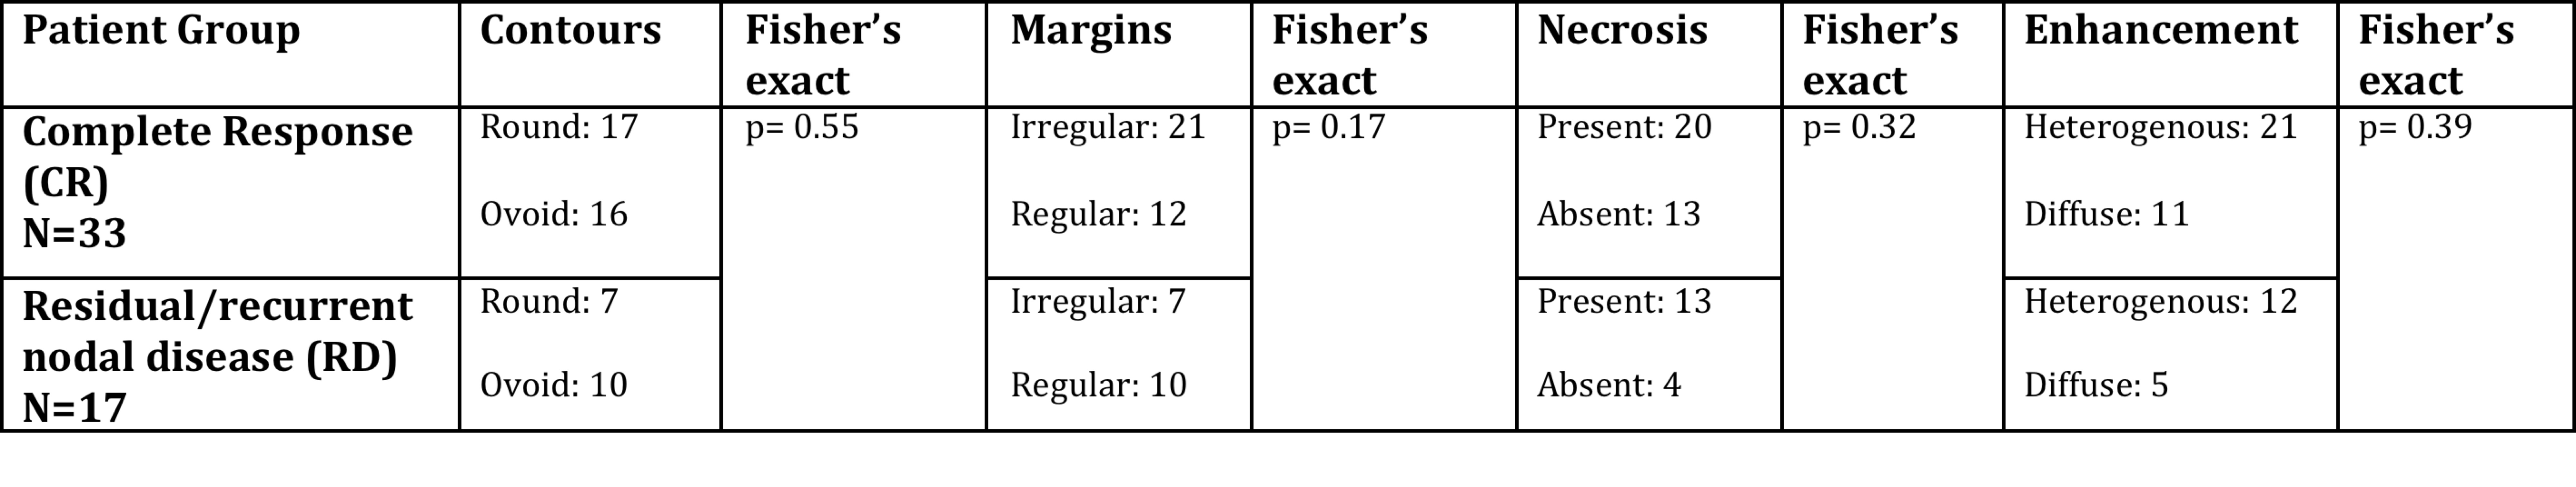
Figure-3 summarises the pretreatment nodal-diameter and histographic T2*-parameters for metastatic nodes between CR- and RD-groups (AN and LNPP). Figure-4 summarises qualitative radiological-classifiers.
There was no significant difference between the groups for nodal-size (p=0.11 AN, p=0.21 LNPP) or binary-classifiers of nodal status (Fisher’s p=0.17-0.55).
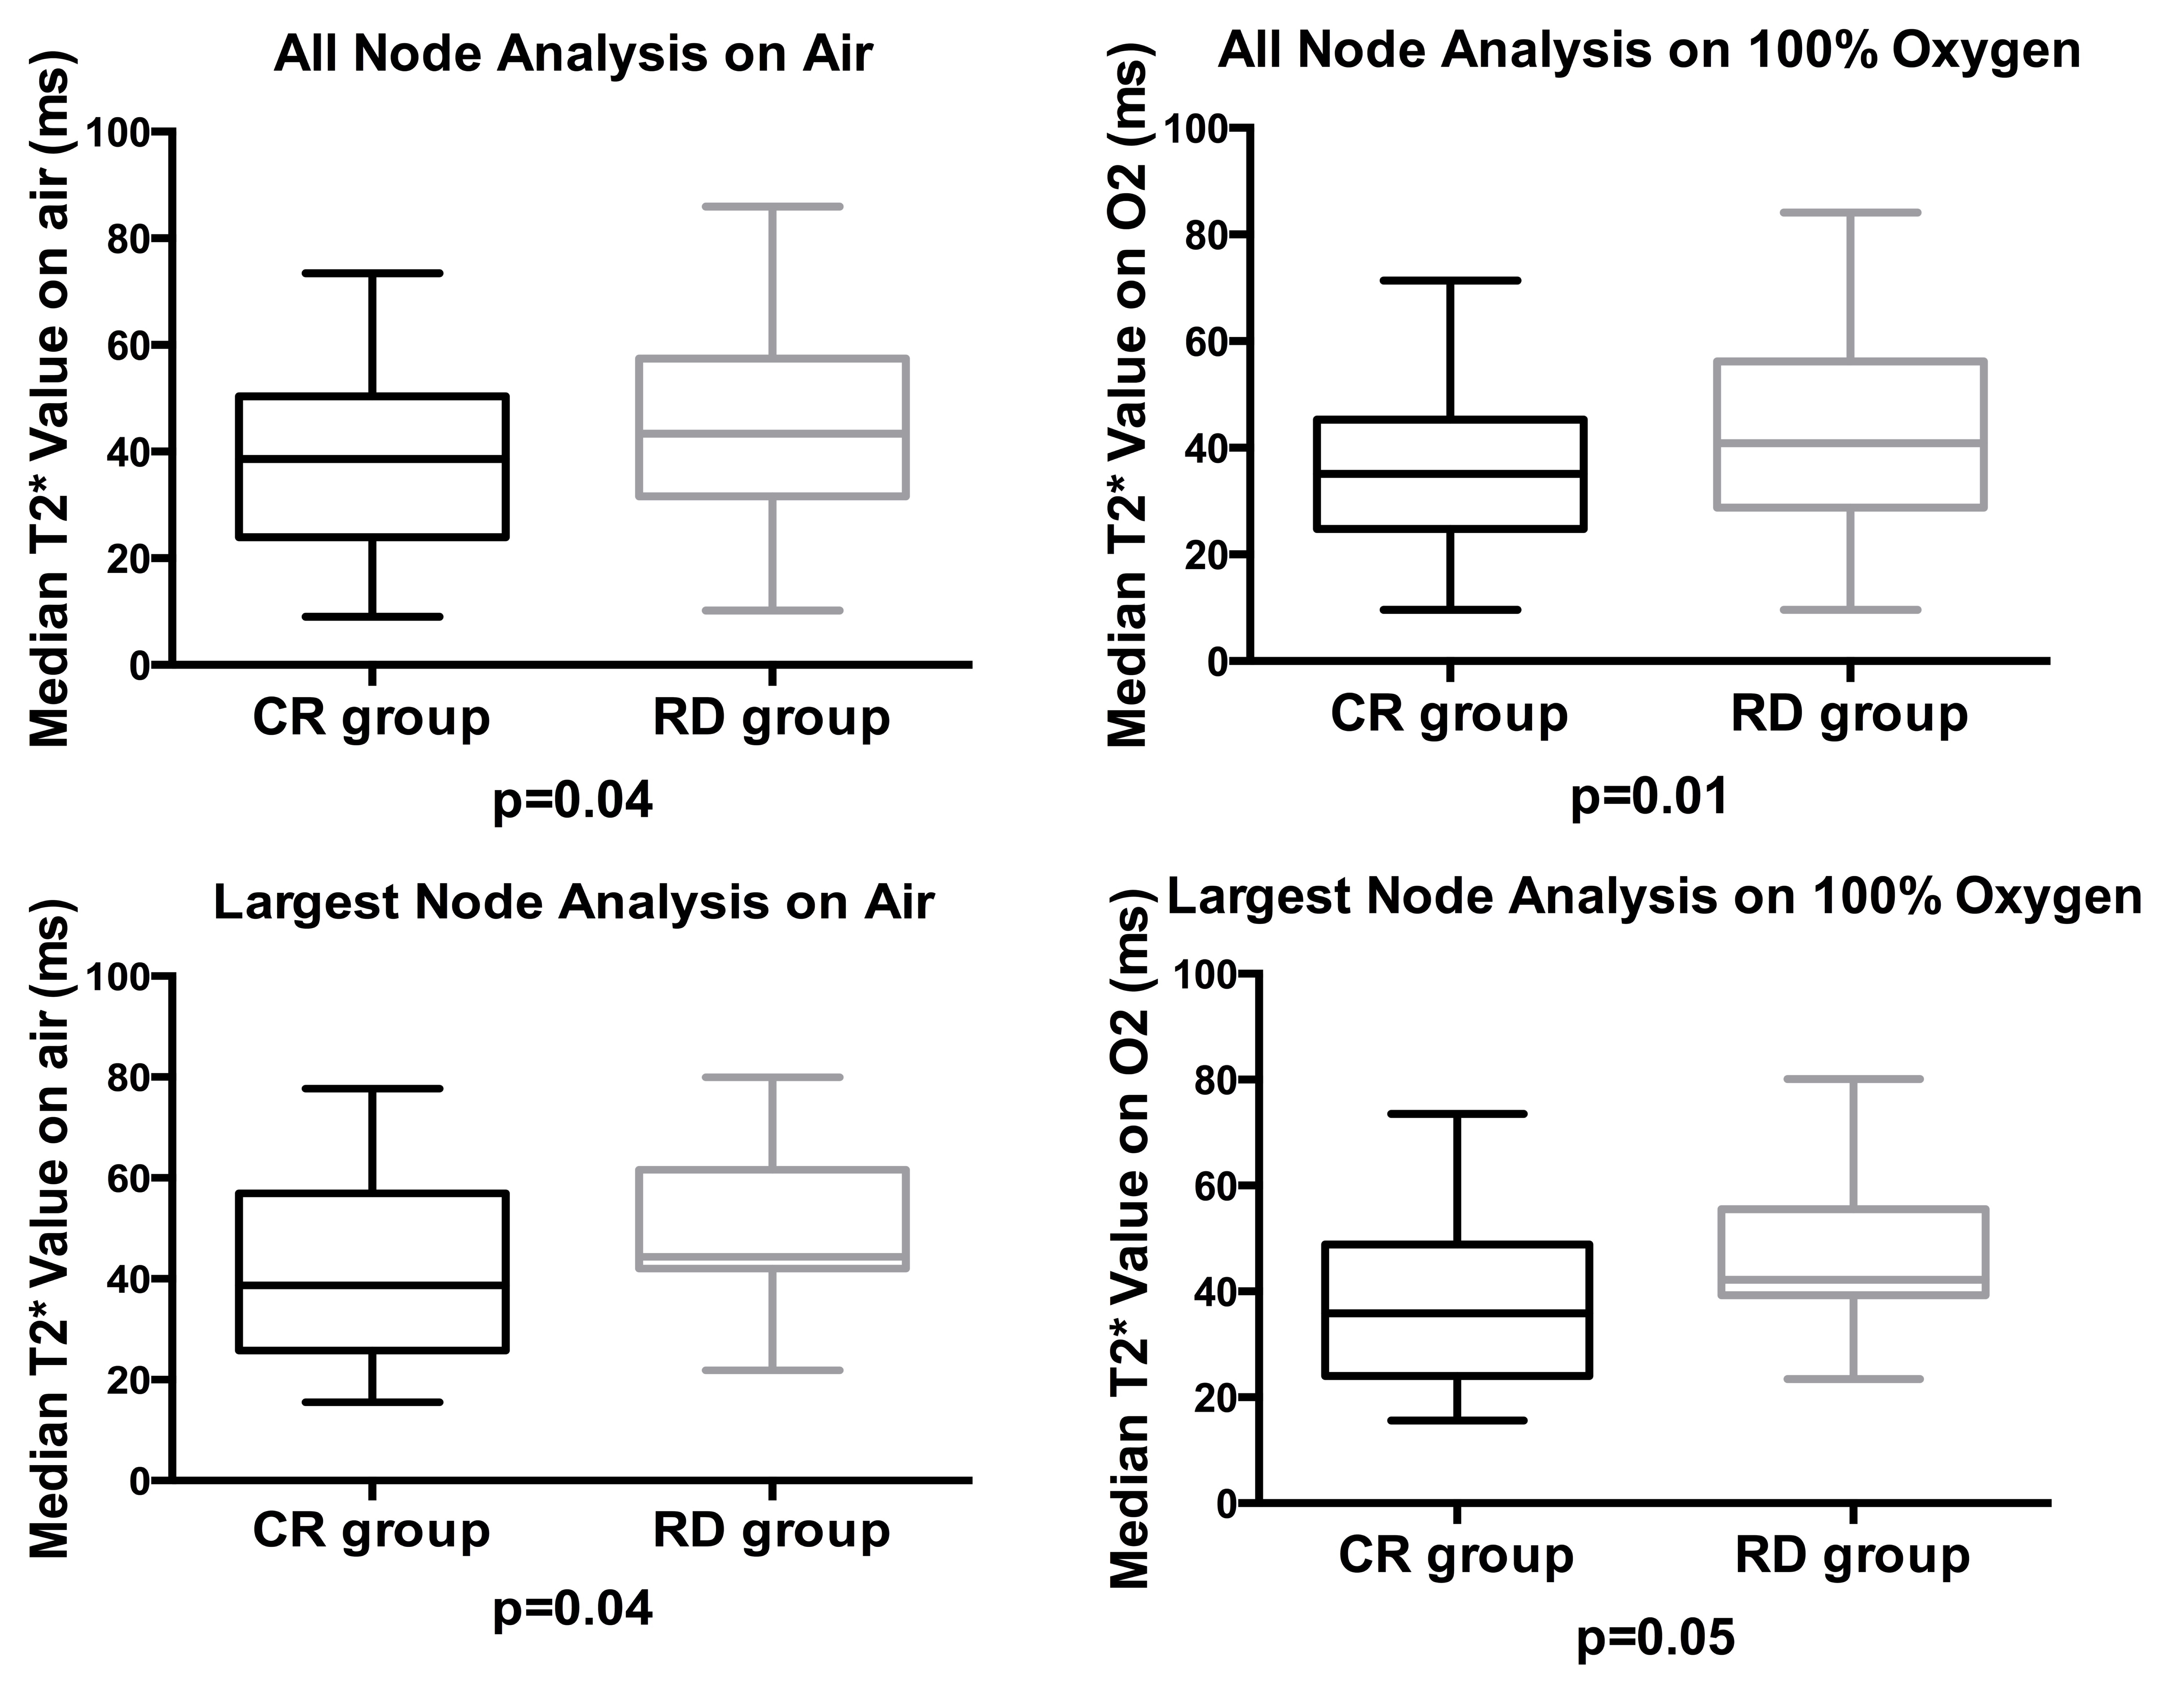
Conversely, pairwise comparison revealed a significant decrease in median T2* values with 100%-oxygen compared to breathing air in CR-group (p=0.002 AN, p=0.012 LNPP) but no such significant decrease in RD-group (p=0.585 AN, p=0.055 LNPP).
Median T2* values were significantly lower for CR versus RD both when breathing air (p=0.04 AN/LNPP) or 100%-oxygen (p=0.01 and 0.05) (Figure-5).
There were no significant pairwise differences between groups for histogram skewness and kurtosis when breathing 100%-oxygen compared to air. No significant differences were observed in skewness or kurtosis on air or 100%-oxygen between the two cohorts (p=0.14-0.79).
Discussion and Conclusion
Our data showed that reduction in T2* on 100%-oxygen compared to air was significant for LNs which subsequently respond to chemoradiotherapy but not for non-responding nodes. Furthermore, responding-nodes had significantly lower absolute T2* on air and 100%-oxygen. The data suggest good-prognosis LNs are more hypoxic at baseline and become even more hypoxic on 100%-oxygen. These findings contradict prior direct measurement [1] data. Possible explanations are that direct measurement experiments are unable to sample the whole nodal or avoid necrotic areas. They also use variable outcome criteria to define poor outcome (e.g. death).
The observed reduction in T2* in pathological LNs confirms previous work [5] suggesting a paradoxical increase in deoxyhaemoglobin concentration on breathing 100%-oxygen which may be the result of physiological effects of breathing 100%-oxygen [6]. Several prior studies have shown an increase in T2* in pathological LNs on breathing hyperoxic gas though this was also hypercapnic which concomitantly elevates respiratory rate [7]. Additionally, some T2* measurement studies in breast cancer [8] have shown a similar paradoxical relationship- postulated to relate to tumour biology and histology [9].
The differential response to 100%-oxygen and lower baseline oxygenation between responding versus non-responding LNs could be exploited in risk stratification given that traditional qualitative radiological classifiers of LN pathology were not associated with response discrimination. Further work is required to ascertain the mechanisms of observed pathological LN baseline T2* and changes under oxygen.
Acknowledgements
This work has been supported by the KCL-UCL Comprehensive Cancer Imaging Centre funding [Cancer Research UK (CR-UK) & Engineering and Physical Sciences Research Council (EPSRC)]. The majority of this work was undertaken at University College London Hospital and University College London, which receive a proportion of funding from the NIHR Biomedical Research Centre funding scheme [Department of Health UK].References
1. Nordsmark M, Bentzen SM, Rudat V, Brizel D, Lartigau E, Stadler P, Becker A, Adam M, Molls M, Dunst J, Terris DJ, Overgaard J (2005) Prognostic value of tumor oxygenation in 397 head and neck tumors after primary radiation therapy. An international multi-center study. Radiother Oncol 77:18–24.
2. Padhani AR, Krohn KA, Lewis JS, Alber M (2007) Imaging oxygenation of human tumours. Eur Radiol 17(4):861-72.
3. Sobin LH. TNM classification of malignant tumours. 7 ed. Chichester, West Sussex, UK; Hoboken, NJ: John Wiley and Sons, 2009.
4. Hagberg GE, Indovina I, Sanes JN, Posse S (2002) Real-time quantification of T(2)(*) changes using multiecho planar imaging and numerical methods. Magn Reson Med 48(5):877-82.
5. Tudisca C, Price D, Forster M, Fitzke H, Punwani S (2014) Exploration of change of T2* of metastatic and normal cervical lymph nodes caused by 100% oxygen breathing. Proc. Intl. Soc. Mag. Reson. Med. 22 (abstract 0555).
6. Daly W, Bondurant S (1962) Effects of oxygen breathing on the heart rate, blood pressure, and cardiac index of normal men--resting, with reactive hyperemia, and after atropine. J Clin Invest 41:126-32.
7. Rijpkema M, Kaanders JH, Joosten FB, van der Kogel AJ, Heerschap A (2002) Effects of breathing a hyperoxic hypercapnic gas mixture on blood oxygenation and vascularity of head-and-neck tumors as measured by magnetic resonance imaging. Int J Radiat Oncol Biol Phys 1;53(5):1185-91.
8. Padhani AR (2010) Science to practice: what does MR oxygenation imaging tell us about human breast cancer hypoxia? Radiology 254:1–3.
9. McPhail LD, Robinson SP (2009) Intrinsic susceptibility MR imaging of chemically-induced rat mammary tumors: relationship to histological assessment of hypoxia and fibrosis. Radiology 2009;254(1):110–118.
Figures