4365
Multiparametric MRI assessment of tumor physiological changes during hypofractionated SABR1Radiology, Univ Texas Southwestern Medical Center, Dallas, TX, United States, 2Radiation Oncology, Univ Texas Southwestern Medical Center, Dallas, TX, United States, 3Internal Medicine, Univ Texas Southwestern Medical Center, Dallas, TX, United States
Synopsis
Hypofractionated stereotactic body radiation therapy, a new radiation treatment scheme, may be particularly susceptible to tumor hypoxia. We applied oxygen enhanced MRI together with DCE MRI to observe tumor physiological changes induced by a radiation fraction in a human lung cancer xenograft rat model. This study showed reduced vascular oxygenation 24 hours after the first fraction of 12 Gy, as indicated by the significant decrease in T2* compared to baseline, but no significant response in dynamic contrast enhanced MRI. DCE parametric maps revealed a multinodular structure in the tumor as confirmed by histology.
Purpose
Lung cancer is the second most common non-skin cancer in both men and women and is the leading cause of cancer related death [1]. Radiation therapy is a primary treatment modality for non-resectable lung cancer and hypoxia is thought to influence tumor response [2]. Hypoxia is considered to be particularly relevant to the evolving new radiation treatment scheme of hypofractionated stereotactic ablation radiation therapy (SABR). Historical evidence has suggested that reoxygenation occurs during conventionally fractionated therapy, but there is less opportunity during a hypofractionated course and timing could be critical. In this study, we applied blood oxygen level dependent (BOLD) and tissue oxygen level dependent (TOLD) MRI, together with dynamic contrast enhanced (DCE) MRI to explore the longitudinal effects of SABR on tumor oxygenation and vascular perfusion using A549 human lung cancer xenografts in a subcutaneous rat model.Methods
A549 human lung cancer cells (3x10⁶) were implanted subcutaneously in the right hind thigh of twelve nude rats. Rats were divided into three groups: Group 1 served as control (n=3, no irradiation). Group 2 (n=6) breathed oxygen 15 minutes before and during irradiation (12 Gy x three fractions, one week interval between each treatment). Group 3 (n = 3) breathed oxygen 15 minutes before and during irradiation (12 Gy x one fraction only), sacrificed 24 hours later for histology. MRI was performed using a horizontal bore 4.7-T magnet with homebuilt 3.5 cm diameter single-turn solenoid volume coil on the day prior to and 24 hours after the first SABR treatment. Animals were anesthetized with isoflurane and kept warm using a circulating warm water blanket. T1 maps (spin echo; TE= 20 ms, TR ranging from 0.1 to 3.5 s) were acquired during initial air breathing and with oxygen challenge prior to DCE. Interleaved BOLD (multi-echo gradient echo; TR = 150 ms, ten echo times from 6 to 69 ms, flip angle = 20°) and TOLD (gradient echo; TR/TE = 30/5 ms, flip angle = 45°) MRI were acquired with the intervention of an oxygen challenge (from air to 100% O2 after about 10 mins). DCE (spin echo; TR/TE = 200/15 ms) was performed with IV injection of gadolinium contrast (0.1 mmol/kg body weight Gadovist). Data were processed and statistical analysis performed using Matlab. Semi-quantitative percentage signal intensity changes (%ΔSI) of BOLD and TOLD and quantitative T1 and T2* maps were calculated. A reference tissue method was used for the quantitative analysis to obtain blood perfusion-vessel permeability product (Ktrans, unit min-1) and extravascular-extracellular volume fraction (ve) [3].Results
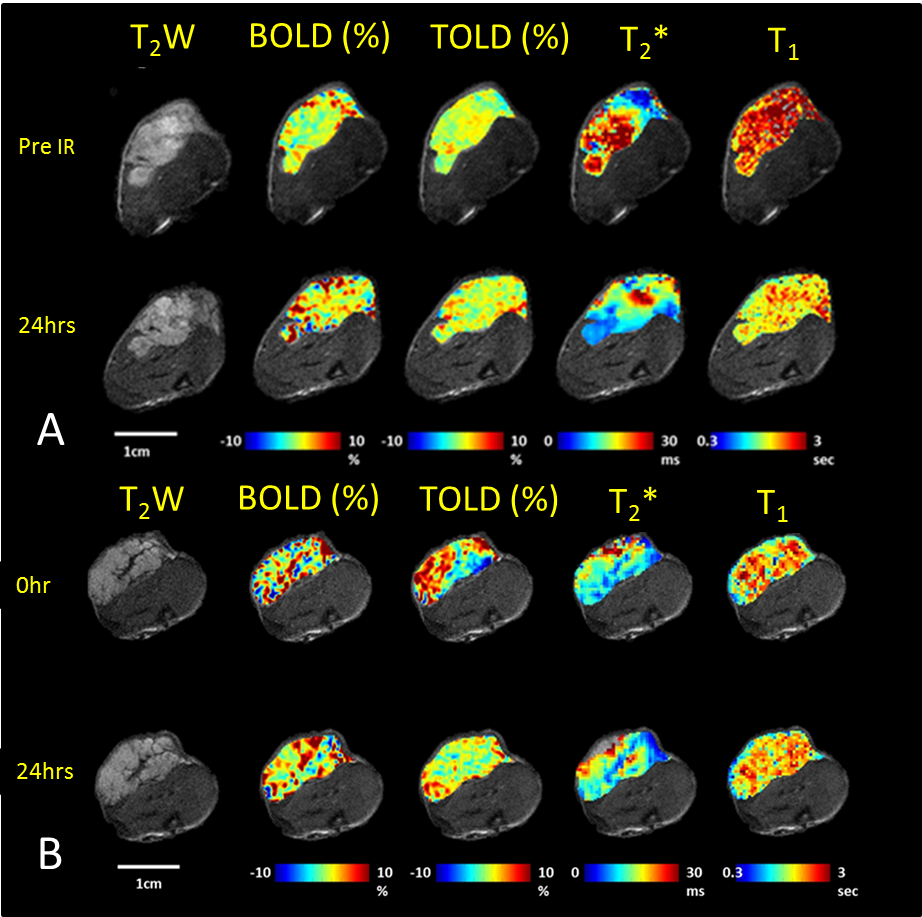
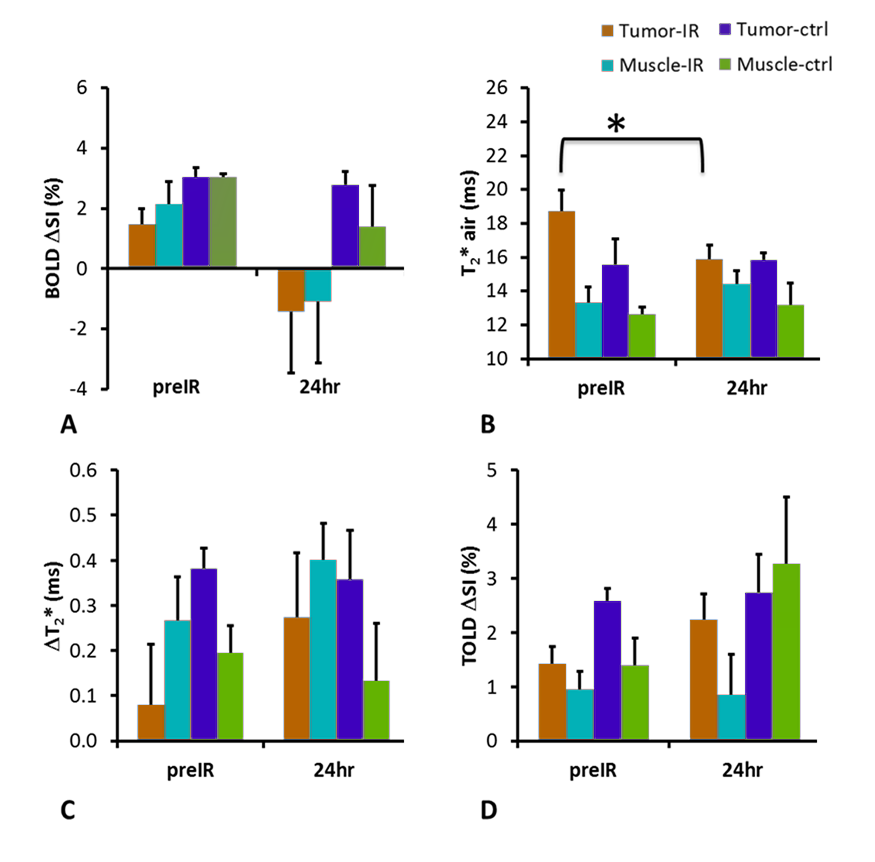
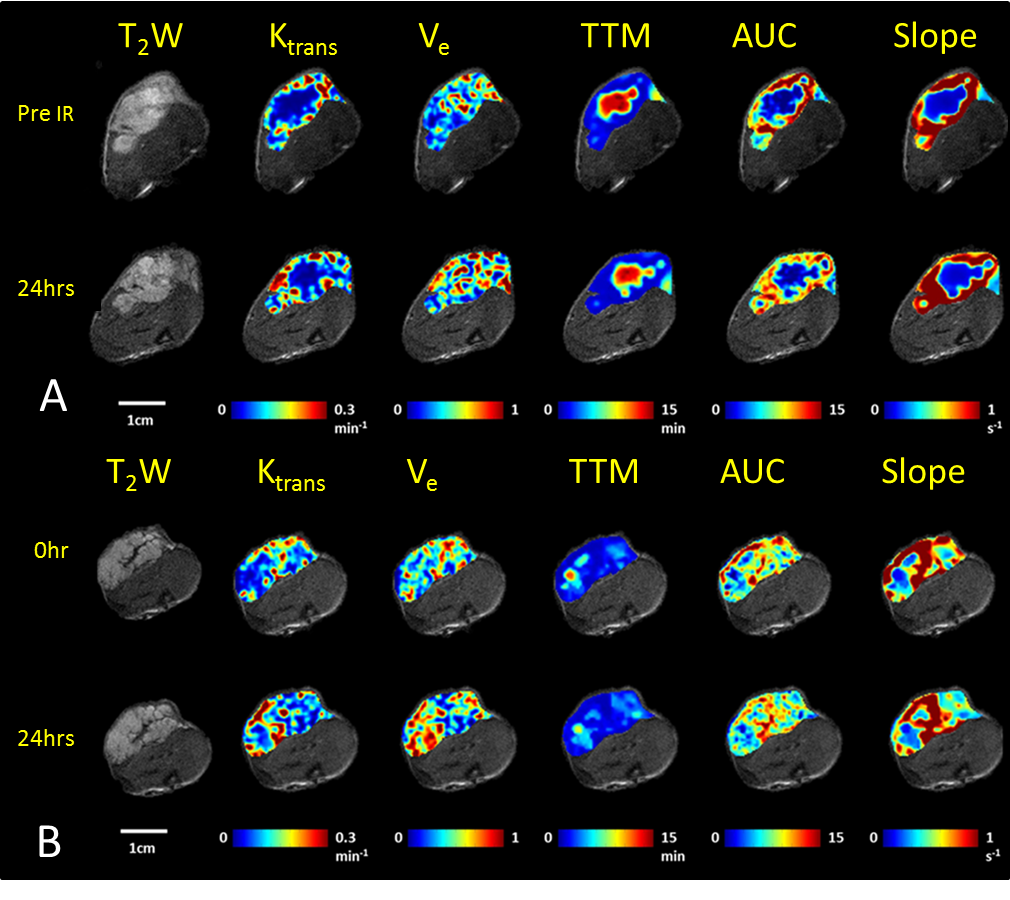
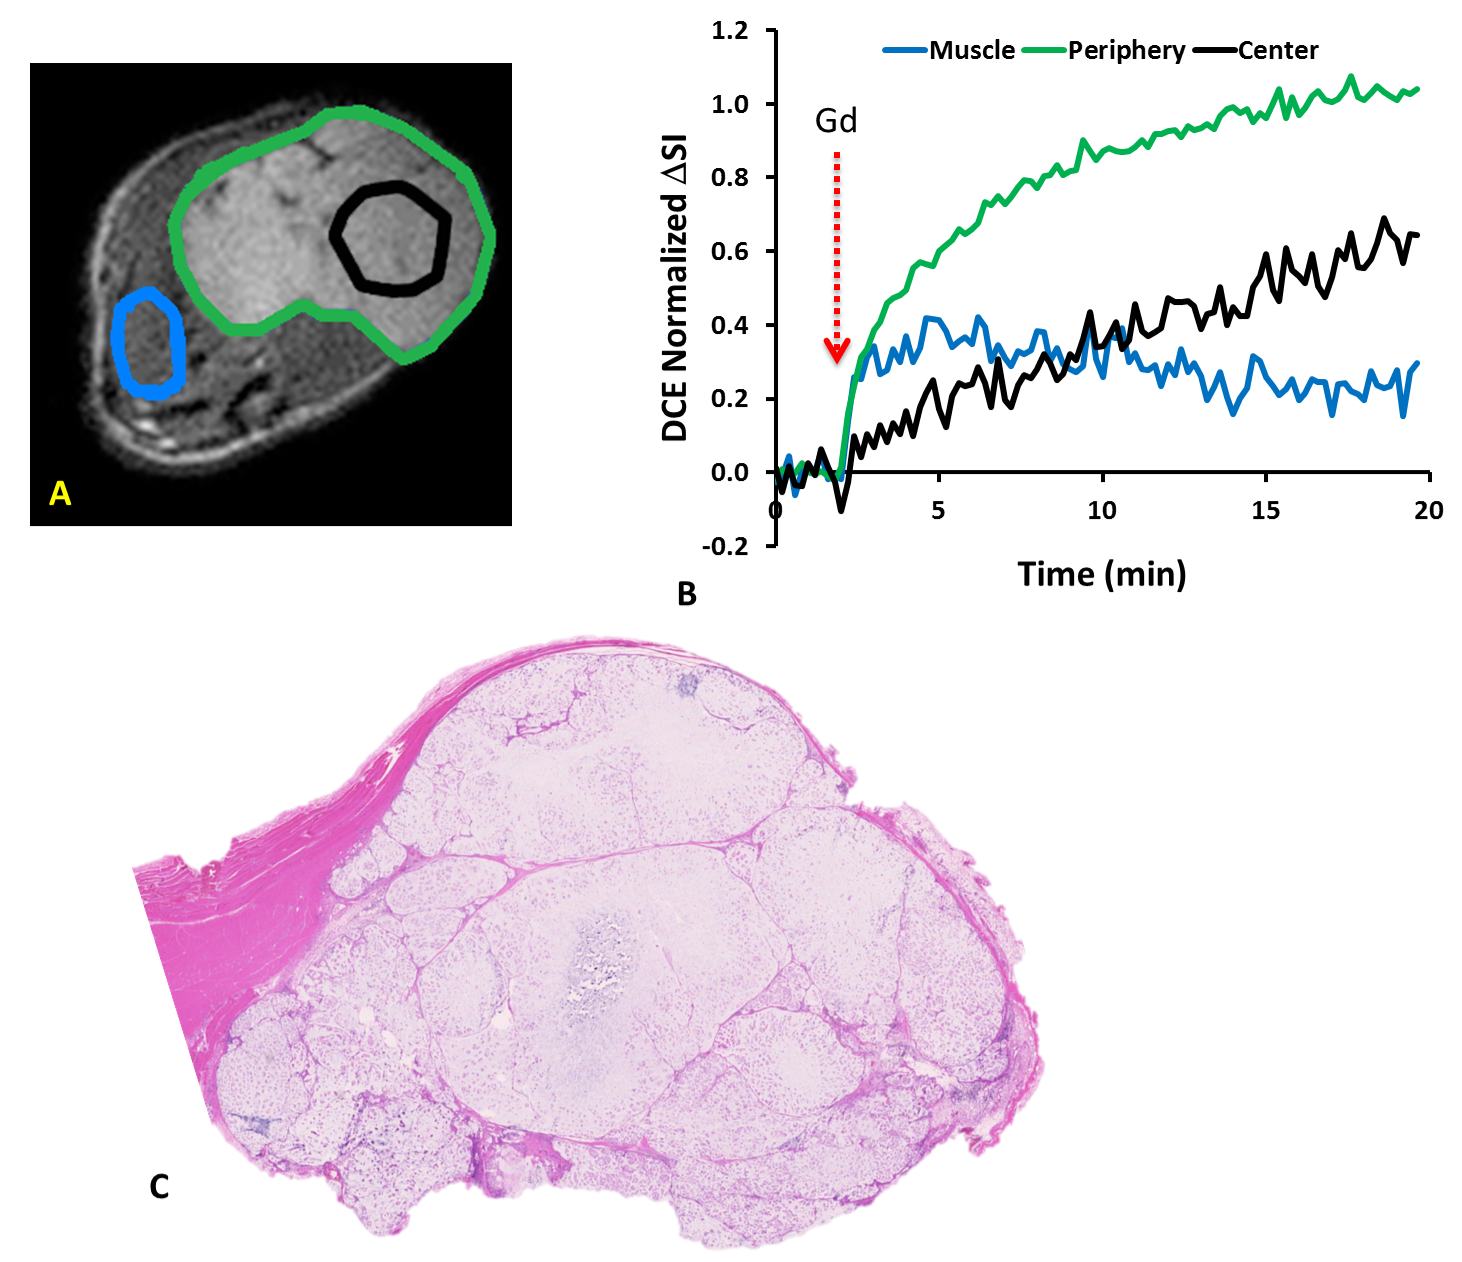
In response to oxygen breathing challenge, most tumors showed modest positive BOLD and TOLD signal response and a slight increase in T2* indicating increased vascular oxygenation at baseline prior to radiation treatment. Heterogeneity in enhancement was apparent, notably with greater response in the tumor periphery, particularly for BOLD and T2* (Representative irradiated and control tumors are shown in Figure 1 A and B). Twenty-four hours after the first dose of radiation, tumors (Groups 2 and 3; n= 9) showed a significantly decreased T2* (-2.9±4.2 ms; p=0.045). By comparison, control tumors showed a similar BOLD response and T2* value at baseline and 24 hours. Adjacent thigh muscle showed no significant changes for irradiated or control rats (Figure. 2). No obvious changes were observed in the DCE parametric maps of irradiated (Figure 3 A) or control tumors (Figure 3 B). The boundaries of the multi-nodular tumors were obvious on the DCE maps both before and after radiation treatment. DCE curves showed distinctly different patterns for tumor periphery and center (Figure 4 A, B). H&E staining (Figure 4 C) confirmed the multi-nodular structure of the tumors. Rats were cured of the primary tumors by 3x12 Gy, providing long term survival, though with ultimate metastatic recurrence.Discussion
In response to 12 Gy radiation, most parameters were essentially unchanged after 24 hours. BOLD response decreased, though not significantly. The only significant change was in transverse relaxation time T2*, which was significantly decreased after one day suggesting increased concentration of deoxyhemoglobin.Conclusion
This study showed reduced vascular oxygenation, as indicated by the significant decrease in T2* compared to baseline 24 hours after first fraction of 12 Gy, but no significant response in dynamic contrast enhanced MRI. DCE parametric maps revealed the multinodular structure in the tumor, confirmed by histology. All rats were cured of their primary tumors with 3 x 12 Gy, but the vascular hypoxiation may become relevant for optimizing treatment interval in future studies.Acknowledgements
Supported in part by funds from CPRIT MIRA RP120670-P3; NIH 1P30 CA142543, P41 EB015908, S10 RR028011.References
1. Siegel, R., et al., CA Cancer J. Clinicians, 64, 9-29 (2014).
2. Tatum, J.L., et al., Int. J. Radiat. Biol., 82, 699-757 (2006).
3. Faranesh, A.Z., et al., Phys. Med. Biol., 53, 2617-2631 (2008).
Figures