4362
ADC and Kurtosis parameters show early response to anti-angiogenic therapy in patients with liver metastases1CR-UK Cancer Imaging Centre, The Institute of Cancer Research and Royal Marsden Hospital, London, United Kingdom
Synopsis
Diffusion Weighted Imaging (DWI) is a valuable method of characterising tumour cellularity and assessing tumour response to therapy. Diffusion Kurtosis Imaging (DKI) is now being investigated outside of the brain, as the diffusional kurtosis metrics are strongly linked to cellular microstructure and heterogeneity in tissues. This work assesses tumour response to anti-angiogenic therapies as derived from DWI and DKI data in a cohort of patients with liver metastases enrolled on an early phase clinical trial. Our results demonstrate a significant cohort response to treatment of the ADC parameter, but also observed significant non-Gaussian diffusion behaviour.
INTRODUCTION
Diffusion Weighted Imaging (DWI) is a valuable method of characterising tumour cellularity and assessing tumour response to therapy1. Diffusion Kurtosis Imaging (DKI) is now being investigated outside of the brain2,3, as the diffusional kurtosis metrics are strongly linked to cellular microstructure and heterogeneity in tissues. Here, we are assessing the tumour response to anti-angiogenic therapies as derived from DWI and DKI data in a cohort of patients with liver metastases enrolled on an early phase clinical trial.PATIENTS AND METHODS
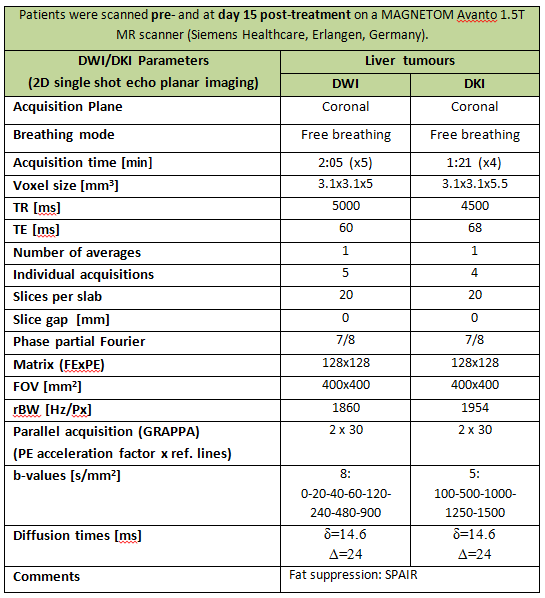
22 patients with liver metastases enrolled in a novel anti-angiogenic drug trial were scanned pre-treatment and at day 15 post-treatment using protocols of DWI and DKI with matched size of the field of view, see sequence parameters in Table 1.
The b-values of the DWI sequence were chosen in order to allow calculation of apparent diffusion coefficient (ADC) and intravoxel incoherent motion (IVIM) derived parameters (not discussed here), whilst the b-values for DKI were aimed at assessing the kurtosis model. The main interest was to evaluate complementary information given by the two sequences.
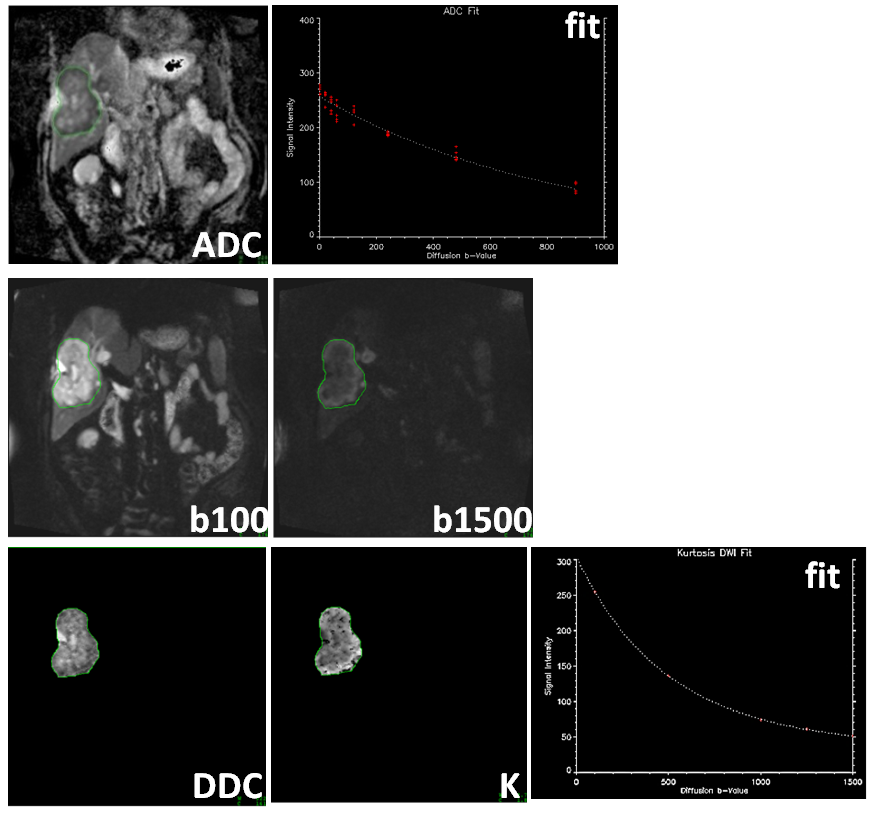
Regions of interest (ROIs) of the entire chosen target lesion were drawn on high-b-value images (b900) by a radiologist for all pre/post-treatment DWI data and pixel-wise analysis was performed for each tumour. Only the central slice ROI was analysed in the case of DKI data (matched to the DWI data). The ADC was calculated from all 8 b-values assuming the classical mono-exponential fitting algorithm4 without any further post-processing. The DKI data were modelled as described in Jansen2 using a Markov Chain Monte Carlo (MCMC) method in combination with an initial data elimination algorithm (median)5 yielding kurtosis (K) and diffusion (DDC) estimates. All fitting was performed on unregistered data using in-house software (ADEPT).
Median values of ADC, K, and DDC were reported for every patient at each visit. Treatment effects were assessed using paired t-tests (MATLAB 2016a).
RESULTS AND DISCUSSION
A typical example of good DWI/DKI data quality is presented in Figure 1.
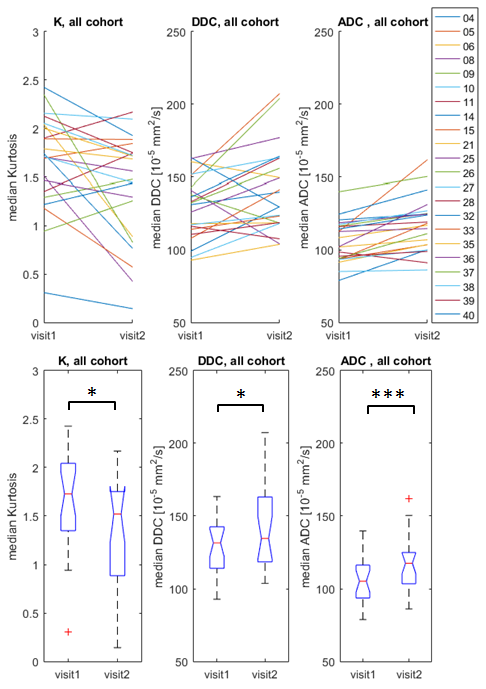
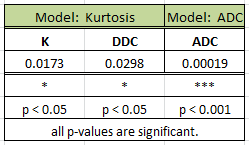
The cohort median values show a slight increase post-treatment for ADC (from 105.3 to 117.7 x 10⁻⁵ mm2/s) and DDC (from 131.8 to 134.9 x 10⁻⁵ mm2/s), whilst K decreases from 1.72 to 1.52, as seen in Figure 2 via box and ladder plots. The observed cohort changes are statistically significant for all parameters: p<0.05 for K, also p<0.05 for DDC and p<0.001 for ADC, respectively. The p-values of the paired t-tests are summarized in Table 2.
A limitation of the present study is that the data were not registered, and further work is needed to compare these results after data registration. Nevertheless, the use of the data elimination algorithm ensures increased robustness of our results.
Overall, the statistical significance of these results suggests that kurtosis data may provide information in addition to the mono-exponential ADC model. Note that the observed results were obtained in the context of a new trial testing an anti-angiogenic drug, where the drug impact on DWI is expected to be relatively weak at 15 days post treatment.
CONCLUSION
Our pilot results demonstrate a significant early cohort change to treatment of the ADC parameter in the context of a clinical trial investigating liver metastases. In addition, significant non-Gaussian diffusion behaviour was also observed, which is being analysed according to response categorisation.Acknowledgements
CRUK and EPSRC support to the Cancer Imaging Centre at ICR and RMH in association with MRC & Dept of Health C1060/A10334, C1060/A16464 and NHS funding to the NIHR Biomedical Research Centre and the Clinical Research Facility in Imaging.References
1. Koh DM and Collins DJ, Diffusion-weighted MRI in the body: applications and challenges in oncology. AJR Am J Roentgenol. 2007; 188(6):1622-35.
2. Jansen JFA, Stambuk HE, Koutcher JA et al. Non-Gaussian Analysis of Diffusion-Weighted MR Imaging in Head and Neck Squamous Cell Carcinoma: A Feasibility Study. Am J Neuroradiol 2010; 31:741-748.
3. Rosenkrantz AB, Sigmund EE, Winnick A et al., Assessment of hepatocellular carcinoma using apparent diffusion coefficient and diffusion kurtosis indices: preliminary experience in fresh liver explants. Mag Res Imag. 2012, 30(10):1534-1540.
4. Stejskal, E. O. and Tanner, J. E., Spin Diffusion Measurements: Spin Echoes in the Presence of a Time-Dependent Field Gradient. J Chem Phys, 1965; 42, 288-292.
5. Jerome NP, Orton MR, d’Arcy JA, et al. Use of the temporal median and trimmed mean mitigates effects of respiratory motion in multiple-acquisition abdominal diffusion imaging. Phys Med Biol. 2015; 60(2): N9-20. doi: 10.1088/0031-9155/60/2/N9.
Figures