4360
Value of Tumor Stiffness Measured with MR Elastography for Assessment of Response of Hepatocellular Carcinoma to Locoregional Therapy1Translational and Molecular Imaging Institute, Icahn School of Medicine at Mount Sinai, New York, NY, United States, 2Institute of Diagnostic and Interventional Radiology, University Hospital Zurich, Zurich, Switzerland, 3Department of Radiology, Icahn School of Medicine at Mount Sinai, New York, NY, United States, 4Department of Radiology, Mayo Clinic, Rochester, MN, United States
Synopsis
We correlated tumor stiffness (TS) measured with MR elastography (MRE) to degree of tumor enhancement and necrosis on contrast-enhanced T1-weighted imaging (CE-T1WI) in hepatocellular carcinomas (HCC) treated with locoregional therapy. Patients with HCC who underwent locoregional treatment and controls with newly diagnosed untreated HCC were included. TS values were obtained by placing regions of interest (ROIs) over HCCs on stiffness maps. Visual assessment of tumor necrosis on subtraction images and calculation of enhancement ratios by placing ROIs over tumors on CE-T1WI was performed. TS measured with MRE showed a significant correlation with tumor enhancement and necrosis.
Purpose: To correlate tumor stiffness (TS) measured with MR elastography (MRE) to degree of tumor enhancement and necrosis on contrast-enhanced T1-weighted imaging (CE-T1WI) in hepatocellular carcinomas (HCC) treated with locoregional therapy including 90Yttrium radioembolization (RE) or transarterial chemoembolization plus radiofrequency ablation (TACE/RFA).
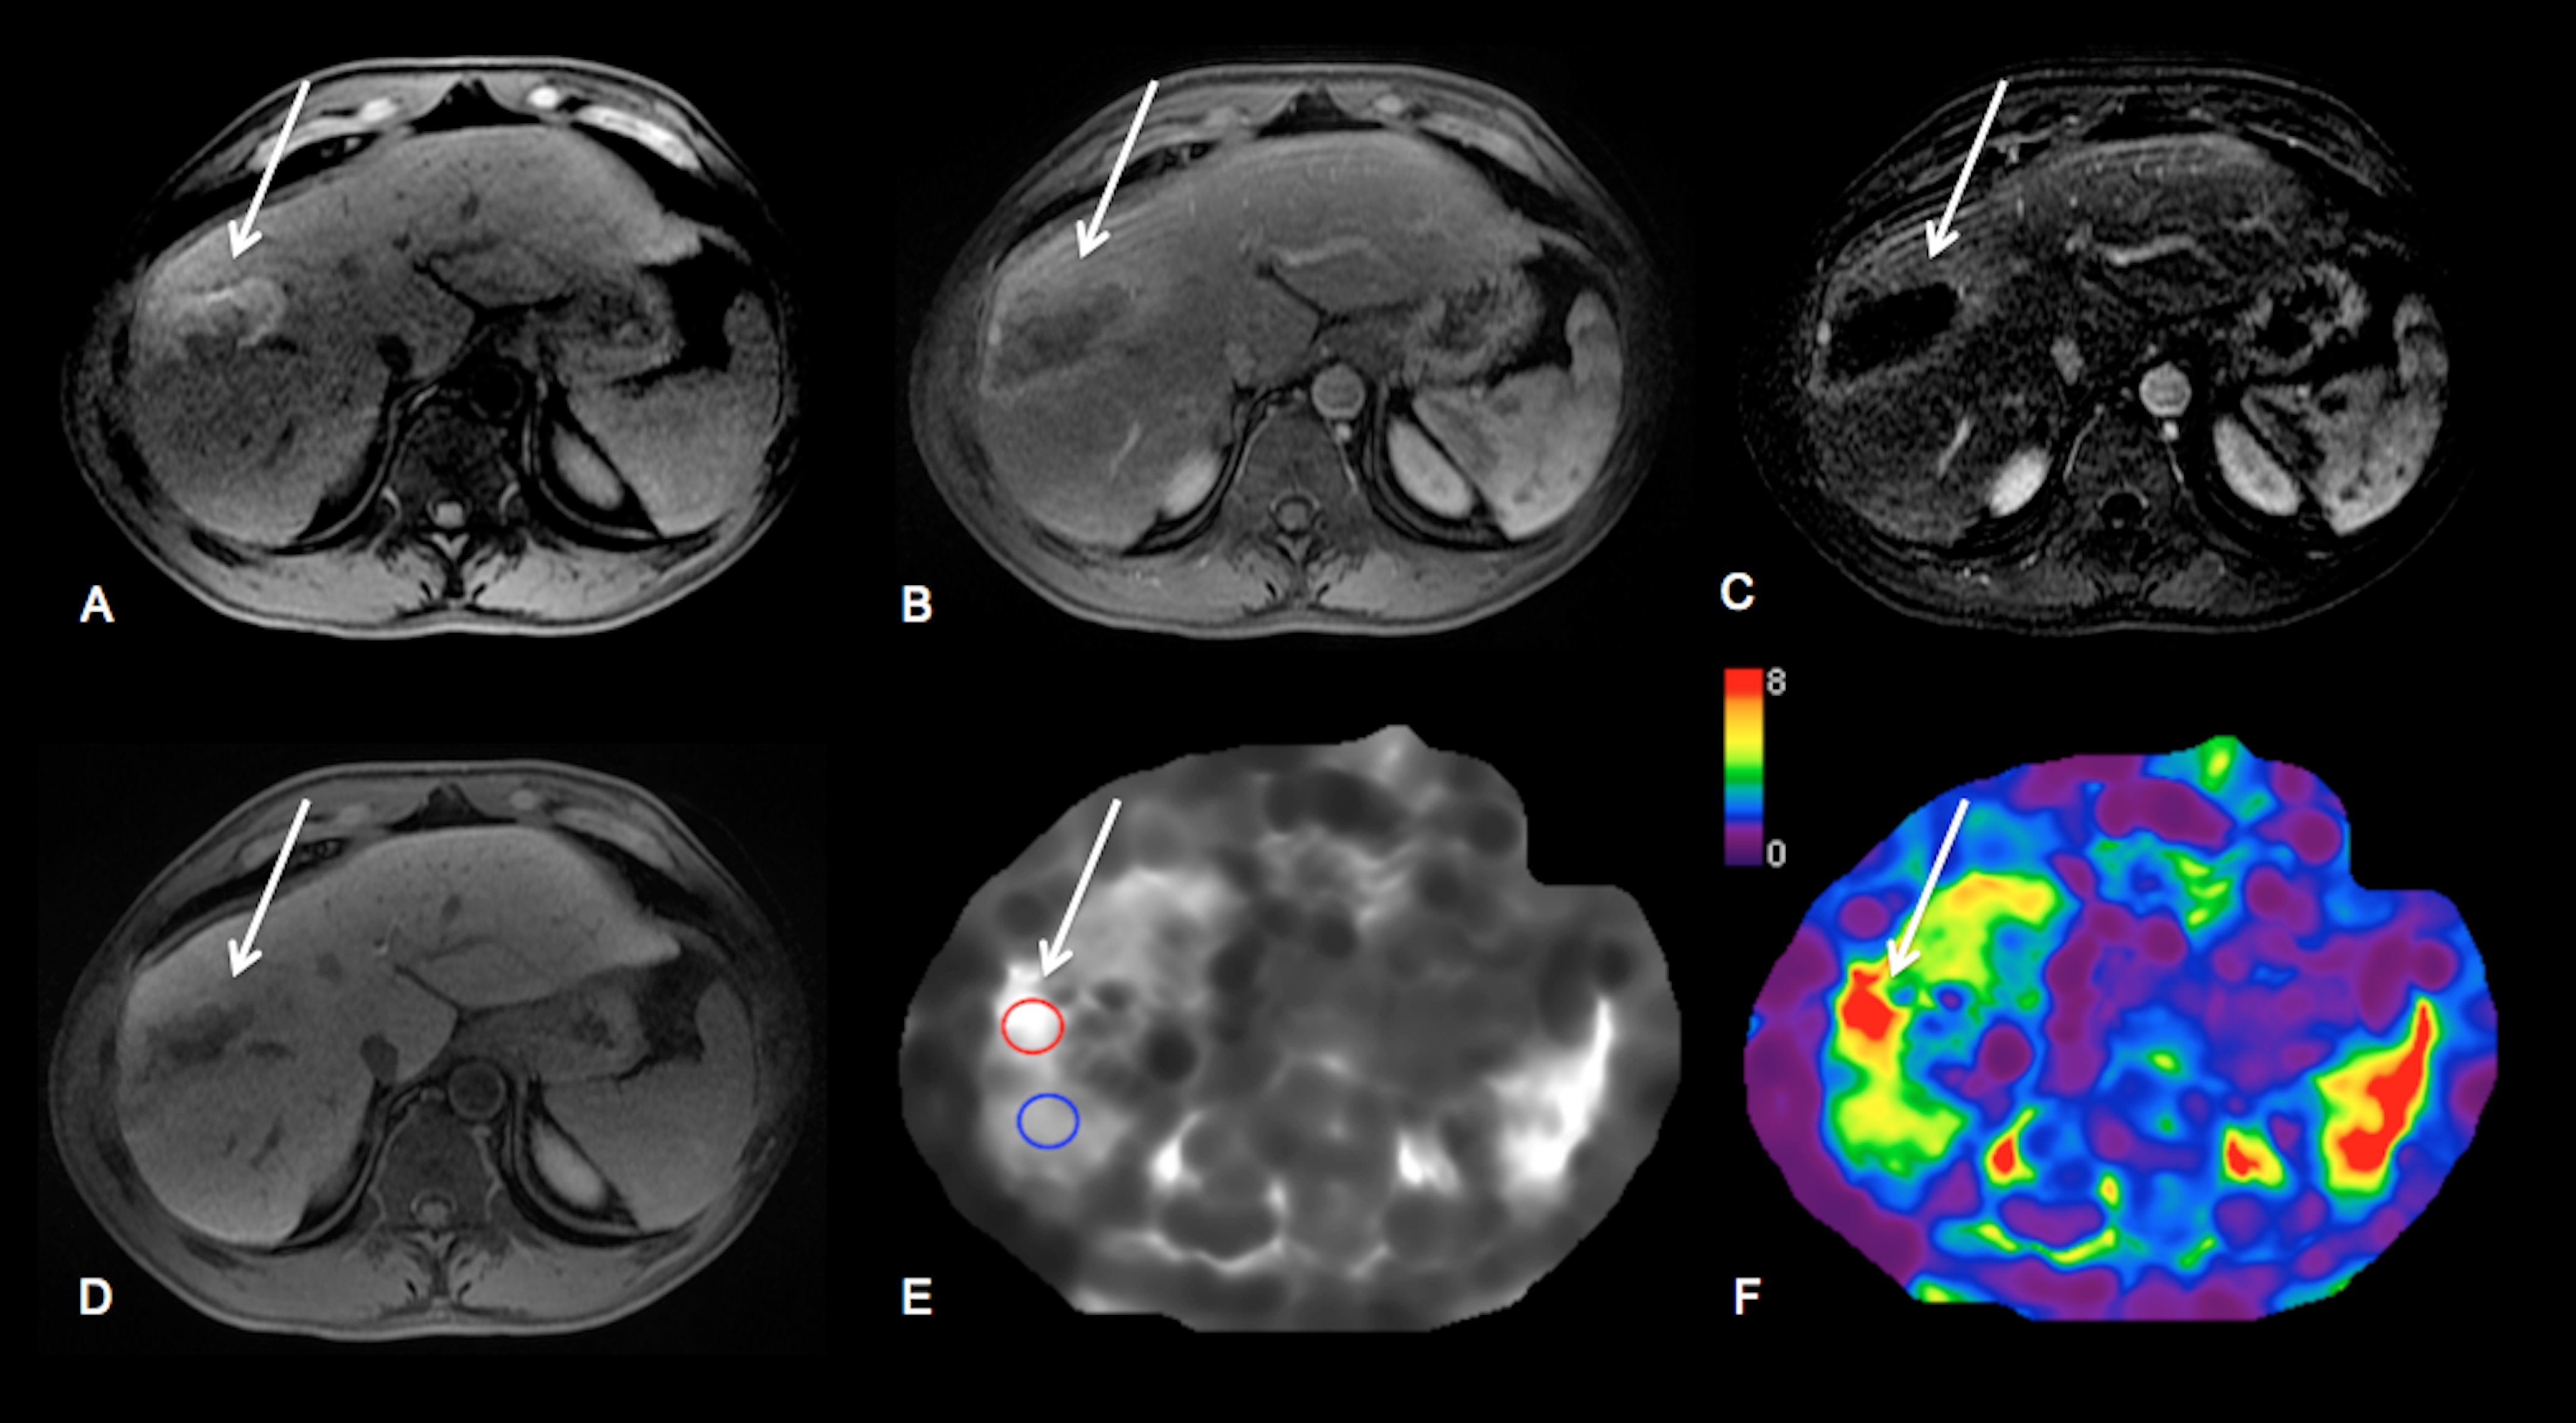
Methods: 52 patients (M/F 38/14, mean age 67 y) with HCC who underwent RE (n=22) or TACE/RFA (n=30) and 11 controls (M/F 6/5, mean age 64 y) with newly diagnosed untreated HCC were included in this study. Imaging was performed with different state-of-the-art systems equipped with MRE: 3T GE 750 (n=43), 1.5T GE Signa (n=12) or 1.5 T Siemens Aera (n=8). Routine liver MRI protocol included non-fat suppressed axial and coronal single-shot fast spin-echo T2WI (HASTE/SSFSE), axial fat suppressed fast spin echo (FSE) T2WI, T1WI in- and out-of- phase, diffusion-weighted imaging and dynamic CE-T1WI including subtracted images. Liver MRE was performed after contrast administration between 10-20 min T1W hepatobiliary phase acquisition1 using a 2D GRE sequence, with equivalent parameters between systems. For MRE wave generation, a 19-cm-diameter passive acoustic driver was placed on the right side of the abdomen at the level of the xiphoid. Four axial slices were centered over the portal vein using SSFSE axial and coronal sequences for guidance. Wave propagation was captured using a modified phase contrast gradient echo sequence with motion encoding gradient (MEGs) along the slice-select axis. The following sequence parameters were used for the GE systems: slice thickness 10 mm, matrix 256 x 80, TR/TE 50/20, mechanical motion frequency 60 Hz (power 50%), MEG 60 Hz, ASSET factor of 2, acquisition time 14 seconds/slice (56 seconds); 4 breath-holds with end expiration. For the Siemens system the following parameters were used: slice thickness 7 mm, matrix 256 x 90, TR/TE 50/25, mechanical motion frequency 60 Hz (power 50%), MEG 60 Hz, GRAPPA factor 3, acquisition time 14 seconds/slice (56 seconds); 4 breath-holds with end expiration. It has been shown that the reproducibility between platforms is excellent when using 2D GRE 2,3. The multi-model direct inversion algorithm 4,5, a statistics based direct inversion algorithm, automatically generated stiffness maps from wave images. The confidence index (ranging from 0-100%) for stiffness measurement was estimated using an algorithm reflecting SNR, wave amplitude, multi-path wave interference, and inversion algorithm performance. Stiffness measurements with confidence index >95% were considered reliable. Mean TS values were obtained by placing regions of interest (ROIs) over HCCs on stiffness maps. Visual assessment of tumor necrosis on subtraction images and calculation of enhancement ratios (ER) by placing ROIs over tumors on CE-T1WI were performed. LS (liver stiffness) was also measured. Data was analyzed using Kruskal-Wallis H test, Mann-Whitney U test, Pearson correlation and multiple regression analysis.
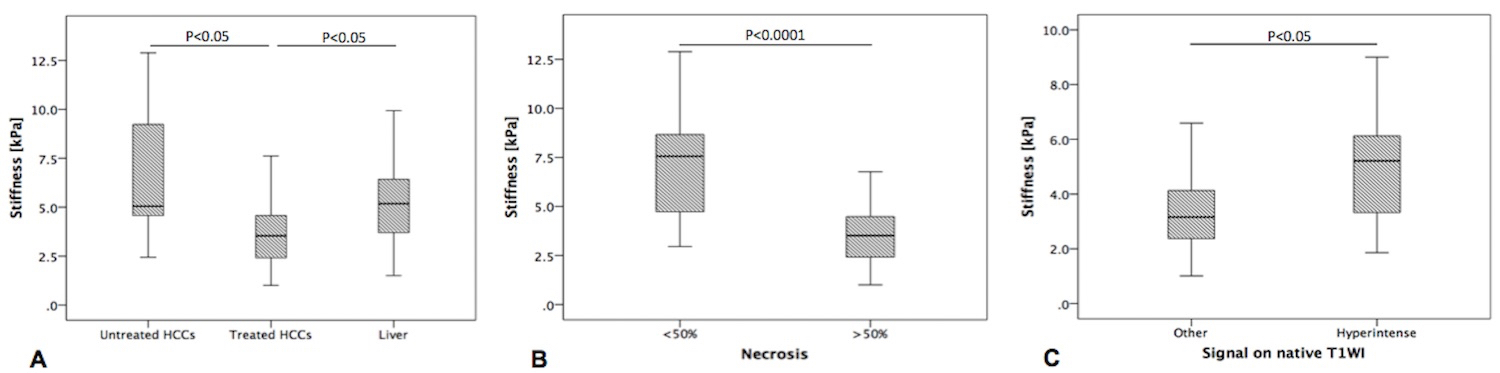
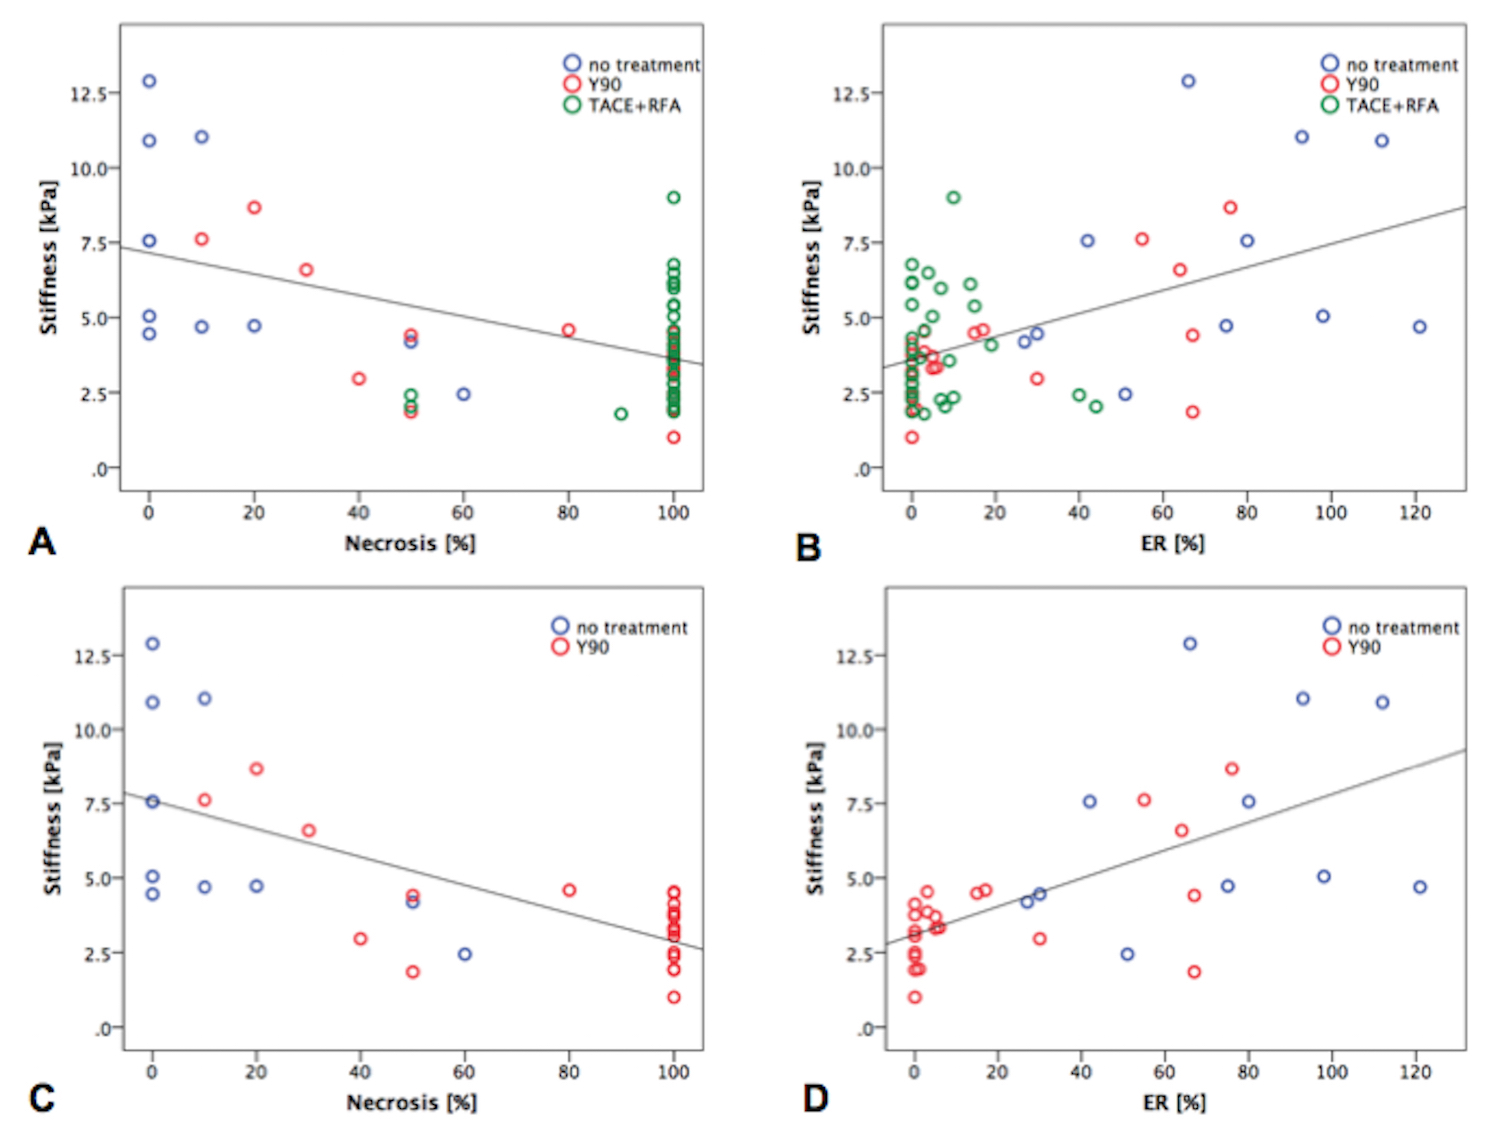
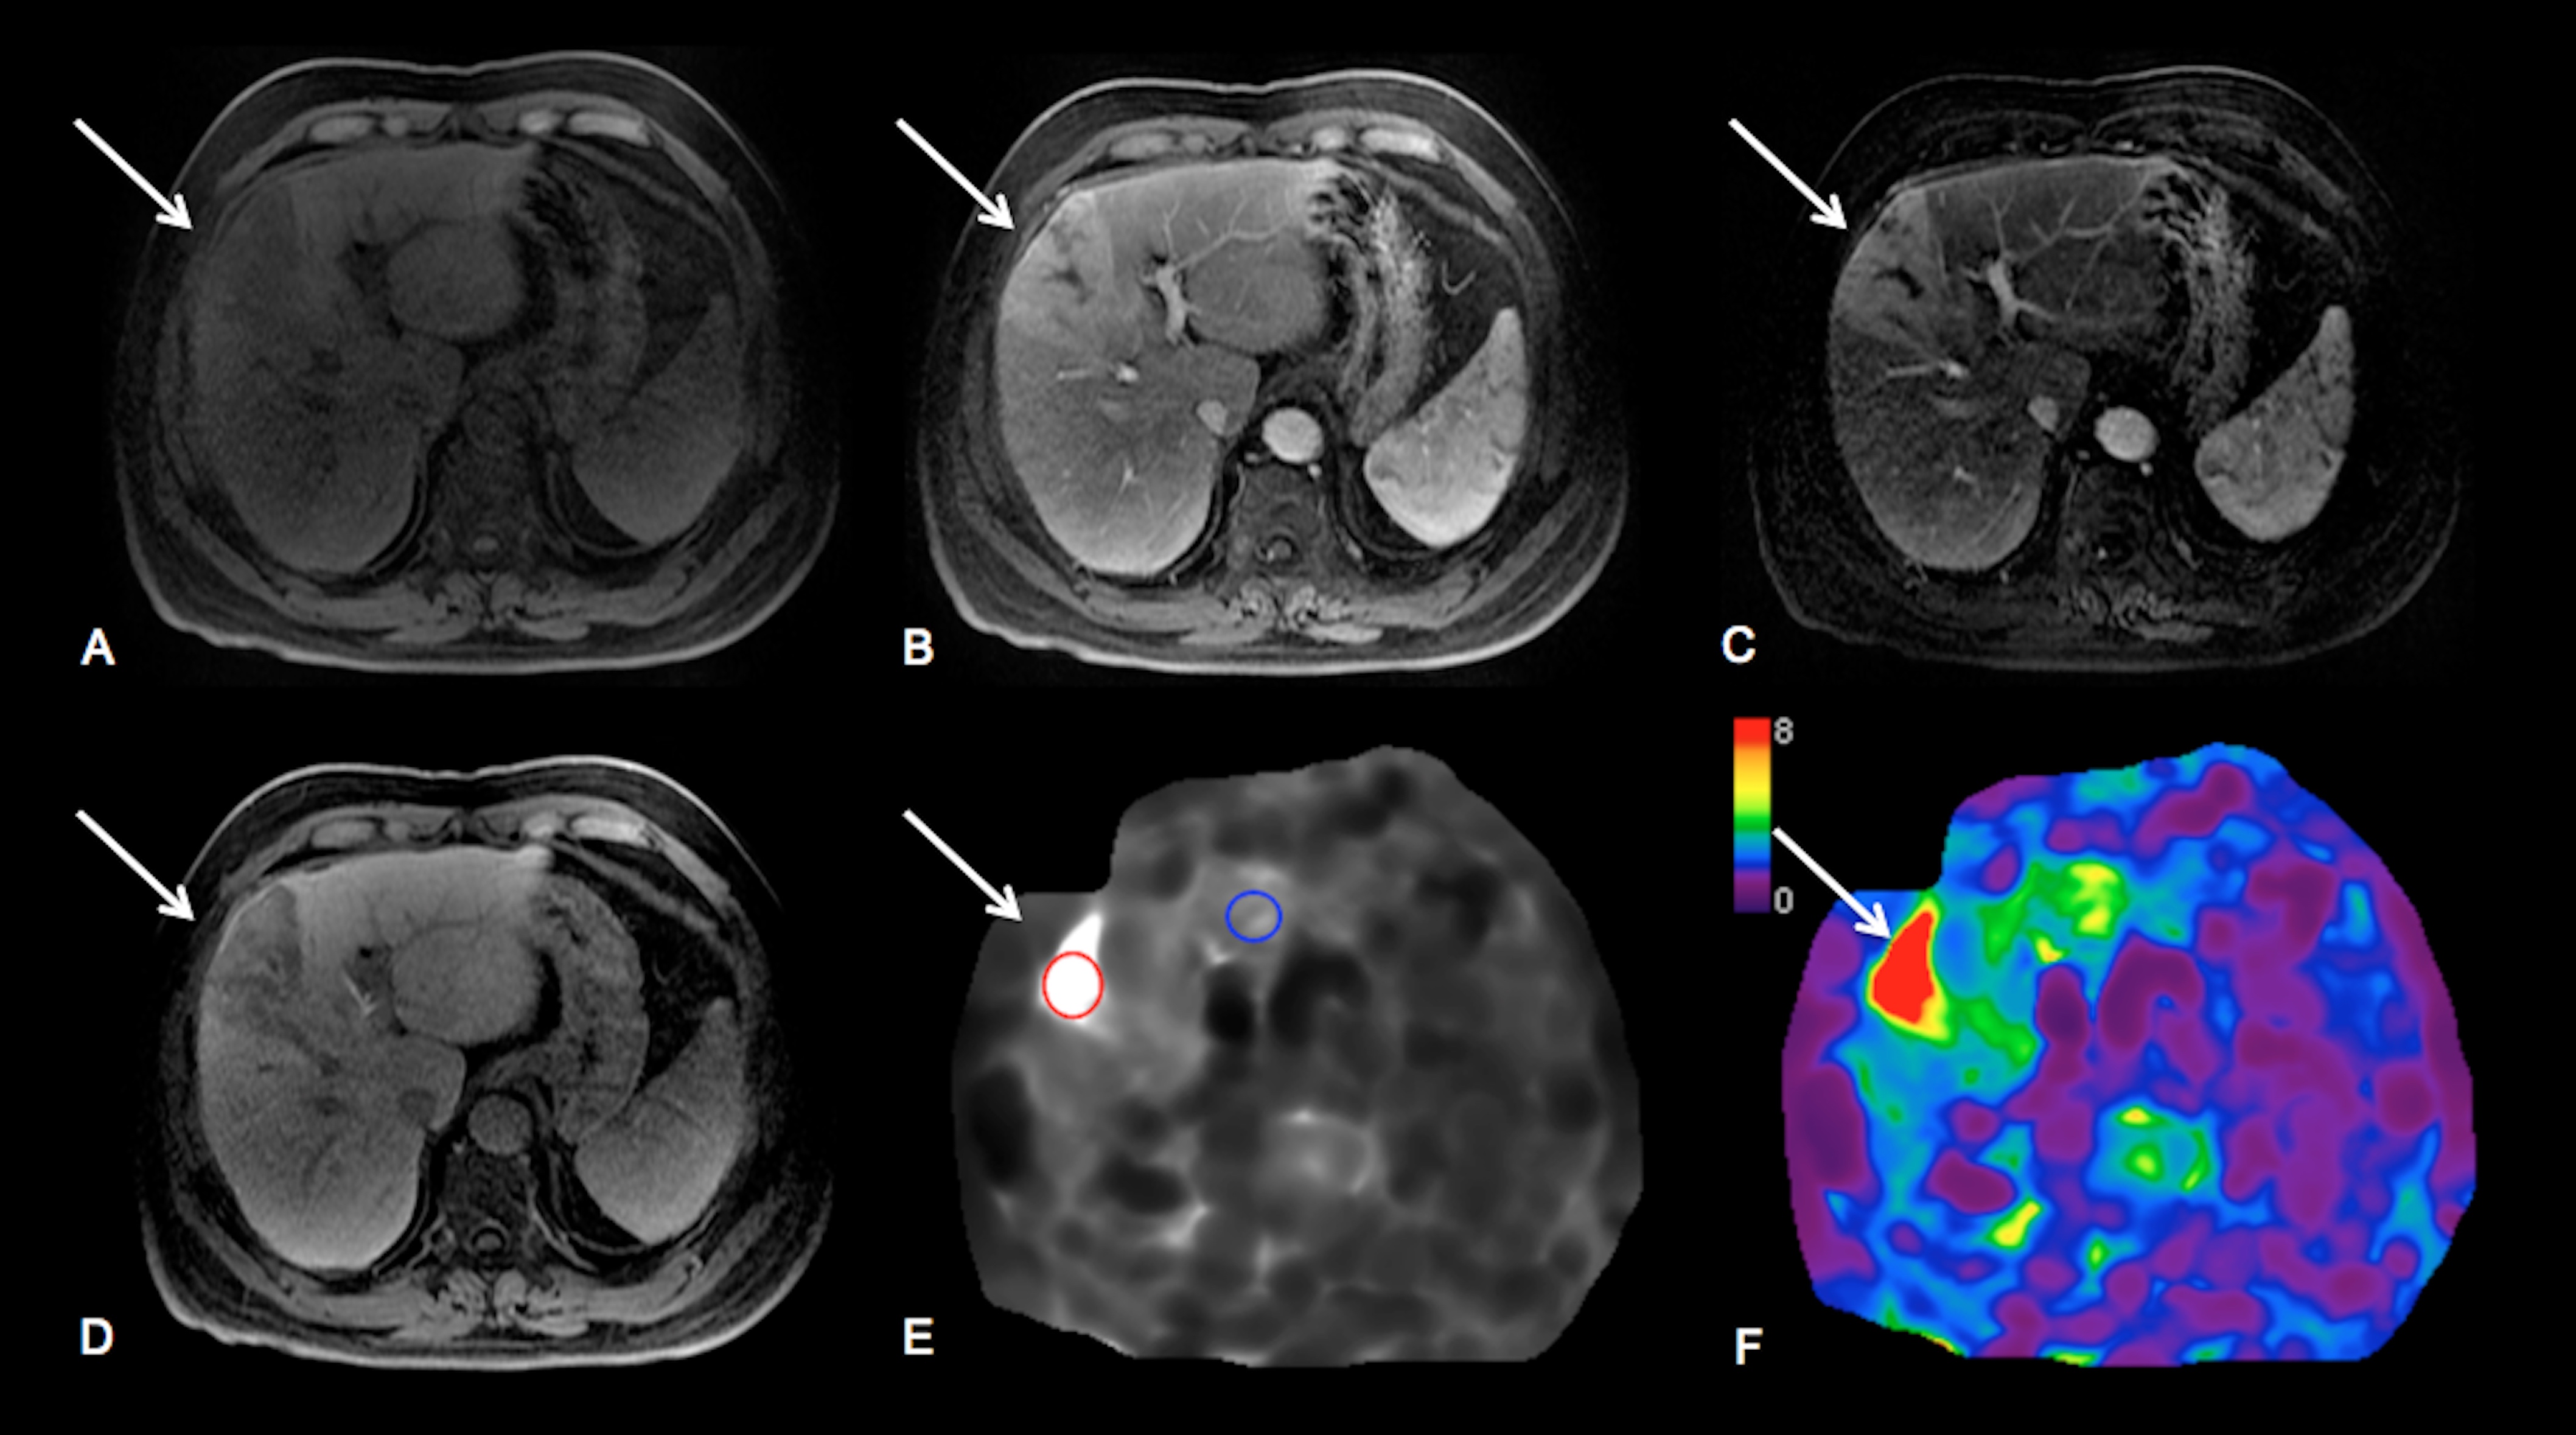
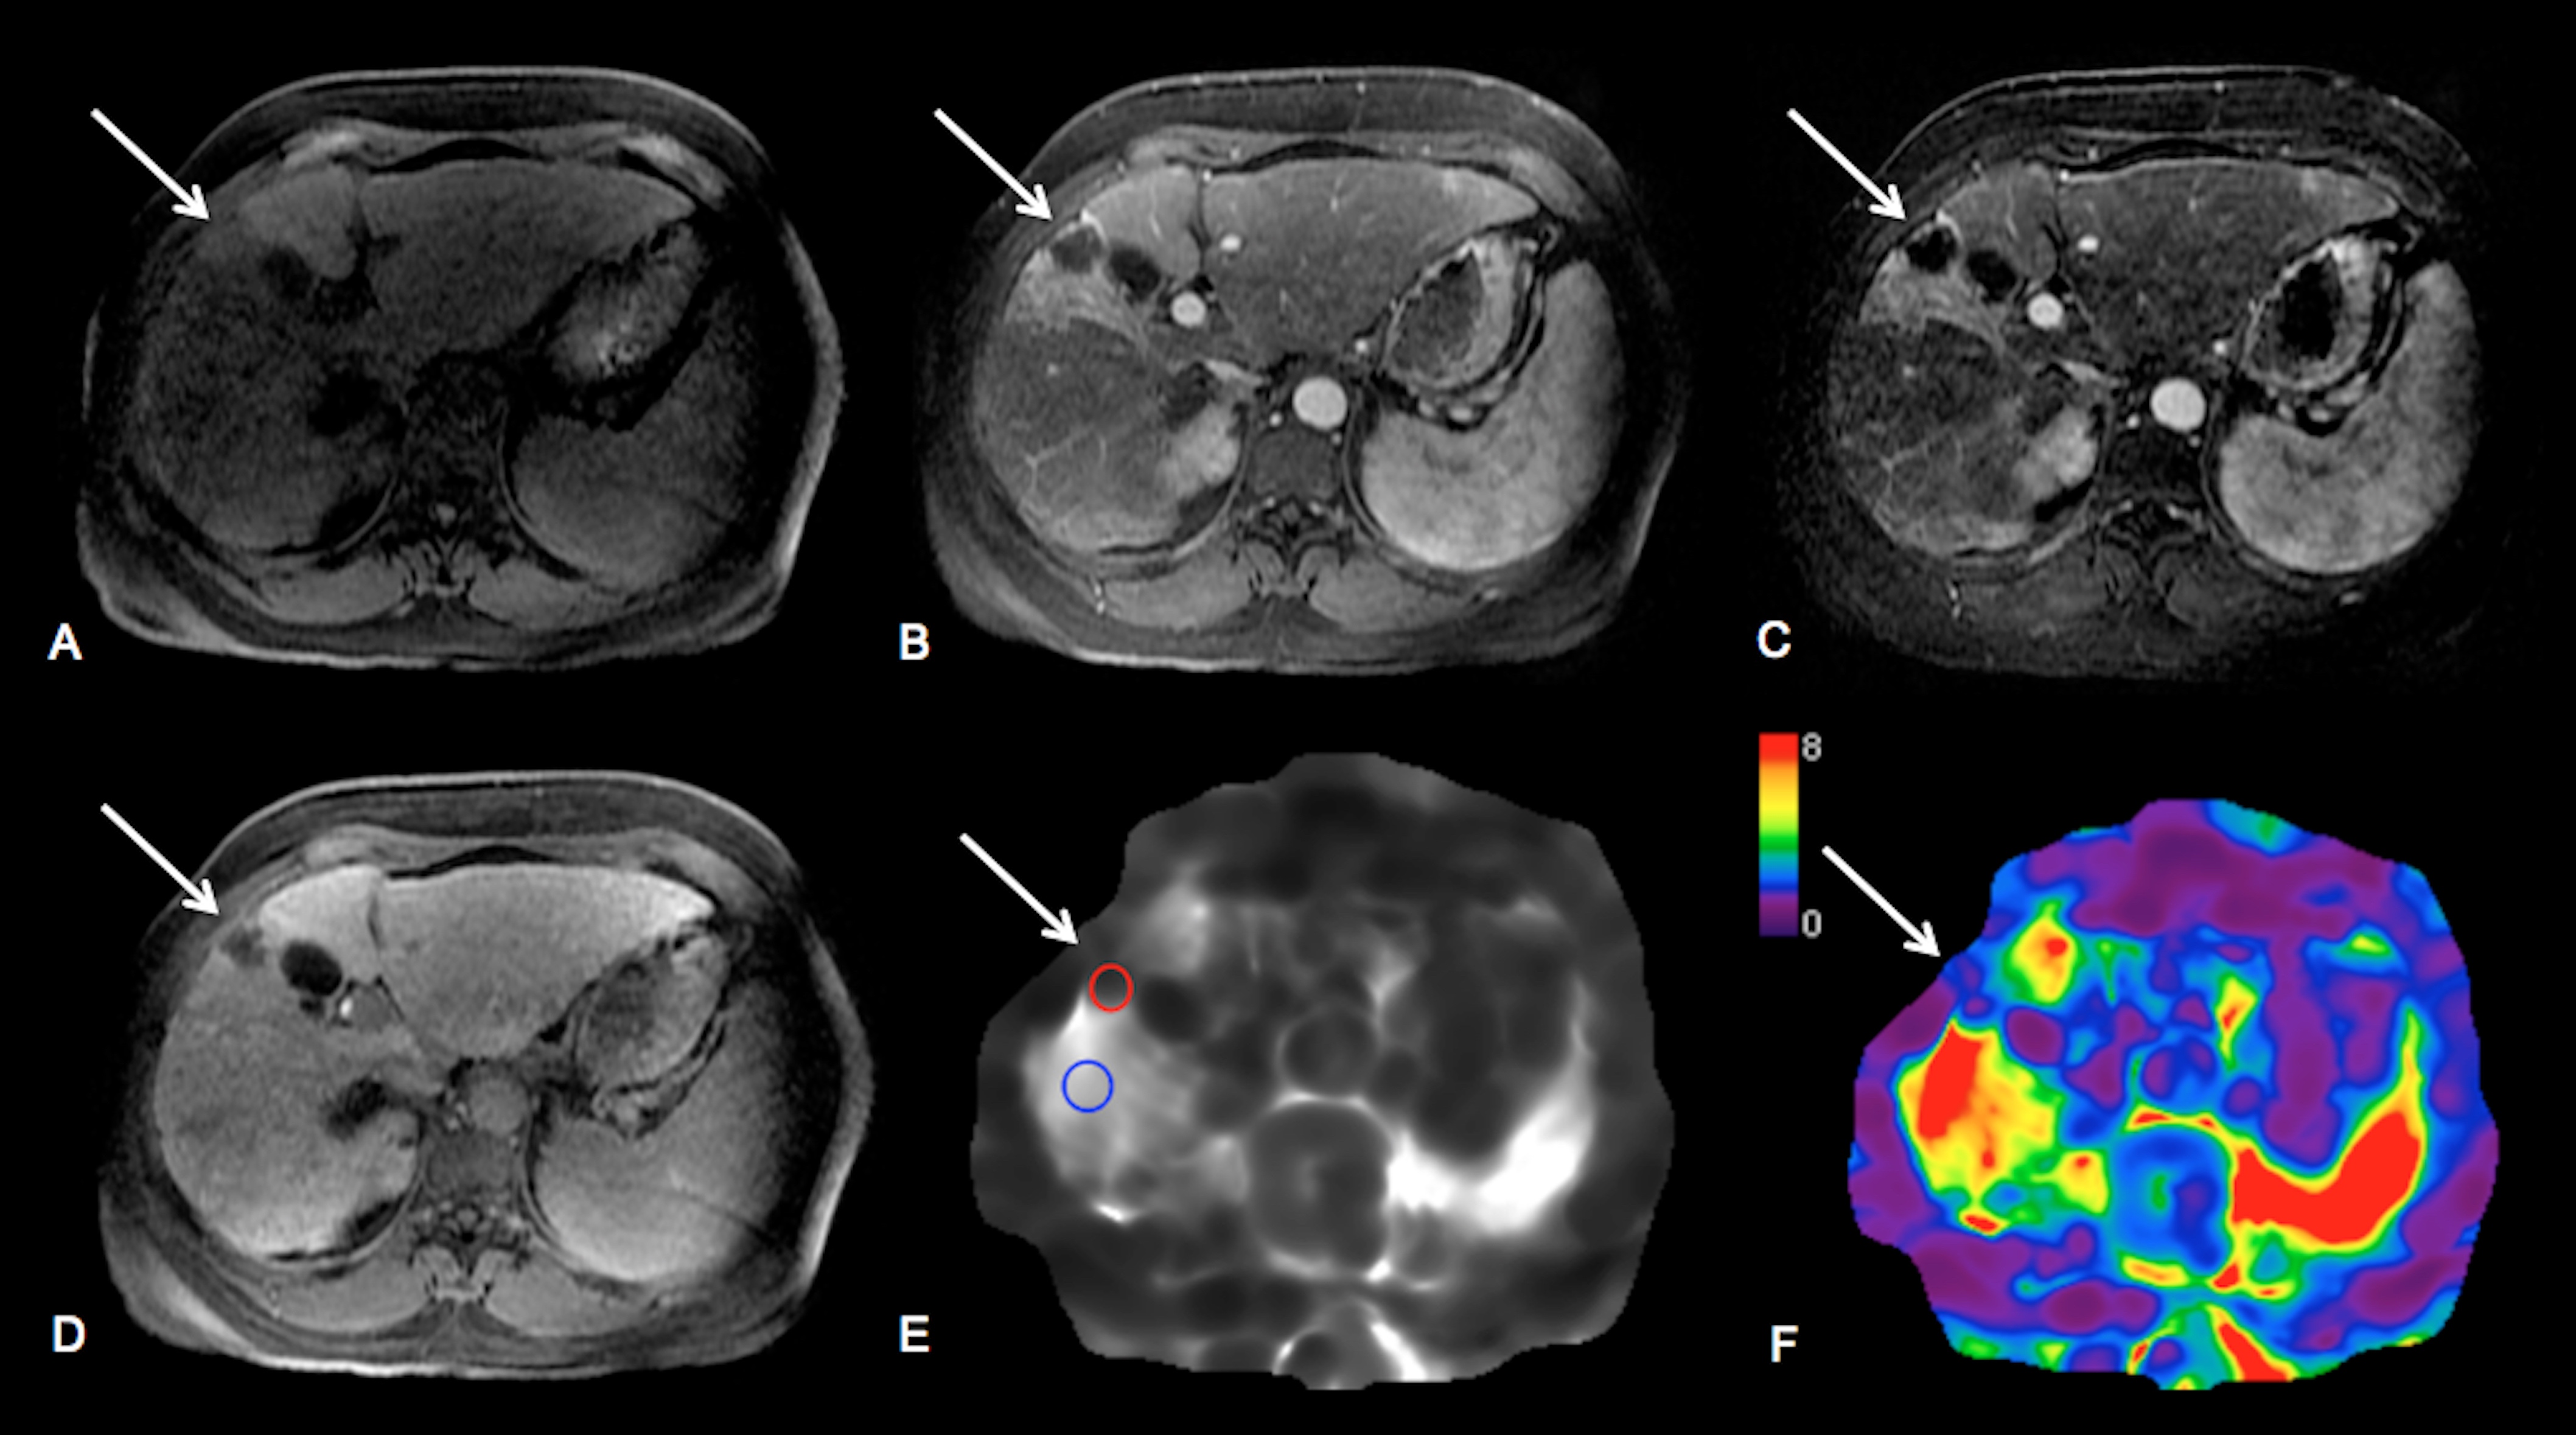
Results: 63 HCCs (mean size 3.2±1.6 cm) were evaluated. TS in treated tumors was significantly lower compared to untreated tumors (3.9±1.8 vs. 6.9±3.4 kPa, P=0.006) and also compared to LS (5.3±2.2 kPa, P=0.002) (Figure 1A, 3 and 4). TS in tumors with necrosis < 50% was significantly higher than in those with necrosis ≥ 50% (7.28 ± 3.0 vs. 3.2 ± 1.1 kPa, P < 0.0001) (Figure 1B). TS of treated hemorrhagic tumors (with a hyperintense signal on T1WI) was significantly higher compared to treated tumors which were iso, hypo- or hypointense with hyperintense rim (4.8 ± 2.0 vs. 3.6 ± 1.7 kPa, P= 0.04) (Figure 1C and 5). There were significant correlations between TS and each of percentage of necrosis (r -0.540, P=0.0001), and ER (r 0.514, P=0.0001) (Figure 2A and B). The observed correlations were stronger in the group of patients treated with RE (TS vs. necrosis, r = -0.711, TS vs. ER r = 0.636, both P=0.0001) (Figure 2C and D). Multiple regression analysis showed that percentage of necrosis and T1-signal in native T1WI were significant independent predictors of TS (P=0.0001 respectively P=0.001).
Discussion: The results of our preliminary study showed that treated tumors had significantly lower TS compared to untreated tumors and cirrhotic liver. Furthermore, intra-tumoral hemorrhage was associated with higher TS. TS was significantly correlated with visually assessed percentage of necrosis and ER. These correlations were stronger when assessing only patients treated with RE.
Conclusion: Our study shows that MRE is a feasible technique for quantitative evaluation of mechanical properties of treated HCCs, offering new parameters for tissue characterization in MRI. It can be combined with conventional MRI of the abdomen. TS measured with MRE may potentially be used as a marker of HCC treatment response to locoregional therapy, especially after RE. These results need to be verified in a prospective study.
Acknowledgements
No acknowledgement found.References
1. Motosugi U, Ichikawa T, Sou H, et al. Effects of gadoxetic acid on liver elasticity measurement by using magnetic resonance elastography. Magn Reson Imaging 2012;30(1):128-132.
2. Yasar TK, Wagner M, Bane O, et al. Interplatform reproducibility of liver and spleen stiffness measured with MR elastography. J Magn Reson Imaging 2016;43(5):1064-1072.
3. Serai SD, Yin M, Wang H, Ehman RL, Podberesky DJ. Cross-vendor validation of liver magnetic resonance elastography. Abdom Imaging 2015;40(4):789-794.
4. Manduca A, Oliphant TE, Dresner MA, et al. Magnetic resonance elastography: non-invasive mapping of tissue elasticity. Med Image Anal 2001;5(4):237-254.
5. Silva AM, Grimm RC, Glaser KJ, et al. Magnetic resonance elastography: evaluation of new inversion algorithm and quantitative analysis method. Abdom Imaging 2015;40(4):810-817.
Figures