4358
HCC treated with 90Yttrium radioembolization: can pre-treatment and 6week post-treatment volumetric ADC histogram measurements predict subsequent tumor response?1Translational and Molecular Imaging Institute, New York, NY, United States, 2Institute of Diagnostic and Interventional Radiology, University Hospital Zurich, Zurich, Switzerland, 3Radiology, Groupe Hospitalier Pitié Salpêtrière, Paris, France, 4Department of Radiology, Icahn School of Medicine at Mount Sinai, New York, NY, Switzerland
Synopsis
We evaluated the potential of volumetric ADC histogram measurements (vADC) obtained pre- and 6 weeks (6w) post-treatment for prediction of HCC response to 90Yttrium radioembolization (RE). 22 patients underwent MRI at baseline and 6w after RE using a routine liver MRI protocol including DWI. Tumor response was assessed by mRECIST at 6 months post treatment. vADC mean, median and mode obtained at 6w post-treatment were significantly different between patients with partial/complete response vs. those with stable/progressive disease, and were a significant predictor of complete tumor response at 6 months, with vADC mode performing best. Pre-treatment vADC did not have any predictive value for response.
Purpose: To assess the potential of volumetric ADC (vADC) histogram measurements obtained before and 6 weeks (6w) post-treatment for prediction of hepatocellular carcinoma (HCC) response to 90Yttrium radioembolization (RE).
Methods: In this IRB approved retrospective study, 22 patients (M/F 15/7, mean age 65y) who underwent lobar RE (right lobe n=15; left lobe n=7) were included. All patients underwent MRI pre-treatment and 6w and 6 months (6m) after RE. Liver MRI protocol included T2 HASTE, fat suppressed FSE T2, T1 in- and out-of-phase, DWI and contrast-enhanced T1WI (CE-T1WI) including subtracted images. DWI was performed using tri-directional diffusion gradients using 3 (n=24) (50, 400, and 800 s/mm2) or 4 b values (n=20) (0, 50, 400, 800 s/mm2). Two readers assessed tumor response 6m after RE in consensus. Definition of complete tumor response, partial tumor response, stable disease, and progression of HCC lesions was based on modified RECIST criteria (mRECIST) for each index tumor1. vADC histogram parameters (mean, median, mode, min, max, kurtosis and skewness) were obtained by placing regions of interest (ROIs) on the ADC map covering the whole index tumors (OsiriX, Bernex, Switzerland). One reader placed the ROIs at baseline and 6w after treatment. Data was analyzed using Mann-Whitney U test and linear regression analysis.
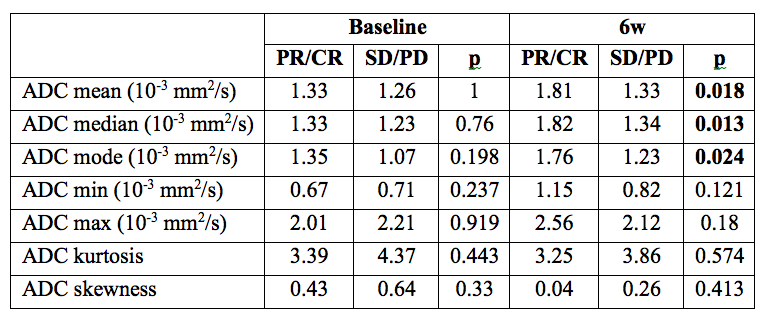
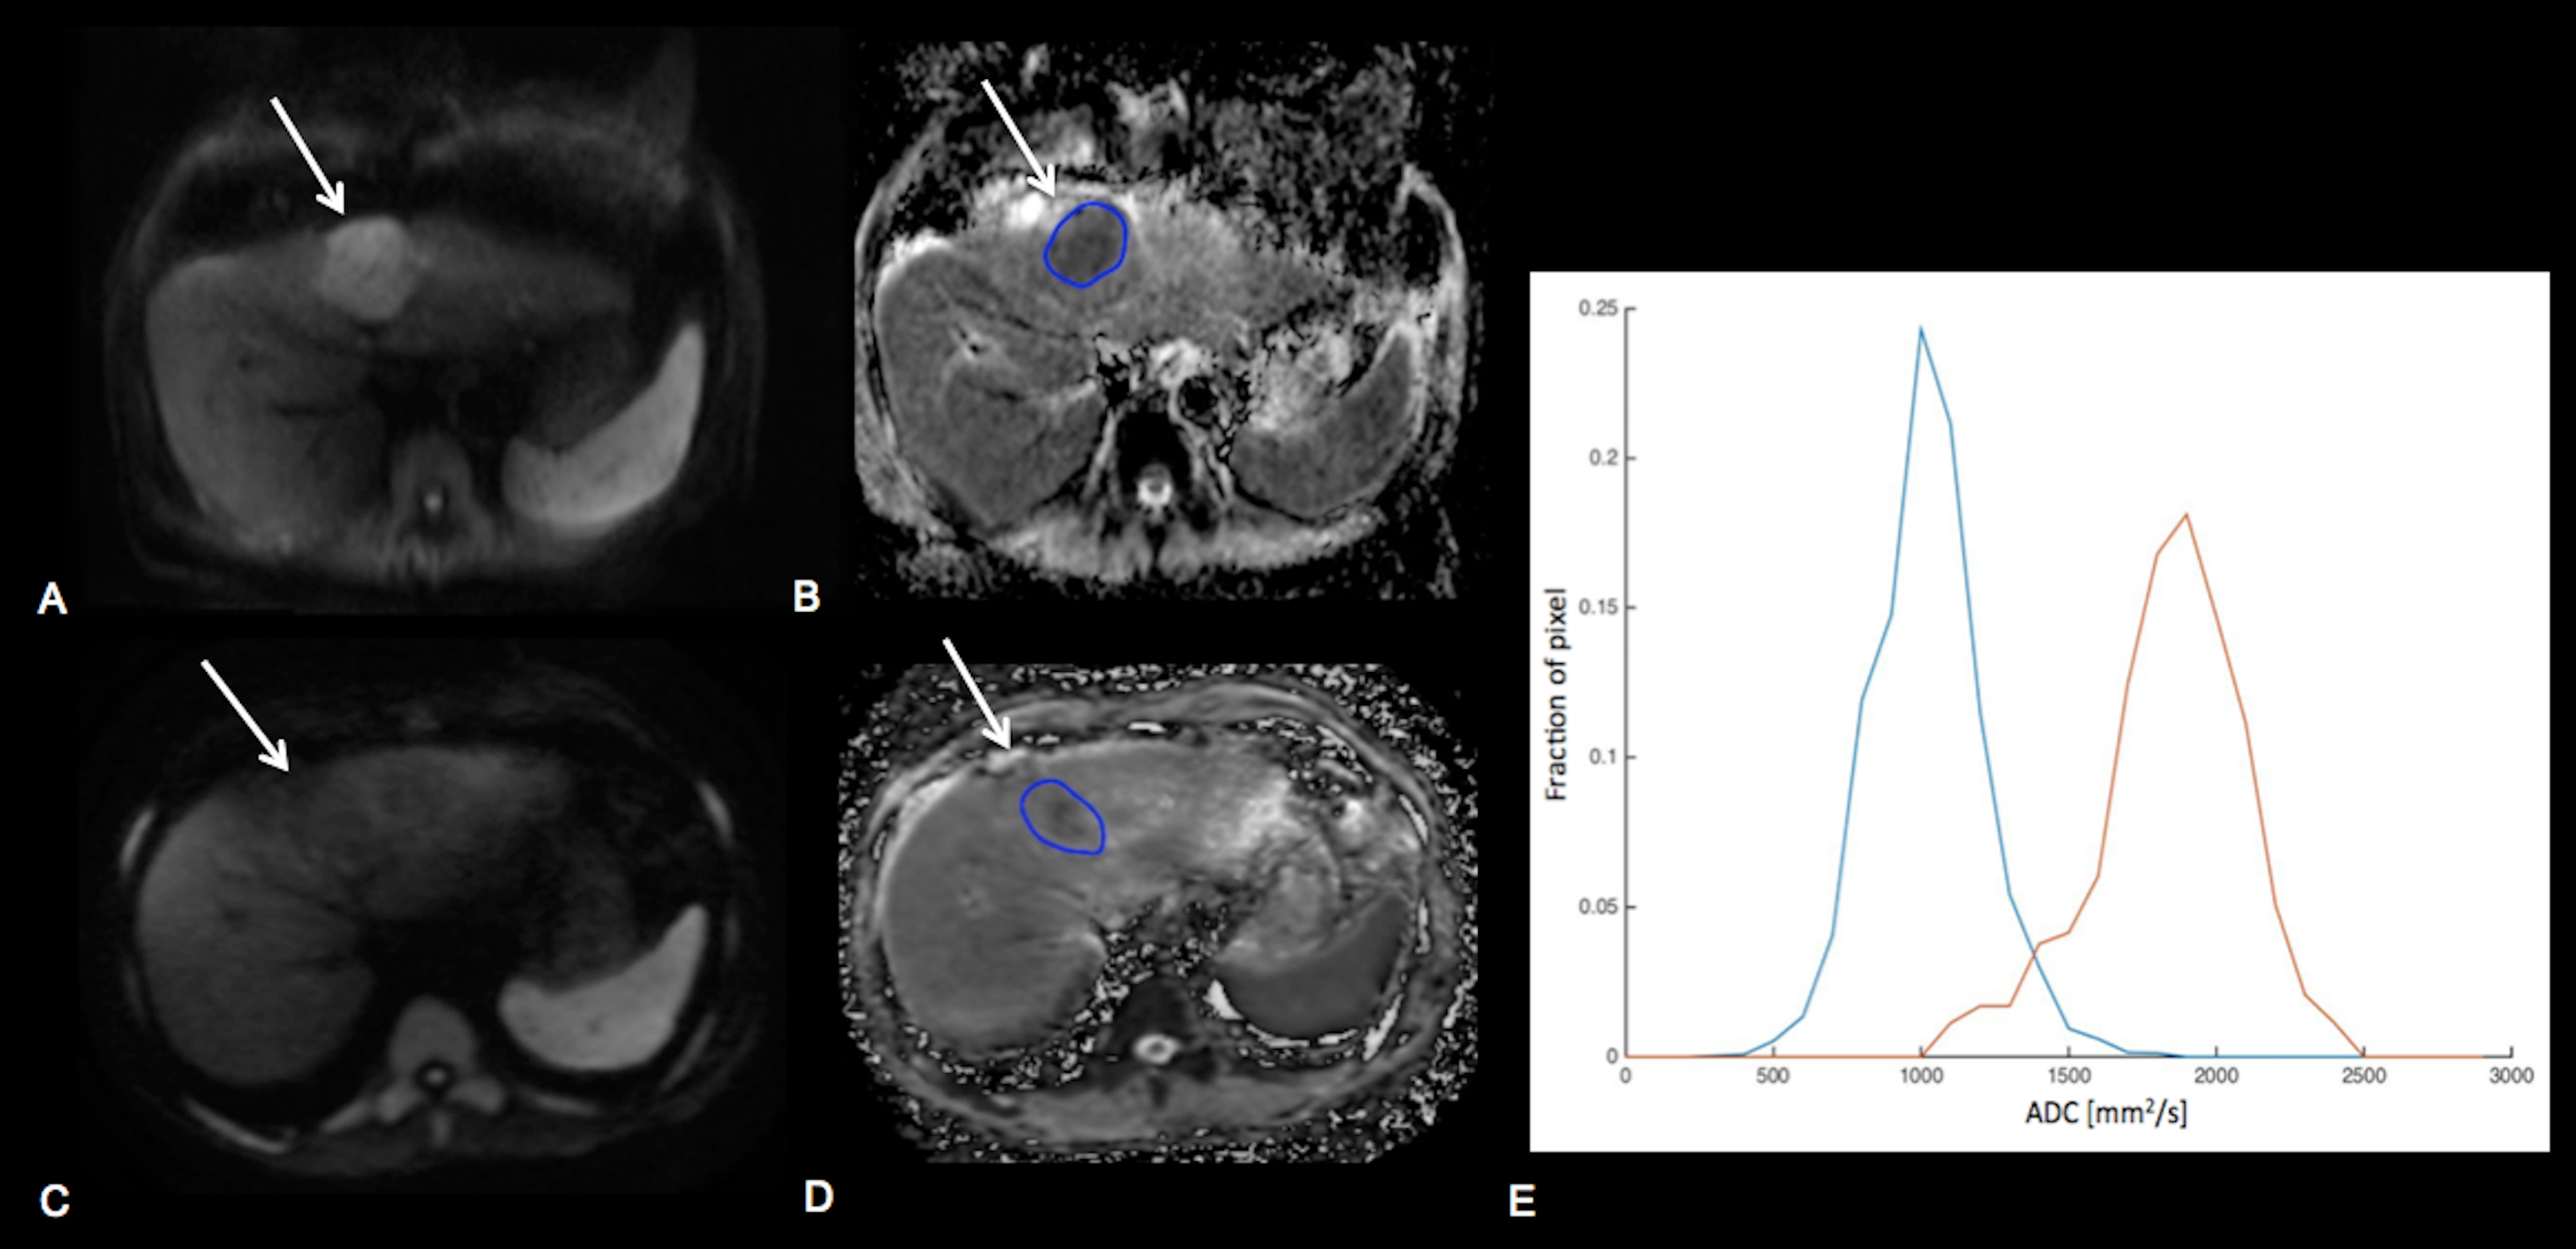
Results: 26 HCC lesions (mean size 3.4±2.4 cm) were assessed (18 patients with 1 tumor, 4 patients with 2 tumors). Response at 6m was as follows: complete response (8 tumors), partial response (3 tumors), stable disease (13 tumors) and progression (2 tumors). There was no significant difference in pre-treatment vADC parameters between patients with any response vs. those with stable disease/progression, while a significant difference was observed at 6w post- treatment for vADC mean, median and mode (Table 1, Figure 1). vADC mean, median and mode at 6w were significant predictors of any tumor response (partial/complete) with AUCs of 0.776, 0.788, and 0.764 (p=0.002-0.004) and of complete tumor response, with AUCs of 0.750, 0.757 and 0.694 (p=0.014-0.044) after RE. vADC median threshold of 1.90 x10⁻³ mm2/s at 6w had sensitivity of 63% and specificity of 100% for prediction of any tumor response, and sensitivity of 63% and specificity of 89% for prediction of complete tumor response.
Discussion and Conclusion: Imaging evaluation of HCC response to therapy is essential for diagnosing recurrent or residual disease after RE, guiding future treatment and for establishing prognosis. It has been suggested that DWI –by providing information on cell membrane integrity and cellular density- could predict tumor response2-4. In our study, vADC mean, median and mode at 6w were found to be significant predictors of subsequent response in HCC treated with RE, while pre-treatment vADC did not have any predictive value for response. vADC measurement provides information at the whole tumor level, compared to single slice approach, and enables the analysis of tumor response heterogeneity by generating histograms from ADC maps5-7. In line with our study, it has been shown that -compared to baseline- mRECIST and ADC changed significantly 1 and 3 months after RE, while complete pathological necrosis could not be predicted by mRECIST and vADC mean at baseline4. In clinical practice, a 6w follow-up imaging may help identify residual disease, guide future treatment and predict subsequent tumor response after RE.
Acknowledgements
No acknowledgement found.References
1. Lencioni R, Llovet JM. Modified RECIST (mRECIST) Assessment for Hepatocellular Carcinoma. Semin Liver Dis 2010;30(1):52-60.
2. Kamel IR, Reyes DK, Liapi E, Bluemke DA, Geschwind JFH. Functional MR imaging assessment of tumor response after Y-90 microsphere treatment in patients with unresectable hepatocellular carcinoma. J Vasc Interv Radiol 2007;18(1):49-56.
3. Rhee TK, Naik NK, Deng J, et al. Tumor response after yttrium-90 radioembolization for hepatocellular carcinoma: Comparison of diffusion-weighted functional MR imaging with anatomic MR imaging. J Vasc Interv Radiol 2008;19(8):1180-1186.
4. Vouche M, Salem R, Lewandowski RJ, Miller FH. Can volumetric ADC measurement help predict response to Y90 radioembolization in HCC? Abdom Imaging 2015;40(6):1471-1480.
5. Halappa VG, Bonekamp S, Corona-Villalobos CP, et al. Intrahepatic Cholangiocarcinoma Treated with Local-Regional Therapy: Quantitative Volumetric Apparent Diffusion Coefficient Maps for Assessment of Tumor Response. Radiology 2012;264(1):285-294.
6. Halappa VG, Corona-Villalobos CP, Bonekamp S, et al. Neuroendocrine Liver Metastasis Treated by Using Intraarterial Therapy: Volumetric Functional Imaging Biomarkers of Early Tumor Response and Survival. Radiology 2013;266(2):502-513.
7. Li Z, Bonekamp S, Halappa VG, et al. Islet Cell Liver Metastases: Assessment of Volumetric Early Response with Functional MR Imaging after Transarterial Chemoembolization. Radiology 2012;264(1):97-109.
Figures