4357
Anatomical sites’ dependency of 3.0 T whole-body MRI’s signal fat fraction and apparent diffusion coefficient in multiple myeloma focal lesions1University College London, London, United Kingdom, 2University College London Hospital, United Kingdom
Synopsis
The increasing utility of MRI's quantitative imaging biomarkers for disease characterisation and response monitoring necessitates a better understanding of underlying pathophysiological changes.
This might be more pertinent when heterogeneous organ such as skeletal system is being investigated. In this work, we carry out a study into the heterogeneity of multiple myeloma's focal lesions on the basis of the various anatomical locations in skeleton.
Background:
Multiple myeloma (MM) is heterogeneous primary bone cancer that tends to involve the entire skeleton. Whole-body MRI (WB-MRI) is advocated as the imaging of choice for initial assessment of MM [1]. Furthermore, previous work has shown the utility of apparent diffusion coefficient (ADC) and signal fat fraction (sFF), measured across the entire volume of skeleton [2] or focal lesions (FLs)[3], for response monitoring in MM. However, the heterogeneity that exists across different anatomical locations of the skeleton (due to embryological, structural and functional variability across skeleton), might affect the way that various involved bony sites behave following involvement by MM and the subsequent chemotherapy. The aim of this work is to investigate the effect of anatomical location on FL’s ADC and sFF measurement at diagnosis and following chemotherapy.Material and methods
Twenty-one patients (13 male, median age 52 (range 36-69)) with biopsy proven symptomatic MM were enrolled prospectively. WB-MRI was performed on a 3.0T scanner at baseline and following two cycles of chemotherapy. T2 weighted imaging (T2-TSE) and axial DWI-MRI (4 b-values 0,100, 300, 1000) were supplemented by pre- and post-contrast coronal 2-point mDixon imaging, covering head to toe (Table 1). For each patient, up to 20 FLs were localised for analysis by 2 radiologists in consensus, who prospectively scored (0 - non-diagnostic quality images; 1=unlikely, 2=indeterminate, 3=likely and 4=highly likely disease) involvement of pre-defined anatomical regions. For skeletal sites frequently involved by MM (pelvis, femur, spine and chest wall), a maximum of 4 largest FLs > 5mm and scored 3/4 were selected for analysis. A matched region of interest (ROI) was contoured for each FL on pre-contrast water only and pre-contrast fat only mDixon images as well as b1000 DWI images. sFF was derived from ROI average signal intensity (SI) by: SIfat/SIPre-contrast-Water + SIfat [4]. The ROI on b1000 DWI were transferred to b0, b100 and b300 and ADC was calculated by mono-exponential curve fitting of average SIs of all 4 b-values from DWI [5]. Disease response was assessed by international myeloma working group (IMWG) criteria after termination of induction therapy and patients were assigned to responder and non-responder groups [6]. For baseline imaging, the selected FLs for each patient were grouped together based on the anatomical locations (pelvis, femur, spine and chest wall). For post-treatment changes, only the FLs in responding patients were evaluated. The differences for ADC and sFF between four anatomical locations at baseline were assessed by one-way Anova. Temporal changes of FL’s in each anatomical location following treatment were assessed by Wilcoxon signed-matched test. Finally, percentage changes of ADC and sFF values between four anatomical locations were assessed by one-way Anova.Results:
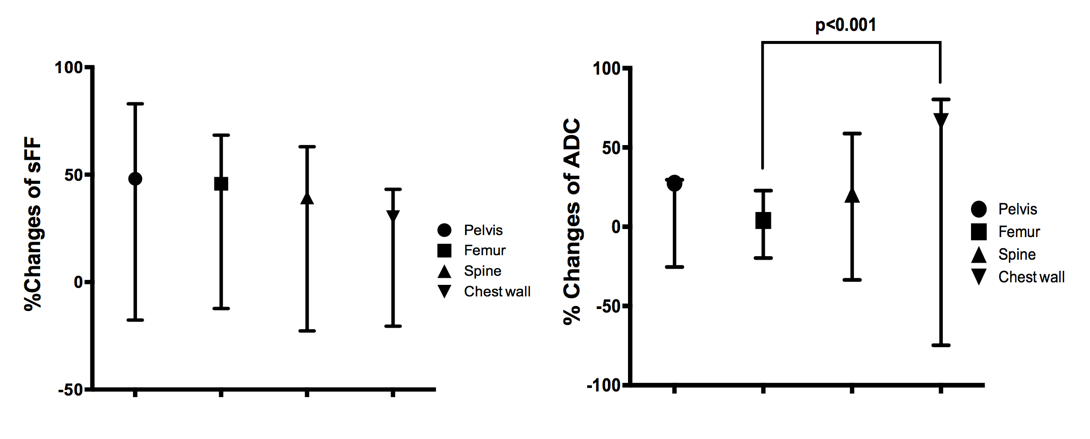
There were 15 responders and 6 non-responders after induction chemotherapy. The total number of FLs evaluated at baseline in the entire cohort (n=21) were 205. Subsequently, 152 FLs in 15 responding patients were evaluated for temporal changes of FL’s ADC and sFF. Baseline comparison of ADC and sFF for pelvic, femoral, spinal and chest wall FLs are shown in Figure 1. The sFF was significantly higher for femoral FLs compared to other anatomical locations. The temporal changes of sFF and ADC for each anatomical location are tabulated in Table 2 and 3, respectively. Finally, the comparison of percentage changes of ADC and sFF at each anatomical location are shown in Figure 2. There was a significant difference between percentage changes of chest wall FL’s ADC compared to that of femoral FLs. No significant differences were observed for percentage changes of FL’s sFF between different sites.Discussion and Conclusion:
Despite being widely considered as the imaging of choice for initial assessment of MM, currently there is no consensus on post-treatment evaluation of disease using WB-MRI’s imaging biomarkers. In the current work, we investigate the heterogeneity that exists across different anatomical locations in skeleton at baseline and following treatment. Such variations might prove important when novel quantitative MRI biomarkers are evaluated as a response assessment tool and care should be taken when interpreting the temporal changes of lesions in different anatomical locations in MM patients.Acknowledgements
No acknowledgement found.References
[1] National Institute for Health and Care Excellence (NICE) guideline, recommendation on imaging investigation. https://www.nice.org.uk/guidance/ng35/chapter/recommendations#imaging-investigations
[2] Giles SL, Messiou C, Collins DJ, et al. Whole-Body Diffusion-weighted MR Imaging for Assessment of Treatment Response in Myeloma. Radiology 2014; 271(3):785-794.
[3] Latifoltojar A, Hall-Craggs M, Rabin, et al. Whole Body Magnetic Resonance Imaging in newly diagnosed multiple myeloma: Early changes in lesional signal fat fraction predict disease response. Br J Haematol 2016. doi: 10.1111/bjh.14401. [Epub ahead of print]
[4] Messiou C, Giles S, Collins DJ, et al. Assessing response of myeloma bone disease with diffusion-weighted MRI. Br J Radiol 2012;85(1020): e1198–1203.
[5] Punwani S, Taylor S.A, Saad Z, et al. Diffusion-weighted MRI of lymphoma: prognostic utility and implications for PET/MRI? Eur J Nucl Med Mol Imaging 2013;40(3):373-385.
[6] Durie BGM, Harousseau JL, Miguel JS, et al. International uniform response criteria for multiple myeloma. Leukemia 2006; 20(9); 1467-147.
Figures
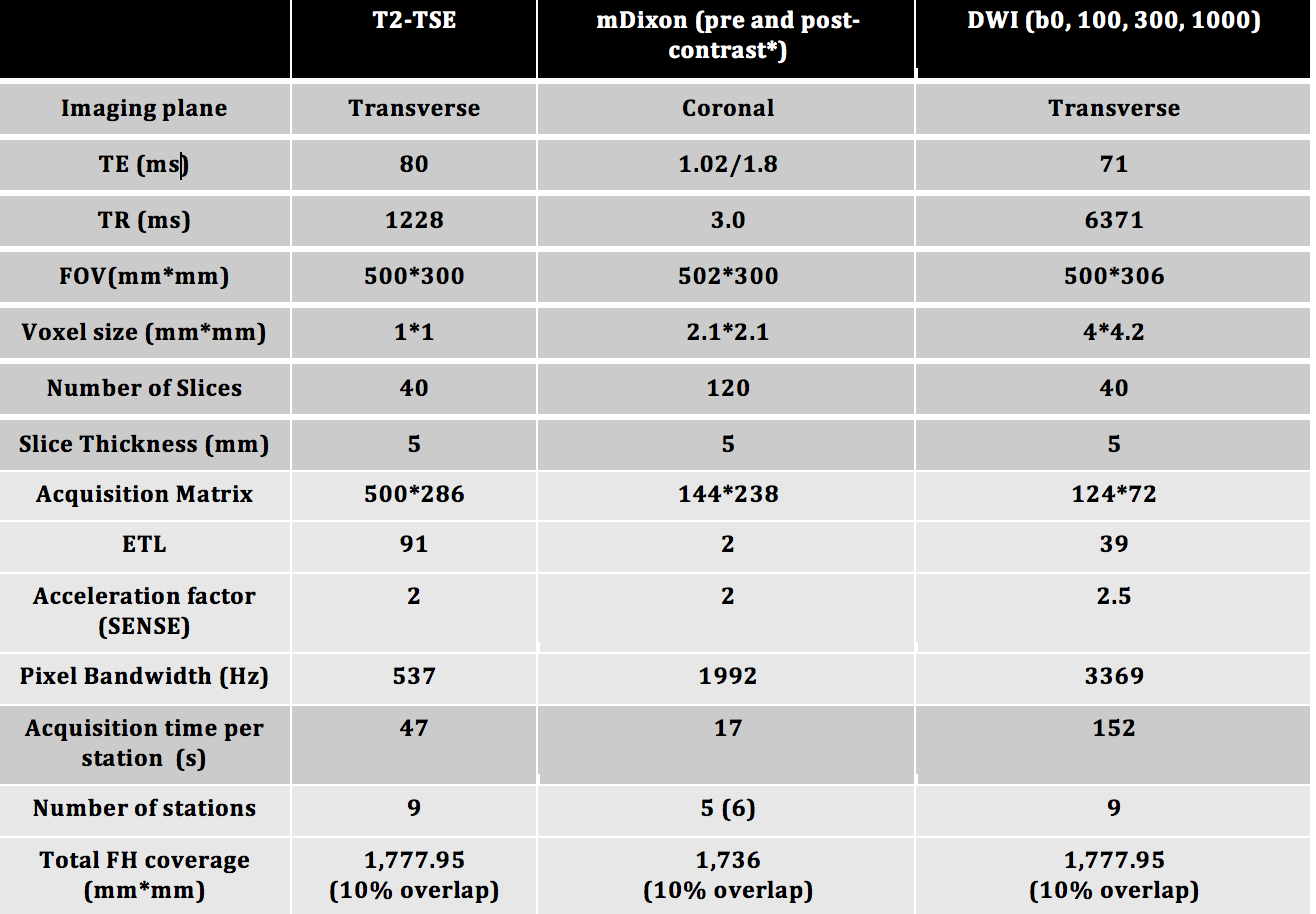
Figure 1: MRI sequence parameters
T2-TSE: T2-weighted Turbo Spin Echo, mDixon: Modified Dixon, DWI: Diffusion Weighted Imaging, TE: Time of Echo, TR: Time of Repetition, ETL: Echo Train Length, SENSE: sensitivity encoding. * Contrast agent 20 ml intravenous gadoterate meglumine, Dotarem, Guerbet, France
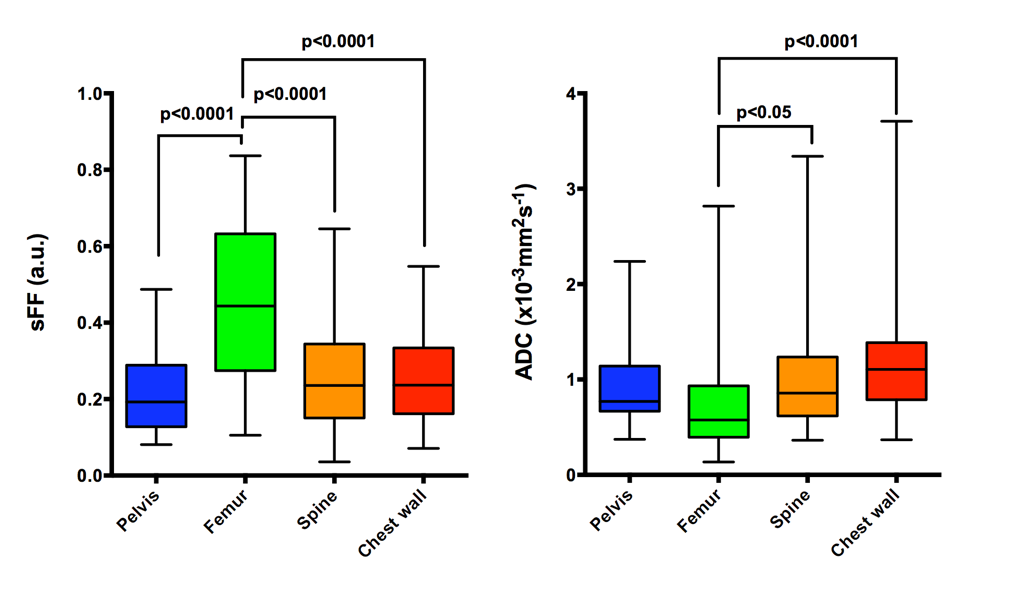
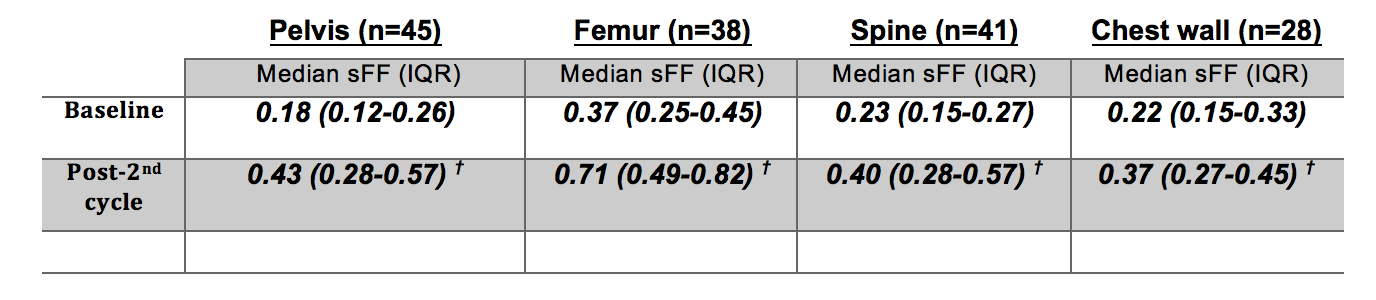
Figure 3: Temporal changes of median (interquartile range) lesional signal fat fraction (sFF) according to anatomical location. The data shown are for responding patient only.
sFF: signal fat fraction IQR: interquartile range
†: Significant change (p<0.05) compared with baseline scans
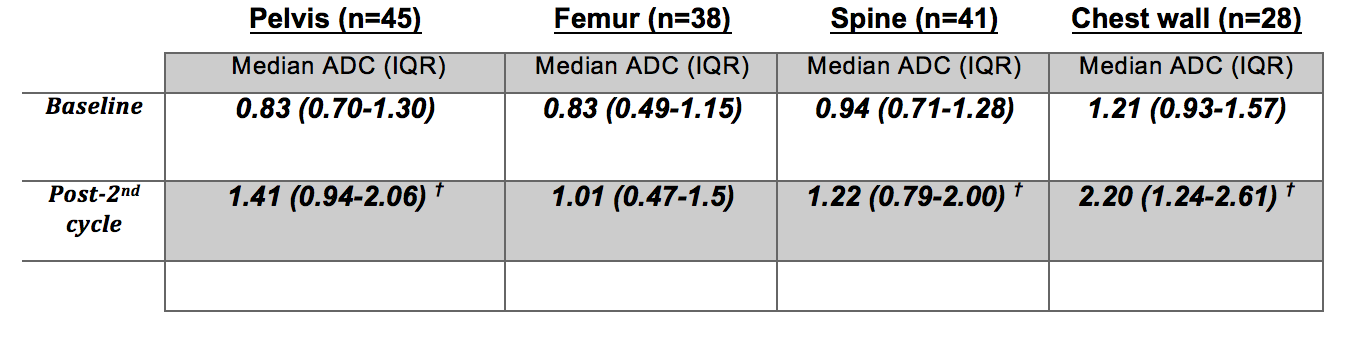
Figure 4: Temporal changes of median (interquartile range) lesional apparent diffusion coefficient (ADC) according to anatomical location. The data shown are for responding patient only.
sFF: signal fat fraction IQR: interquartile range
†: Significant change (p<0.05) compared with baseline scans