4356
Simultaneous imaging of tumor size with contrast-enhanced MRI and response to therapy with extracellular pH readout from BIRDS1Cardiff University School of Medicine, Cardiff, United Kingdom, 2Radiology and Biomedical Imaging, Yale School of Medicine, New Haven, CT, United States, 3Biomedical Engineering, Yale University, New Haven, CT, United States, 4Neurology, Henry Ford Hospital, Detroit, MI, United States
Synopsis
Acidic extracellular pH (pHe) of gliomas promotes tumor growth and builds resistance to therapy. Thus, to monitor therapeutic response, we used Biosensor Imaging of Redundant Deviation in Shifts (BIRDS), to generate pHe maps of rat brains bearing U251 tumors. Upon TmDOTP5- infusion, MRI identified tumor boundary and BIRDS imaged the intratumoral and peritumoral pHe gradient (DpHe). Two weeks post implantation of U251 glioma cells, animals were either treated with temozolomide (40 mg/kg) or were left untreated. The results of both terminal and longitudinal studies suggest that temozolomide therapy hinders tumor growth and normalizes intratumoral pHe.
INTRODUCTION
Gliomas account for more than 80% of all
malignant brain tumors. Glioma patients have a very poor prognosis and radiation
therapy, together with adjuvant temozolomide (TMZ) therapy is a widely used
treatment option [1]. The standard assessment of treatment response uses
gadolinium enhancement on MR imaging and/or fluid-attenuated inversion recovery
(FLAIR). However, such methods are not reliable in detecting pseudoprogression
and pseudoresponse especially with novel chemotherapeutic drugs necessitating
alternative MRI techniques reflecting tumor activity. In glioma, a metabolic
shift from oxidative phosphorylation to glycolysis causes an increased
production of protons and lactic acid which is eliminated out of the tumor
cells to maintain a near neutral intracellular pH. This along with poor
perfusion causes acidification of extracellular regions in tumors. Thus
measurement of extracellular pH (pHe) can be used as a read out of
tumor activity. We measured tumor size using contrast enhanced MRI and pHe
using a novel imaging method called Biosensor Imaging of Redundant Deviation in
Shifts (BIRDS) using TmDOTP5-,
to compare alterations in intratumoral-peritumoral pHe
gradient (ΔpHe) in response to therapy.METHODS
Adult, female athymic nude rats (n =11) bearing
U251 tumors were randomly assigned for 2 cycles of TMZ treatment (40 mg/kg) starting
day 14, daily, for 4 days with a gap of 2 days in between consecutive cycles. Tumor size was monitored by measuring the
tumor volume with contrast enhanced imaging 2 weeks (Gadavist) and 3 weeks post
inoculation (TmDOTP5-). Animals were prepared for BIRDS
imaging at the end of 3 weeks in both untreated and TMZ treated groups as
reported earlier [2]. This was followed by experiments for longitudinal
assessment of size (using Gadavist) and ΔpHe with BIRDS imaging using TmDOTP5-in U251 tumor
bearing athymic nude rats (n=2) before and after 2 cycles of TMZ treatment
using protocol described in Huang et al., 2016 [3]. In vivo
CSI data were acquired on 11.7T Agilent spectrometer using a 1H
surface coil. A dual-banded refocused
90° Shinnar-Le Roux RF pulse of 35 kHz bandwidth and 90 kHz separation with 205
μs duration was used for selective excitation of the H2/H3 and H6 protons of TmDOTP5-. The datasets were acquired as
previously described [2].RESULTS
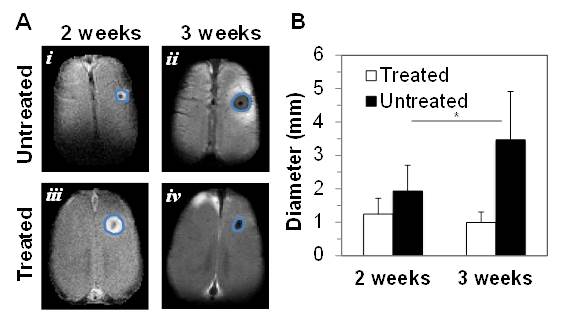
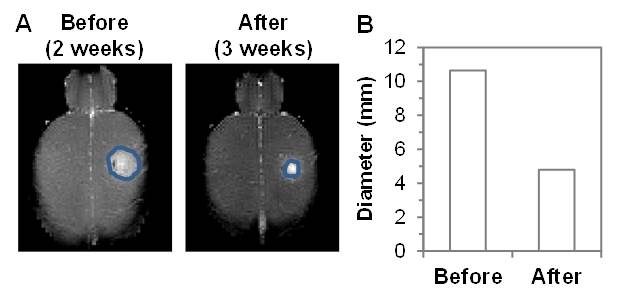
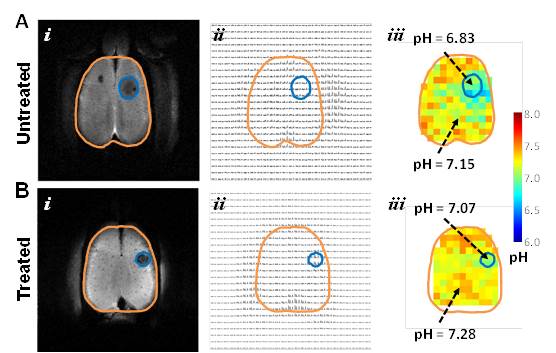
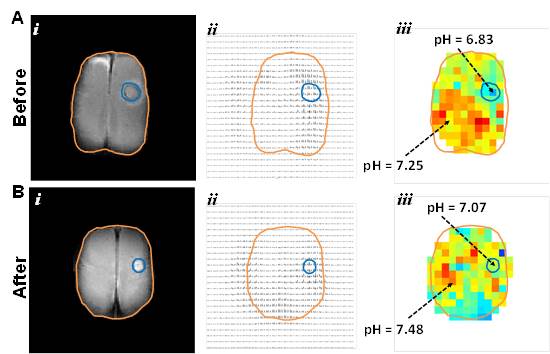
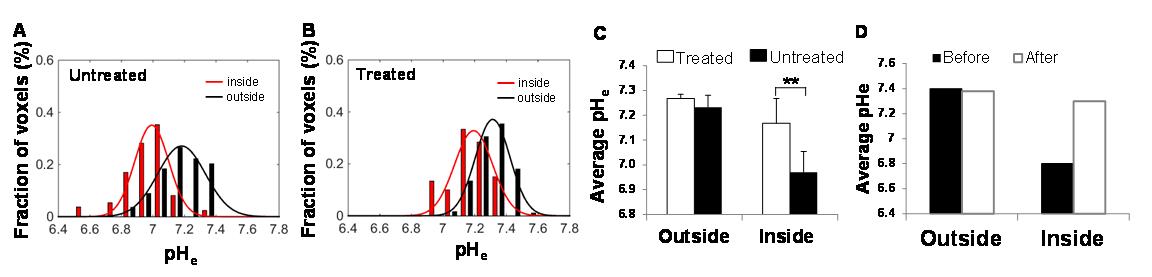
In response to TMZ treatment, a reduction in tumor size was observed at 3 weeks in both terminal and longitudinal experiments (Figures 1 and 2). Expression of cleaved Caspase-3 (apoptosis marker) and Ki-67 (proliferation marker) in treated and untreated rats was investigated using immunohistochemistry. Increased levels of cleaved Caspase-3 (p=0.001) and low expression of Ki-67 (p=0.0268) were observed in treated rats when compared to untreated rats, suggesting the initiation of apoptosis and reduction in proliferation of U251 tumor cells upon TMZ treatment. The ΔpHe changes in response to TMZ treatment was monitored using BIRDS with TmDOTP5-. As shown in Figure 3, pHe inside the tumor was acidic in untreated when compared to TMZ treated rats. In longitudinal studies an increase in pHe in intratumoral regions was observed in response to TMZ treatment (Figure 4). The pHe was also lower in voxels surrounding the tumor, in untreated tumors while treated rats showed normalization of pHe. The intratumoral and peritumoral pHe values measured by BIRDS for untreated and treated tumors are represented in histograms in Figure 5A and B. The average pHe (±SD) inside and outside the tumor in treated and untreated rats are represented in Figure 5C. Inside the tumor, average pHe was significantly (p<0.01) lower in untreated rats when compared to treated rats while in the regions outside the tumor, no significant difference was observed between the two groups. In longitudinal studies a similar trend was observed before and after TMZ treatment (Figure 5D). The Gaussian fitting analysis (FWHM) accounting for all voxels suggested that the intratumoral-peritumoral pHe gradient (ΔpHe) for treated tumor was ~0.1, whereas the ΔpHe for untreated tumor was ~0.2.CONCLUSION
Thus, to conclude, in this study, we report that
mapping intratumoral-peritumoral pHe gradient using BIRDS serves as
a useful and effective biomarker in evaluating response to TMZ therapy in
gliomas.Acknowledgements
NIH Support: •NCI (R01 CA-140102) •NIBIB (R01 EB-011968)References
1. Goodenberger, M.L. and R.B. Jenkins, Genetics of adult glioma. Cancer Genet, 2012. 205(12): p. 613-21.
2. Coman, D., et al., Imaging the intratumoral-peritumoral extracellular pH gradient of gliomas. NMR Biomed, 2016. 29(3): p. 309-19.
3. Huang, Y., et al., Towards longitudinal mapping of extracellular pH in gliomas. NMR Biomed, 2016.
Figures