4355
Quantitative assessment of water diffusivity in bladder tumors: can response be predicted prior to neoadjuvant chemotherapy?1Wright Center of Innovation in Biomedical Imaging, Department of Radiology, The Ohio State University, Columbus, OH, United States, 2Department of Internal Medicine, The Ohio State University, Columbus, OH, United States, 3Department of Urology, The Ohio State University, Columbus, OH, United States, 4Center for Biostatistics, The Ohio State University, Columbus, OH, United States, 5Department of Pathology, The Ohio State University, Columbus, OH, United States, 6Department of Physics and Astronomy, Louisiana State University, Baton Rouge, LA, United States, 7Pennington Biomedical Research Center, Baton Rouge, LA, United States
Synopsis
This study is to correlate the degree of tumor heterogeneity in Apparent Diffusion Coefficient (ADC) at baseline with chemotherapeutic response in bladder cancer patients. MRIs of twenty muscle-invasive bladder cancer patients were performed with Diffusion weighted MRI (DWI). Freehand ROIs were placed on the whole tumor volume on ADC maps to obtain a dataset of voxel-wise ADC values for each patient. Histogram analysis was performed on each patient’s ADC dataset to calculate uniformity (U) and entropy (E) at baseline. These quantities were then correlated with the patient’s chemotherapeutic response. Our data showed that there was a strong correlation of tumor heterogeneity, which is characterized by U and E, and the patient’s chemotherapeutic response. While U was significantly higher, E was significantly lower in responders (both P<0.01) compared to non-responders. In conclusion, quantification of tumor ADC heterogeneity can provide useful information that enables the ability to predict chemotherapeutic response prior to the treatment, to improve the patient outcomes.
Purpose
The purpose of this study is to correlate the degree of tumor heterogeneity in Apparent Diffusion Coefficient (ADC) with chemotherapeutic response in bladder cancer patients using histogram analysis of voxel-wise ADC. We aim at finding a biomarker to predict bladder cancer response to neoadjuvant chemotherapy as early as prior to the treatment.Methods
Patients
Twenty patients who had transurethral resection of bladder tumor (TURBT) and were pathologically diagnosed with muscle-invasive bladder cancer (MIBC) have been included in this study. All patients had a baseline MRI before neoadjuvant chemotherapy and radical cystectomy at the end of the treatment. Pathological findings of cystectomy specimens were used to define response criteria. A patient was considered to be a responder if they meet all the following criteria: (1) tumor was downstaged after chemotherapy; and (2) no lymph nodes were found to be positive for cancer, i.e. N stage is N0.
MRI protocol
Patient MRIs were performed on a 3T multi-transmit system (Ingenia CX, Philips Healthcare) with digital 32-channel phased array surface coil. Diffusion weighted MRI (DWI) was implemented with a single-shot echo-planar imaging (ssh-EPI) sequence (TR/TE = 2017/59 ms; matrix = 100/140; in-plane FOV = 220/317; slice thickness = 3.0 mm; slice gap = 0.3 mm; number of slices = 25; number of signal average = 6; b-values = 0, 333, 667, 1000 s/mm2) after anatomical high-resolution T2W MRI and before the administration of contrast agent.
Data analysis
DWI data was post-processed after the data acquisition using Philips system software to obtain ADC maps. A radiologist who was blinded to the pathological findings reviewed ADC maps for the placement of region of interest (ROI). Freehand ROIs were placed on the whole tumor volume to obtain a dataset of voxel-wise ADC values for each patient. Histogram analysis was performed on each patient’s ADC dataset to calculate two quantities, uniformity (U) and entropy (E) at baseline (pre-chemotherapy). These quantities were then correlated with the patient’s chemotherapeutic response (as defined above). Correlation was considered to be statistically significant with P<0.05.
Results
The pathological findings of TURBT specimens confirmed that all patients had pT2b stage before baseline MRI and chemotherapy. After chemotherapy and radical cystectomy, the pathological examination of cystectomy specimens found eight patients with pT0 N0, four patients with pTis N0, one with pT1N0, and two with pT2a N0. These fifteen patients were defined as responders since their stage was less than that (pT2b) before chemotherapy. The other five patients with stage ≥ pT2b were considered as non-responders.
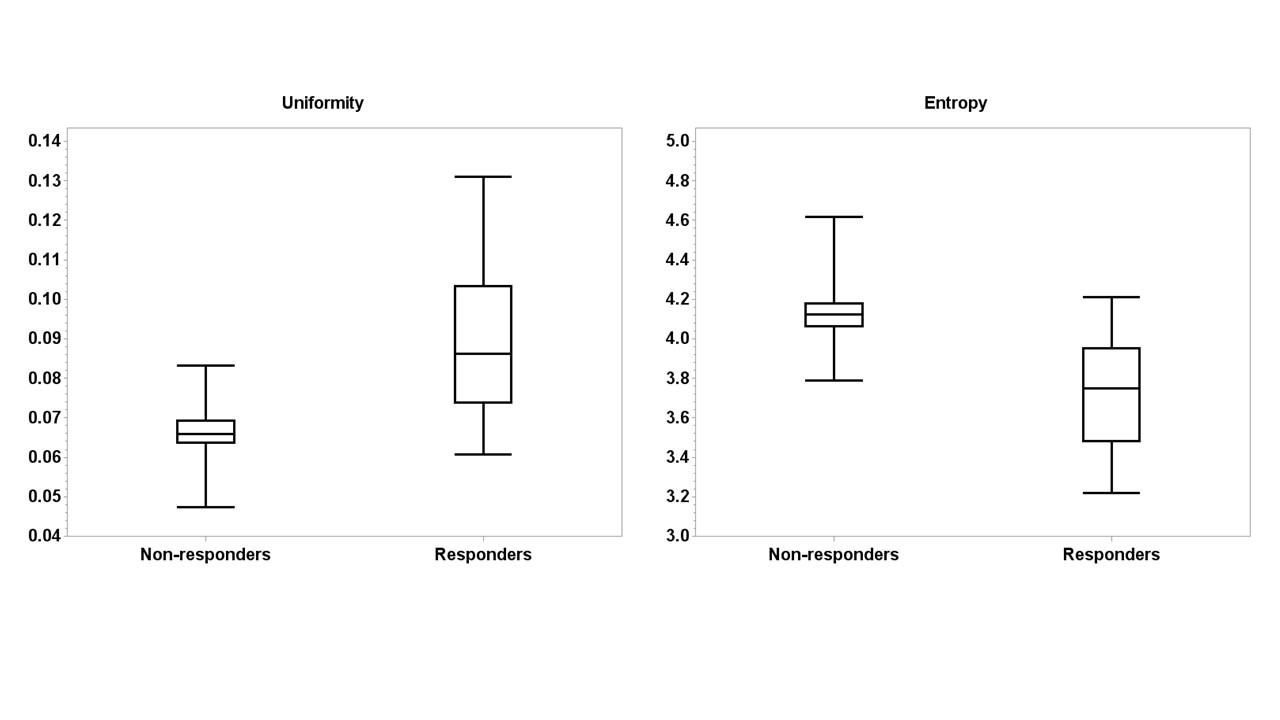
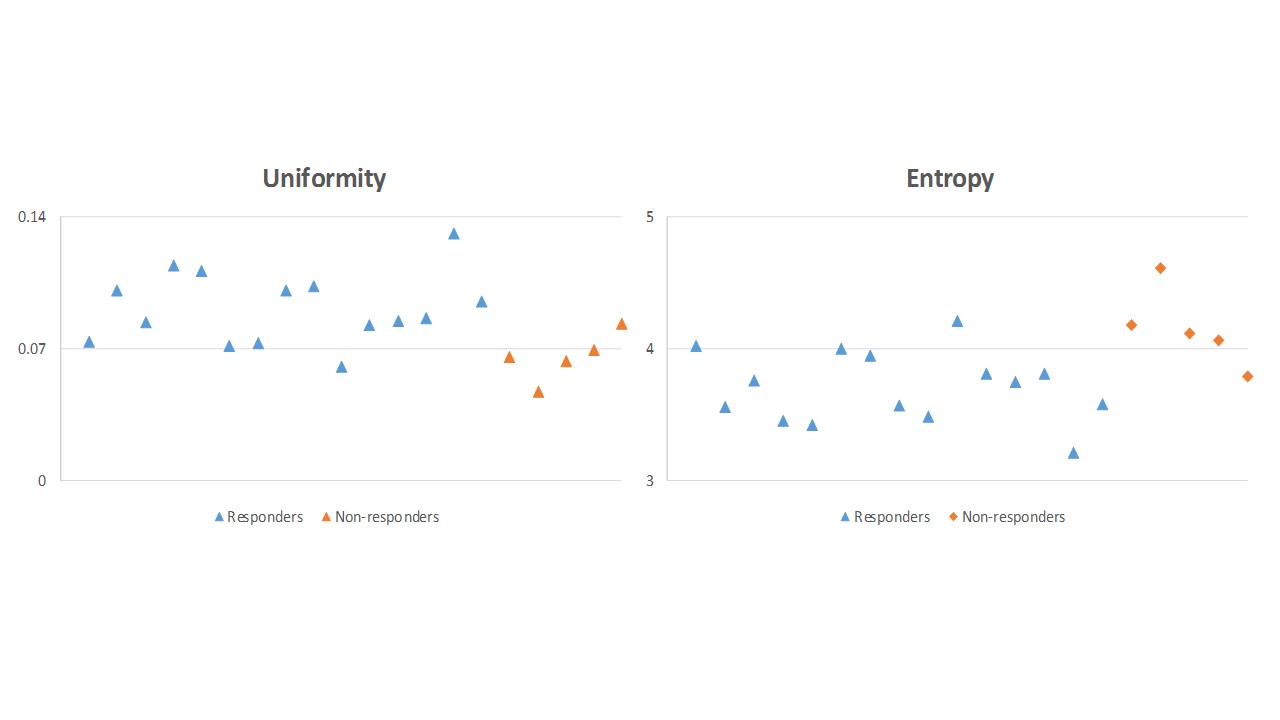
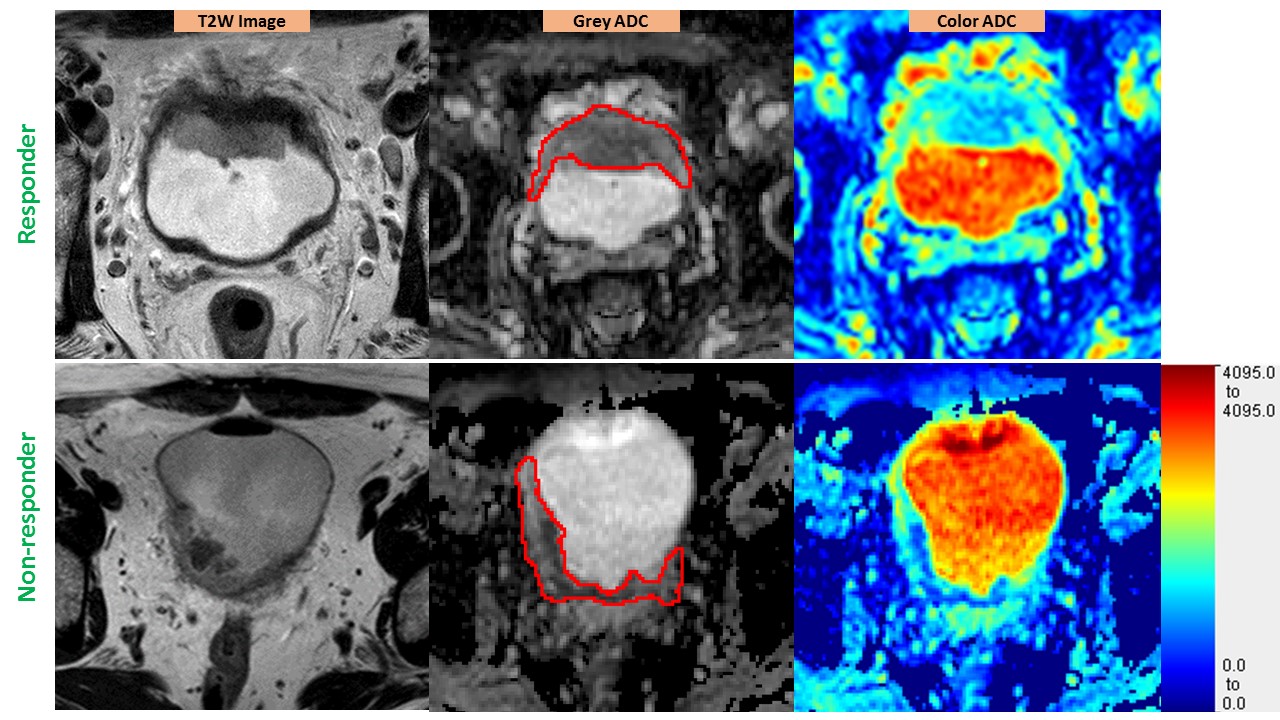
Our data showed that there was a strong correlation of tumor heterogeneity, which is characterized by U and E, and the patient’s chemotherapeutic response. While U was significantly higher, E was significantly lower in responders (both P<0.01) compared to non-responders (Figures 1 and 2). This difference in ADC heterogeneity is not always appreciated with the naked eye. As shown in the figure 3, T2W MRI, grey-scaled color maps or color-coded ADC maps can show that tumors are heterogeneous in ADC distribution, however, do not reveal the difference in the level of ADC heterogeneity.
Discussion
ADC characterizes the water diffusivity in body tissues. The study showed that the level of tumor heterogeneity in water diffusivity is highly associated with the patient’s response to chemotherapy. With significantly lower U and higher E, non-responders had more heterogeneous tumors before the treatment, which suggests that heterogeneity have a significant impact on the efficacy of drug delivery.Conclusion
Quantification of tumor ADC heterogeneity can provide useful information that enables the ability to predict chemotherapeutic response prior to the treatment, to improve the patient outcomes.Acknowledgements
This study is supported by Wright Center of Innovation in Biomedical Imaging development fund and ODSA TECH 11-044.References
1. Nguyen HT, Shah ZK, Mortazavi A, Pohar KS, Wei L, Jia G, Zynger DL, Knopp MV: Non-invasive quantification of tumour heterogeneity in water diffusivity to differentiate malignant from benign tissues of urinary bladder: a phase I study. Eur Radiol 2016.
1. Just N: Improving tumour heterogeneity MRI assessment with histograms. British journal of cancer 2014, 111(12):2205-2213.
Figures