4353
Radiation-induced changes in normal-appearing brain in patients with nasopharyngeal carcinoma: a MR T1ρ imaging study1Medical Imaging Center, Nanfang Hospital of Southern Medical University, Guangzhou, People's Republic of China, 2Philips Healthcare, Guangzhou, People's Republic of China, 3Philips Healthcare, Hongkong, People's Republic of China
Synopsis
Radiation encephalopathy is the primary complication in patients with nasopharyngeal carcinoma (NPC) following radiotherapy (RT). In order to detect early radiation-induced alterations in the brain of NPC patients after RT, we recruited NPC patients before RT and after RT with normal-appearing brain for MR T1ρ examinations. We found abnormal microstructural changes of gray matter and white matter in NPC patients after RT can be detected by MR T1ρ even when routine MRI findings are negative. MR T1ρ may be used to predict early radiation-induced alterations of the brain following RT for NPC patients.
Purpose
Radiotherapy (RT) is the most effective treatment for nasopharyngeal carcinoma (NPC). However, radiation-induced encephalopathy is one of the most serious complications observed after radiotherapy. Currently, the prevention of radiation-induced brain changes relies on early diagnosis and monitoring, with early diagnosis mainly based on radiological techniques. However, the detection of abnormalities on enhanced MRI usually reflects the occurrence of irreversible radiation-induced brain changes. T1ρ represents the spin-lattice relaxation time constant in the rotating frame, which has been found to be sensitive to the interaction between the marcomolecules and bulk water. The changes of T1ρ values precede the morphological changes detected by conventional MR1. The aim of our study was to detect microstructural changes in normal-appearing brain in patients with NPC by MR T1ρ imaging.Methods
Subjects and data acquisition: 80 patients with pathologically-confirmed NPC (22 females, 58 males; average age, 47.5 years; age range, 23-65 years) who all had normal MRI brain scans were recruited. The patients were classified into four groups on the basis of the time before and after completion of RT: group 1 (pre-RT, control group, n=20); group 2 (3 months post-RT, n=20); group 3 (6 months post-RT, n=20); group 4 (12 months post-RT, n=20). All MR scans were performed on a 3.0T MR scanner (Philips Achieva, the Netherlands) with an 8 channel head coil to receive the signal. T1ρ was performed using 3D Turbo Spin-Echo pulse sequence, scanning parameters were as follows: TR/TE= 4800ms/229ms, FOV = 250×250mm2, flip angle = 90°, matrix = 240×240, slice thickness = 1.8mm, number of slices = 100, spin lock frequency = 500 Hz, spin lock time = 0, 20, 40, 60, 80, 100 ms respectively. The entire volume of each subject’s brain was imaged in the sagittal plane using a T1-weighted 3D volumetric pulse sequence with 150 continuous slices.
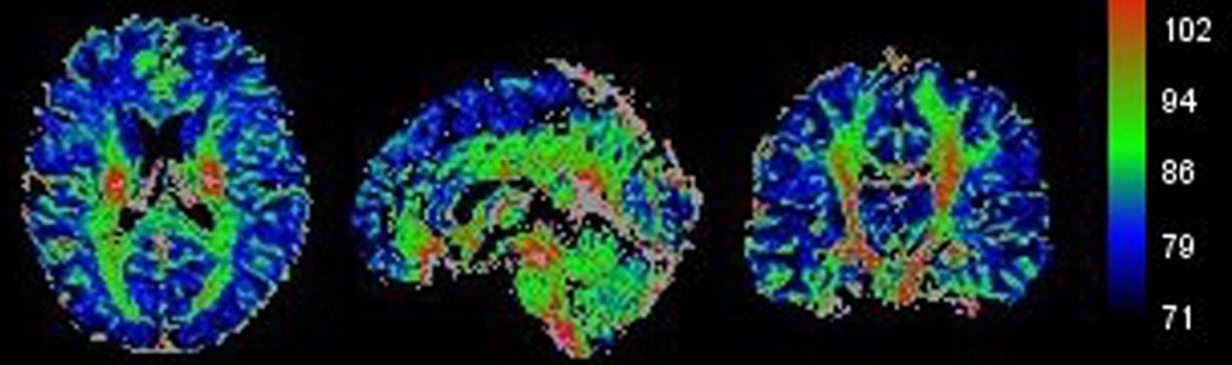
Data analysis: All the DICOM images were converted to NIfTI format using MRIcron. Non-brain tissues of T1ρ images and 3D T1WI images were removed by FSL software respectively. For each subject, T1-weighted images and T1ρ images were first oriented in the same direction. T1-weighted images were co-registered to the T1ρ images. Next, the co-registered T1-weighted images were segmented into GM and WM images respectively. Finally, the T1ρ images were normalized by the matrix of standard space (Fig. 1). Regions of interest for major white matter tracts were defined by an intersection of the individual spatially normalized WM probability map thresholded at 50% with the JHU ICBM-DTI-81 white matter labels atlas supplied with FSL. Cortical gray matter regions were similarly defined by the intersections of the individual spatially normalized GM probability maps thresholded at 50% with the Harvard-Oxford cortical atlas. Quantification analyses of WM and GM in the regions of interest were extracted by software based on MATLAB.
Statistical Methods: Statistical analysis was performed using SPSS. One-way analysis of variance was used to compare the T1ρ values of GM and WM in different groups, followed by LSD method to further determine the statistical differences across groups, with p < 0.05 accepted as statistically significant.
Results and Discussion
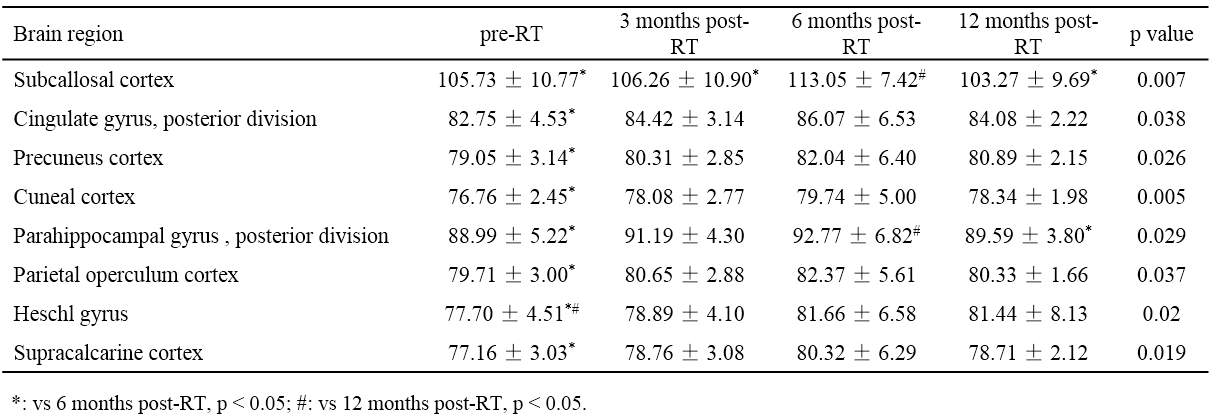
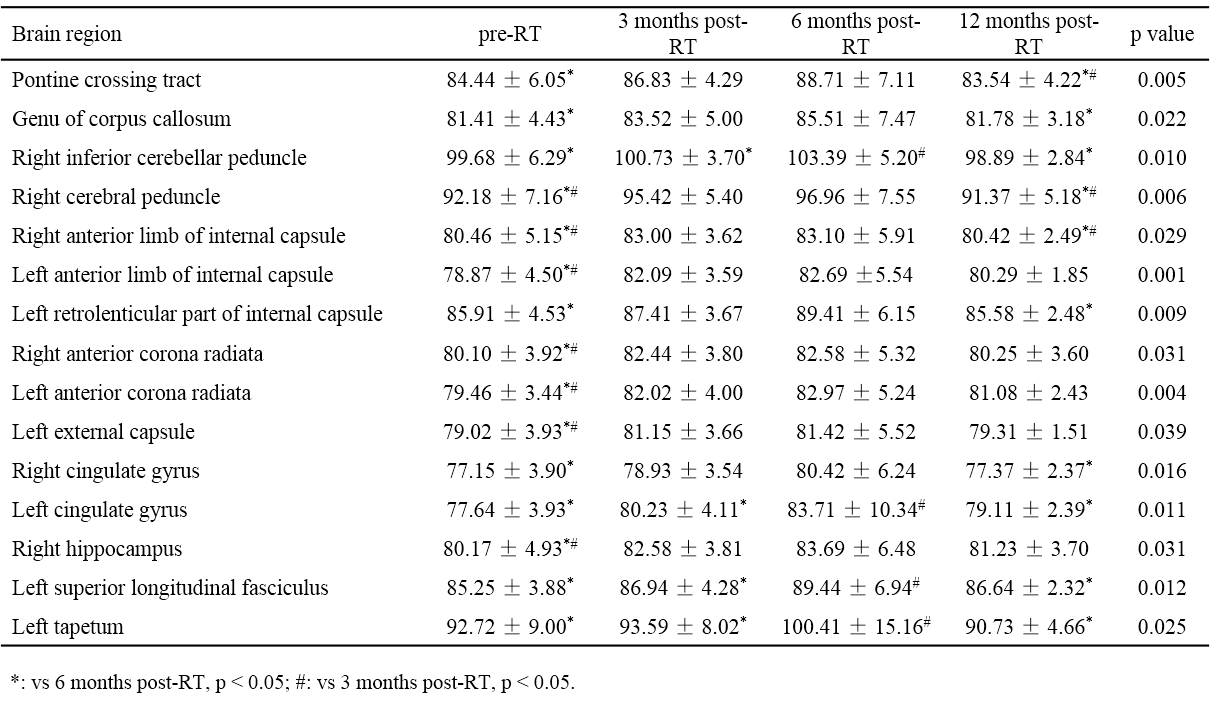
For GM, there were significant differences in T1ρ values of subcallosal cortex, cingulate gyrus (posterior division), precuneus cortex, cuneal cortex, parahippocampal gyrus (posterior division), parietal operculum cortex, heschl gyrus and supracalcarine cortex among gruops (Table 1, p < 0.05). For WM, the T1ρ values of pontine crossing tract, genu of corpus callosum, right inferior cerebellar peduncle, right cerebral peduncle, bilateral anterior limb of internal capsule, left retrolenticular part of internal capsule, bilateral anterior corona radiata, left external capsule, bilateral cingulate gyrus, right hippocampus, left superior longitudinal fasciculus and left tapetum showed significantly different among gruops (Table 2, p < 0.05). In these brain regions of GM and WM, the T1ρ values increased to some extent in the 3 months post-RT group when compared with the pre-RT group, then the T1ρ values reached its maximum in the 6 months post-RT group, which were significantly higher than those of the pre-RT group. In the 12 months post-RT group, the T1ρ values decreased in different degrees when compared with the 6 months post-RT group. In summary, the microstructural alterations in normal-appearing brain in patients with NPC are dynamic and transient, which is consistent with the findings of 1H-MRS, DTI and DKI studies2-4.Conclusion
This study demonstrates that MR T1ρ may be used to predict the alterations of radiation change in both GM and WM of the brain in patients with NPC before detectable manifestation in routine MRI imaging, indicating that MR T1ρ may provide a useful imaging evaluation tool for clinical research.
Acknowledgements
No acknowledgement found.References
[1] Haris, et al. NeuroImage-Clin, 2015, 7: 598-604.
[2] Wang H Z, et al. Clin Radiol, 2012, 67(4): 340-345.
[3] Xiong W F, et al. J Magn Reson Imaging, 2013, 37(1): 101-108.
[4] Wang D, et al. Brain Res, 2016, 1648: 387-393.
Figures