4352
Magnetic Resonance Spectroscopic Early Predictors of 2-Year Progression Free Survival in IDH Mutated WHO II and III Gliomas1Center for Clinical Spectroscopy, Brigham and Women's Hospital, Boston, MA, United States, 2Radiology, Brigham and Women's Hospital, Boston, MA, United States, 3Radiation Oncology, Brigham and Women's Hospital, Boston, MA, United States
Synopsis
Most MR spectroscopy studies of patients with IDH-mutated gliomas have focused on the sensitivity and specificity of the 2-hydroxyglutarate measures but none that have examined the predictive value of 2HG in comparison to other brain metabolites for treatment outcome. This prospective longitudinal study measured MRS at baseline and two time points after radio/chemotherapy of IDH-mutated gliomas. Results showed that Cho/NAA shows the greatest predictive value followed by Cho/Cr, NAA/Cr, and Lac/Cr ratios but that all three time points 2HG levels were not predictive of outcome demonstrating that it is likely reflective of pathways distinct from membrane proliferation.
Introduction
Mutations in isocitrate dehydrogenase (IDH) characterize the majority of grades II and III gliomas and secondary glioblastomas1-4. Magnetic resonance spectroscopy (MRS) has long been used in assessing tumor response in glioblastoma, and identified noninvasive molecular indicators of response including choline (Cho), N-acetyl aspartate (NAA), Cho/NAA ratio and lactate (Lac)5-7. Additionally, it is now well established that IDH mutations lead to accumulation of high concentrations of 2-hydroxyglutarate (2HG) that can be detected by MRS8-10. We therefore undertook a prospective longitudinal study of MRS in patients with IDH mutated glioma to correlate MRS markers with patient outcomes to identify early predictors of response.Methods
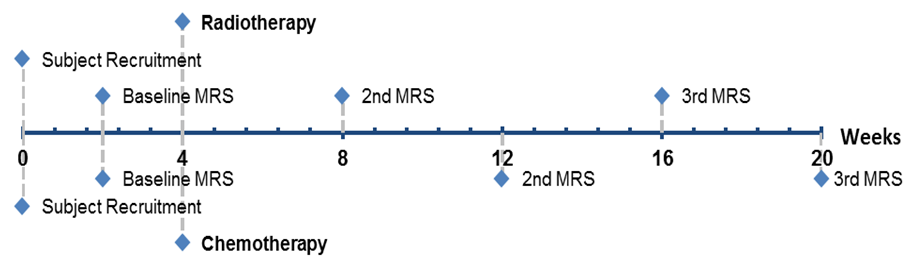
11 patients with IDH1 mutated WHO grade II and III gliomas were recruited and consented under local IRB approval. Baseline MRI and MRS were acquired prior to radiotherapy and/or chemotherapy. Figure 1 describes MRS time points. All patients were evaluated every 2 months after beginning treatment and RANO criteria were used to define progression for each patient11. Progression-free survival (PFS) at 2 years posttreatment was the primary endpoint for this study.
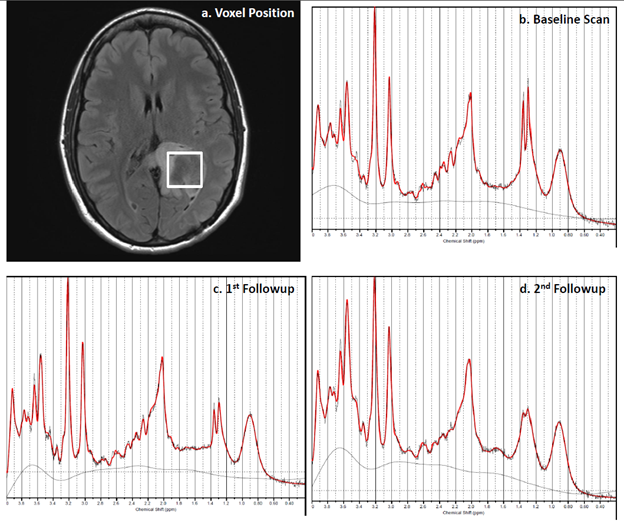
All MRI and MRS exams were performed on a clinical 3.0T scanner (Skyra, Siemens) with a 32-channel head coil. MRS was localized on FLAIR images to maximize lesion volume (Fig 2). Short-TE point-resolved single voxel spectroscopy was acquired with TR/TE = 2s/30ms, 3x3x3 cm3 volume (referenced to baseline), 64 averages,nsuppressed water spectrum, and with linewidth <14 Hz. MRS was processed using 30ms custom basis set that included 2HG and other metabolites using LCmodel. Area under the receiver operating characteristic curve (ROC AUC) was estimated to establish potential metabolite biomarkers of 2-year PFS.
Results
Four patients had relapsed within 2 years. No significant difference was found in WHO grades (P = 0.545, Fisher’s exact test) and age at baseline scan (P = 0.787, Student’s t test) between patients with PFS < 2 years and ≥2 years. Survival analysis showed neither WHO grades (P = 0.208, Kaplan-Meier test) nor age at baseline scan (P = 0.693, univariate Cox regression) were associated with survival in our cohort.
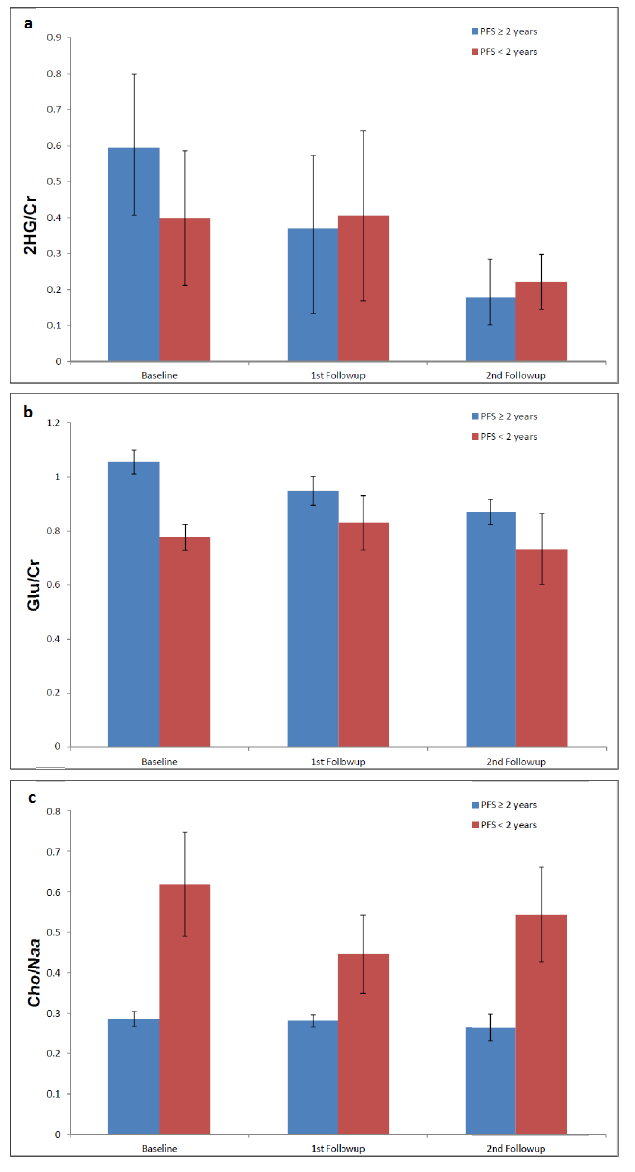
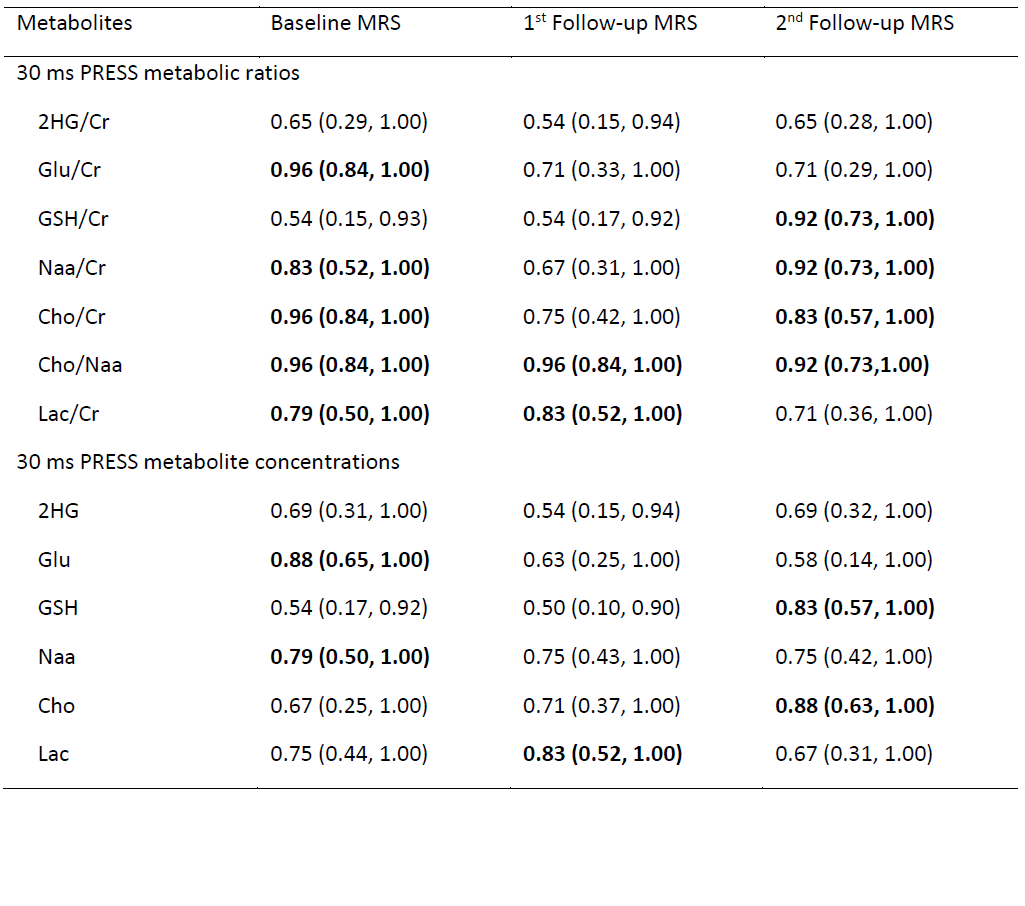
Table 1 shows empirical estimates of the AUC for prediction of 2-year PFS and the corresponding 95% confirence intervals for the metabolite ratios and concentrations at each time point. 2HG/Cr was not predictive of 2-year PFS at any time point (Fig 3a). Mean Glu/Cr ratios in patients with a PFS<2 years were lower than PFS≥2 at all three time points (Fig 3b), and the Glu/Cr at baseline had good performance for prediction of PFS at 2 years. GSH/Cr at 2nd followup showed good predictive value for 2-year PFS, with higher GSH/Cr levels related to worse results. Cho/Naa ratios demonstrated the best discriminatory ability of 2-year PFS. Patient group with a PFS<2 years displayed higher mean values of Cho/Naa at all three time points than PFS≥2 years (Fig 3c) and showed AUCS of 0.92 and greater at all three time points. Similarly, higher Cho/Cr and lower Naa/Cr were observed for patient group with a PFS<2 years compared to their counterpart at all three time points. The Cho/Cr and Naa/Cr ratios at baseline and 2nd followup were predictive of PFS≥2 years, with the AUCs from 0.82 to 0.92. Finally, the patient group with a PFS<2 years showed higher mean Lac/Cr compared to patient group with a PFS≥2 years at all three time points, and Lac/Cr at baseline and 1st followup demonstrated prediction of 2-year PFS.
Metabolic concentrations had similar findings to metabolic ratios but less predictive indicators. In particular, Glu at baseline and Cho at 2nd followup had the highest AUC of 0.88 for prediction, while Naa at baseline, Lac at 1st followup and GSH at 2nd followup had less favorable AUC. 2HG concentrations were not predictive of PFS-2 years at any time point.
Discussion/Conclusion
Predictive markers of treatment response for IDH-mutated gliomas would have great value for tumor monitoring and treatment management in clinical practice, and in developing new pharmaceutical agents targeting IDH mutations. Studies investigating potential biomarkers to evaluate treatment response in patients with IDH mutation harboring gliomas have focused primarily on 2HG without evaluating the utility of other brain metabolites. Our results demonstrate that Cho/NAA shows the greatest predictive value followed by Cho/Cr, NAA/Cr, and Lac/Cr ratios. Both Glu and GSH concentrations and ratios to Cr were predictive at baseline and 2nd followup respectively. However 2HG was not predictive. This does not contradict previous studies that have demonstrated the high diagnostic sensitivity and strong correlation with treatment of 2HG measures however 2HG may be reflective of different biological processes such as tumor cellularity12.Acknowledgements
We would like to thank Dr. Changho Choi for providing the basis set for the analysis of 2HG and other metabolites at 30 ms. This study was funded by BWH Institute for Neurosciences Seed Grant.References
1. Yan H, Parsons DW, Jin G, et al. IDH1 and IDH2 mutations in gliomas. The New England journal of medicine 2009;360:765-73.
2. Cancer Genome Atlas Research N, Brat DJ, Verhaak RG, et al. Comprehensive, Integrative Genomic Analysis of Diffuse Lower-Grade Gliomas. The New England journal of medicine 2015;372:2481-98.
3. Eckel-Passow JE, Lachance DH, Molinaro AM, et al. Glioma Groups Based on 1p/19q, IDH, and TERT Promoter Mutations in Tumors. The New England journal of medicine 2015;372:2499-508.
4. Suzuki H, Aoki K, Chiba K, et al. Mutational landscape and clonal architecture in grade II and III gliomas. Nature genetics 2015;47:458-68.
5. Ratai EM, Zhang Z, Snyder BS, et al. Magnetic resonance spectroscopy as an early indicator of response to anti-angiogenic therapy in patients with recurrent glioblastoma: RTOG 0625/ACRIN 6677. Neuro-oncology 2013;15:936-44.
6. Li Y, Lupo JM, Parvataneni R, et al. Survival analysis in patients with newly diagnosed glioblastoma using pre- and postradiotherapy MR spectroscopic imaging. Neuro-oncology 2013;15:607-17.
7. Deviers A, Ken S, Filleron T, et al. Evaluation of the lactate-to-N-acetyl-aspartate ratio defined with magnetic resonance spectroscopic imaging before radiation therapy as a new predictive marker of the site of relapse in patients with glioblastoma multiforme. International journal of radiation oncology, biology, physics 2014;90:385-93.
8. Nagashima H, Tanaka K, Sasayama T, et al. Diagnostic value of glutamate with 2-hydroxyglutarate in magnetic resonance spectroscopy for IDH1 mutant glioma. Neuro-oncology 2016;18:1559-68.
9. Choi C, Ganji SK, DeBerardinis RJ, et al. 2-hydroxyglutarate detection by magnetic resonance spectroscopy in IDH-mutated patients with gliomas. Nature medicine 2012;18:624-9.
10. Choi C, Ganji S, Hulsey K, et al. A comparative study of short- and long-TE (1)H MRS at 3 T for in vivo detection of 2-hydroxyglutarate in brain tumors. NMR in biomedicine 2013;26:1242-50.
11. Wen PY, Macdonald DR, Reardon DA, et al. Updated response assessment criteria for high-grade gliomas: response assessment in neuro-oncology working group. J Clin Oncol 2010;28:1963-72.
12. Choi C, Raisanen JM, Ganji SK, et al. Prospective Longitudinal Analysis of 2-Hydroxyglutarate Magnetic Resonance Spectroscopy Identifies Broad Clinical Utility for the Management of Patients With IDH-Mutant Glioma. Journal of Clinical Oncology 2016;34:4030-9.
Figures