4326
Optimization of Remote RF Transmit Coil Elements and Arrays for 7T UHF Body MRI1Erwin L. Hahn Institute for MR Imaging, University of Duisburg-Essen, Essen, Germany, 2Highfield and Hybrid MR Imaging, University Hospital Duisburg-Essen, Essen, Germany, 3Medical Physics in Radiology, German Cancer Research Center (DKFZ), Heidelberg, Germany
Synopsis
Remote radiofrequency (RF) body coils are broadly used as built-in body RF coils for signal transmission in clinical MR systems at 1.5 and 3T. For ultra highfield MR at 7T, remote body coils in conjunction with pTx systems have recently been presented. In this work we present a modified micro stripline RF element with meanders and investigate the performance of a 7T remote RF transmit array for body imaging applications featuring 8 of these elements concerning coupling, degrees of freedom within the B1+ fields, distribution of losses, power efficiency, and SAR efficiency.
Purpose
To allow for UHF MRI body applications and to approach a more clinical workflow, remote radiofrequency (RF) body coils have recently been investigated for 7T body MRI1,2. These arrays are based on micro striplines with meanders3. Yet, previous simulations of remote arrays showed that this type of element has high losses in the bore liner, in the lambda-over-2 cable, and in capacitors used for tuning and matching4. Consequently, a modified micro stripline RF element with meanders is examined in this work.Material and Methods
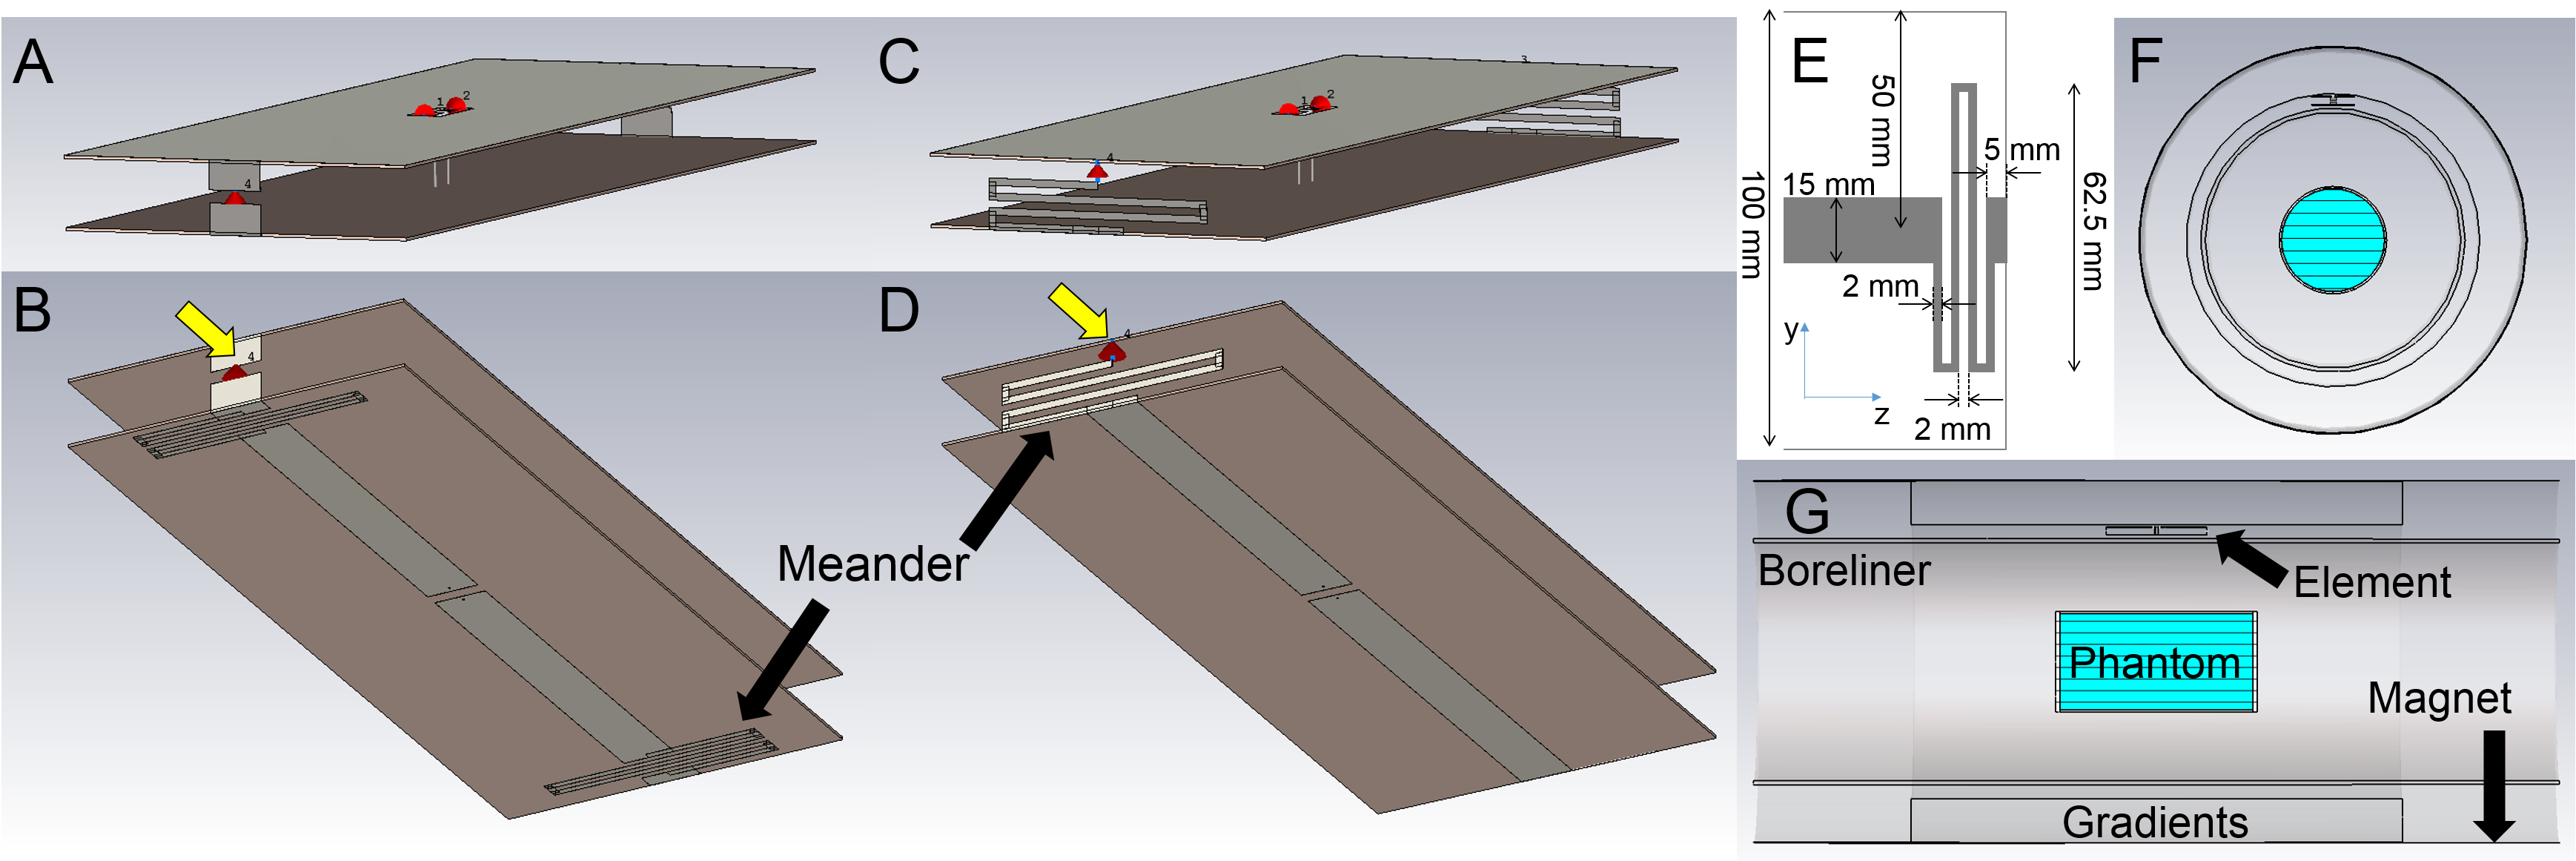
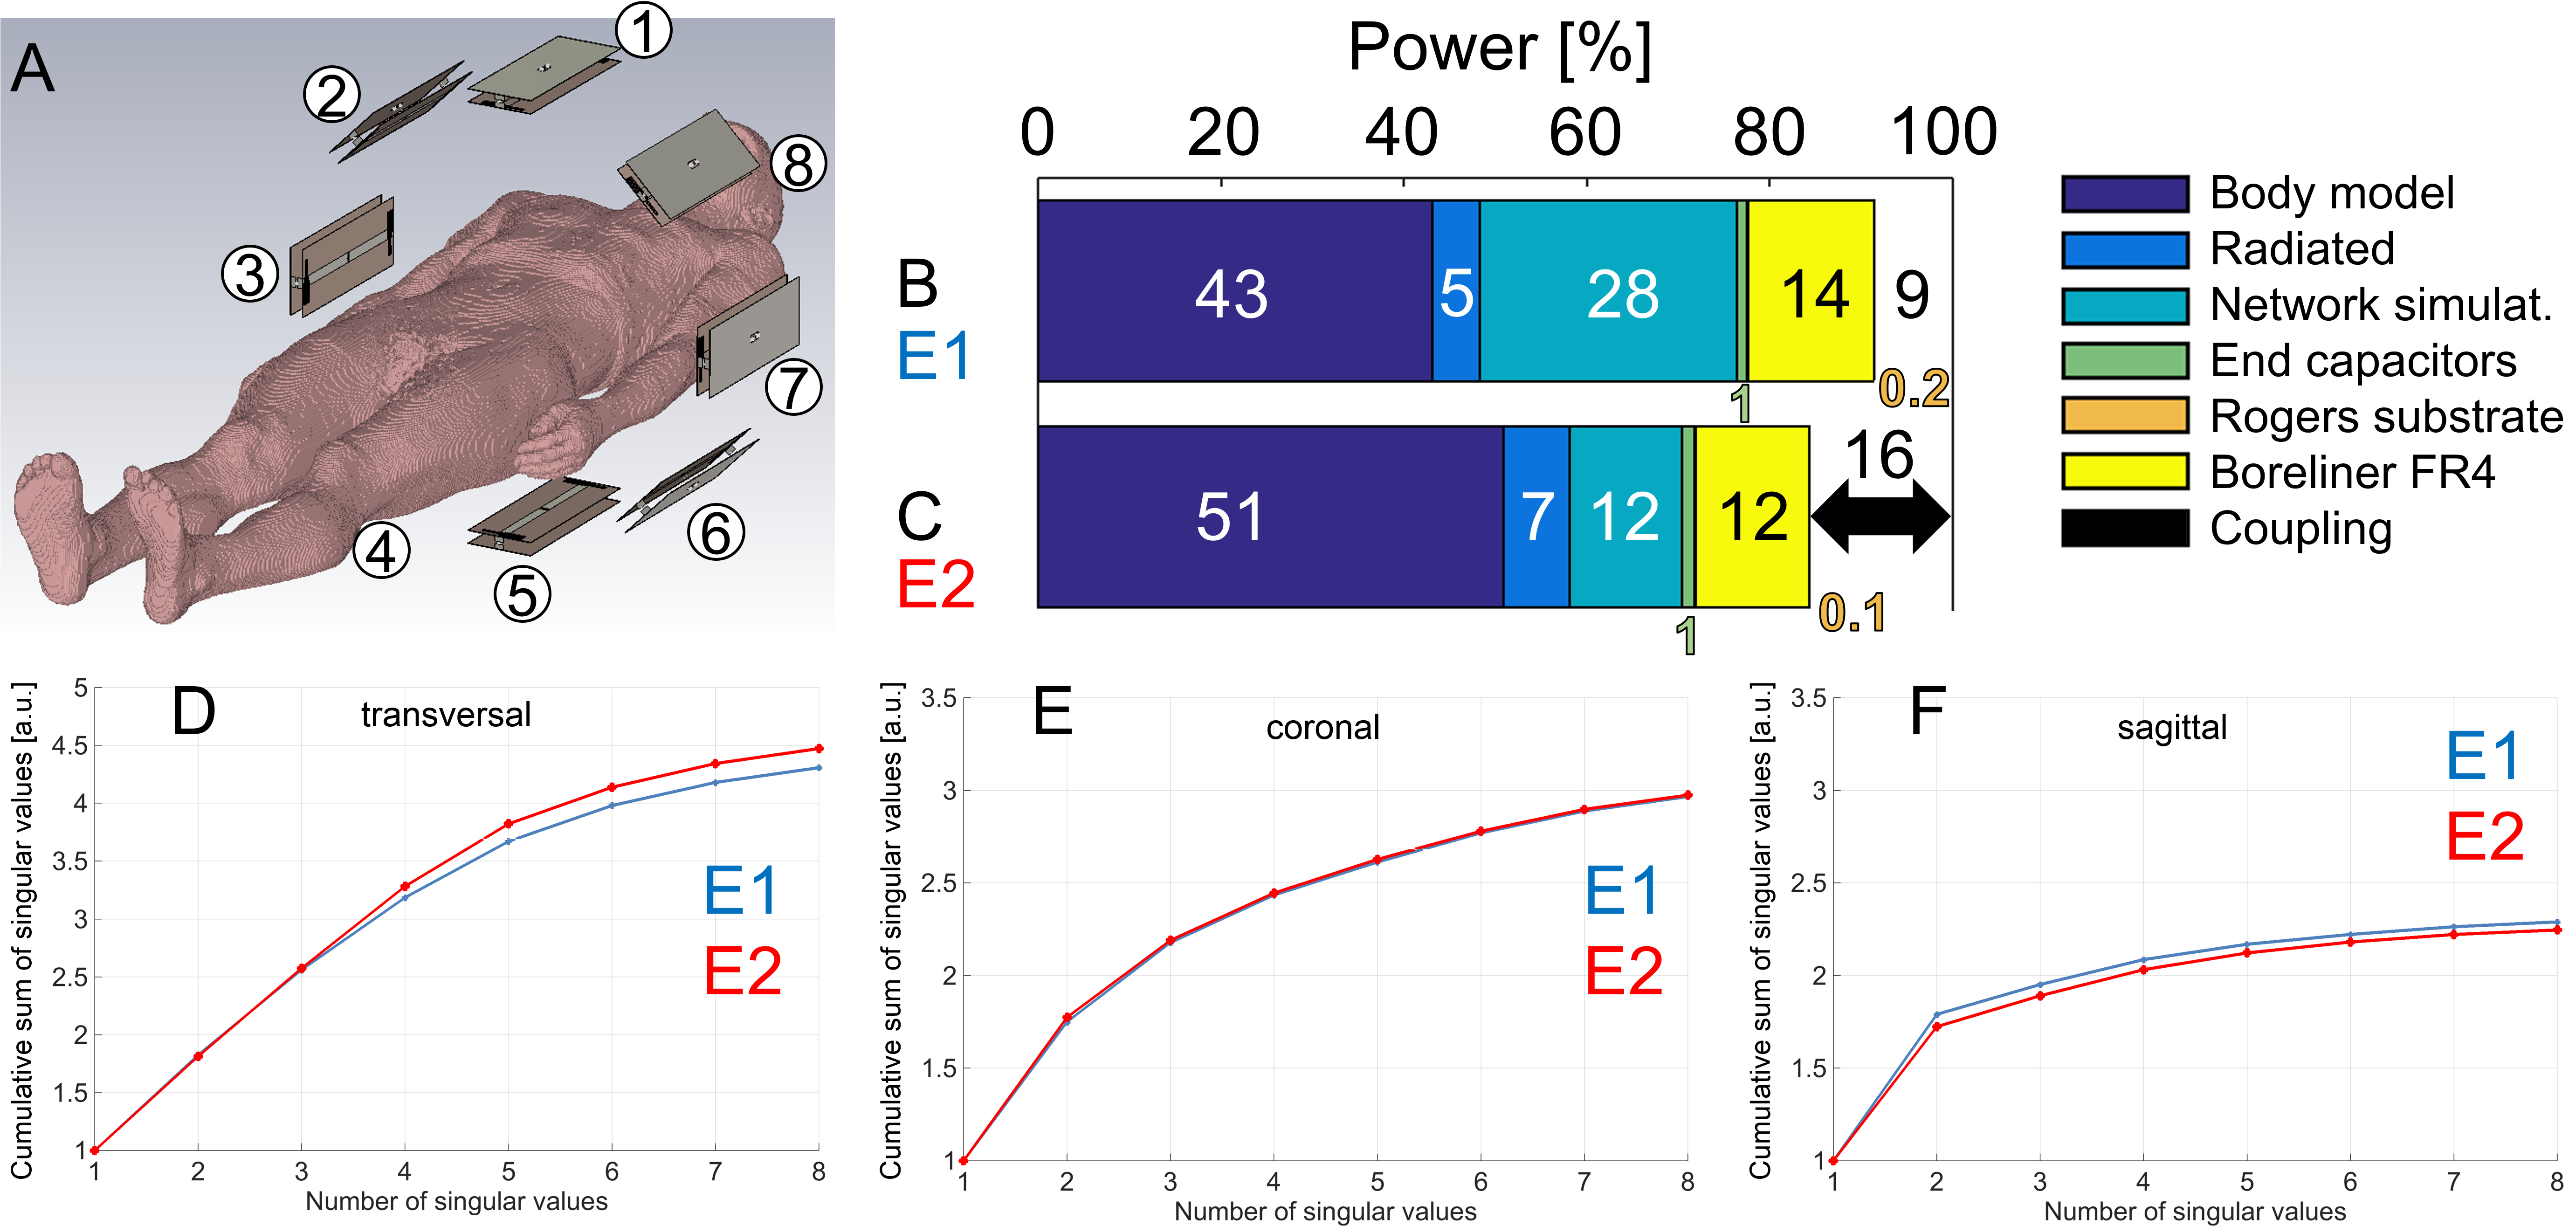
Simulations were performed in CST Microwave Studio (CST AG, Darmstadt, Germany) using the finite integration technique. First, the conventional meander element3 (Figure 1A,B) denoted as E1 and a modified version denoted as E2 (Figure 1C,D,E) were simulated (Figure 1F,G). E2 is redesigned to enhance the power transfer to the load by reducing losses in the bore liner and in the network simulation (lambda-over-2 cable, equivalent series resistance of capacitors for tuning and matching). All performed simulations include a bore liner (FR4, tanδelectric = 0.025) as well as a model for the gradient coil and the magnet, both of which are modeled as perfect electric conductors (Figure 1G). Further simulations (Figure 2A) modeled an 8-channel remote array with the male body model DUKE5 as load for both E1 and E2. Here, investigations of the power balance where performed for the CP+ mode. Data was exported from CST and further processed in MATLAB (The MathWorks, Inc., Natick, MA, USA) to obtain B1+ fields and virtual observation points6. To evaluate the degrees of freedom within the B1+ fields, a singular value decomposition was performed and the cumulative sum of singular values was used as a measure to compare the arrays7. To evaluate the B1+ efficiency on a voxel basis in the central slices, the sum of the absolute values of the channel-dependent B1+ fields for 8 kW peak power equally distributed among the channels was calculated. To compare the SAR efficiency, again on a voxel basis, non-linear optimization (Nelder-Mead simplex search algorithm) was used. Starting from random RF shims, amplitude/phase RF shims with optimized SAR efficiency B1+/max(SAR10g)0.5 for each voxel in the three orthogonal central slices was calculated.Results and Discussion
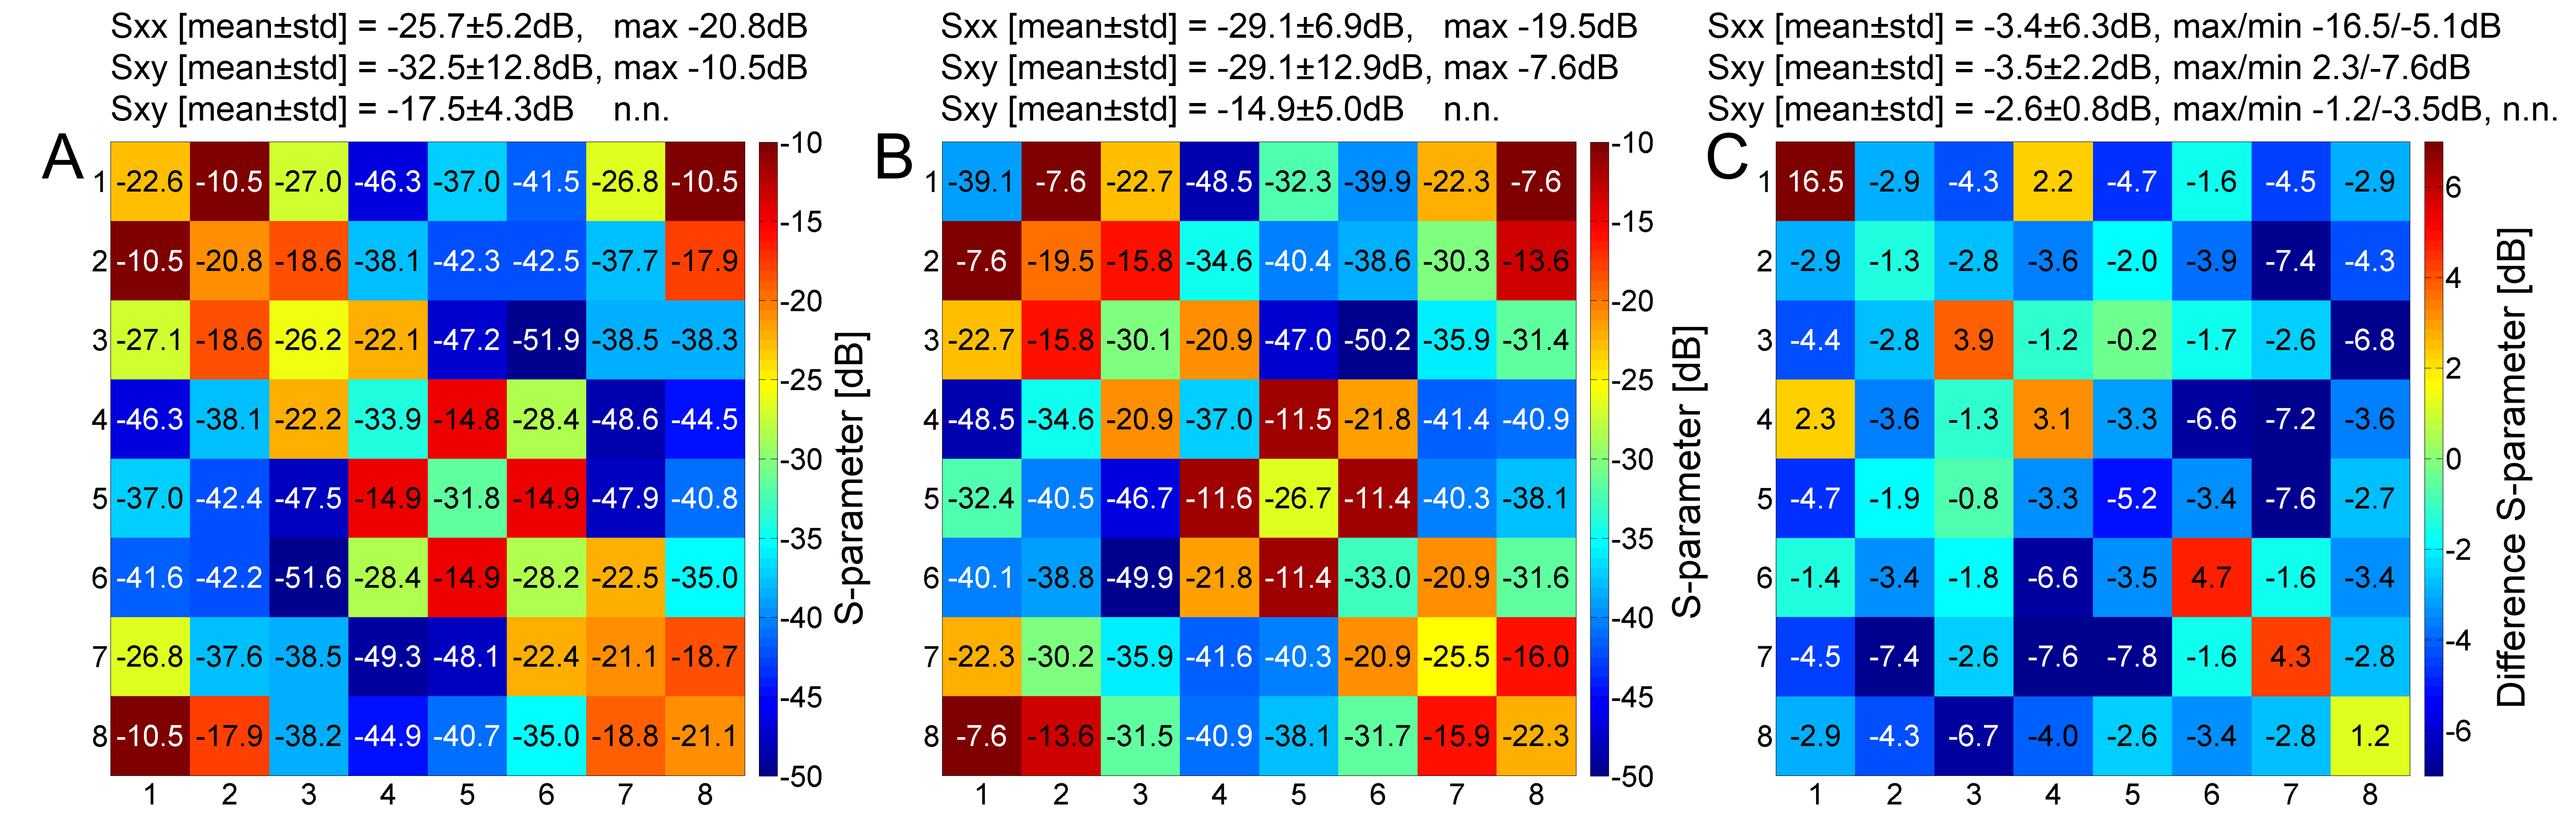
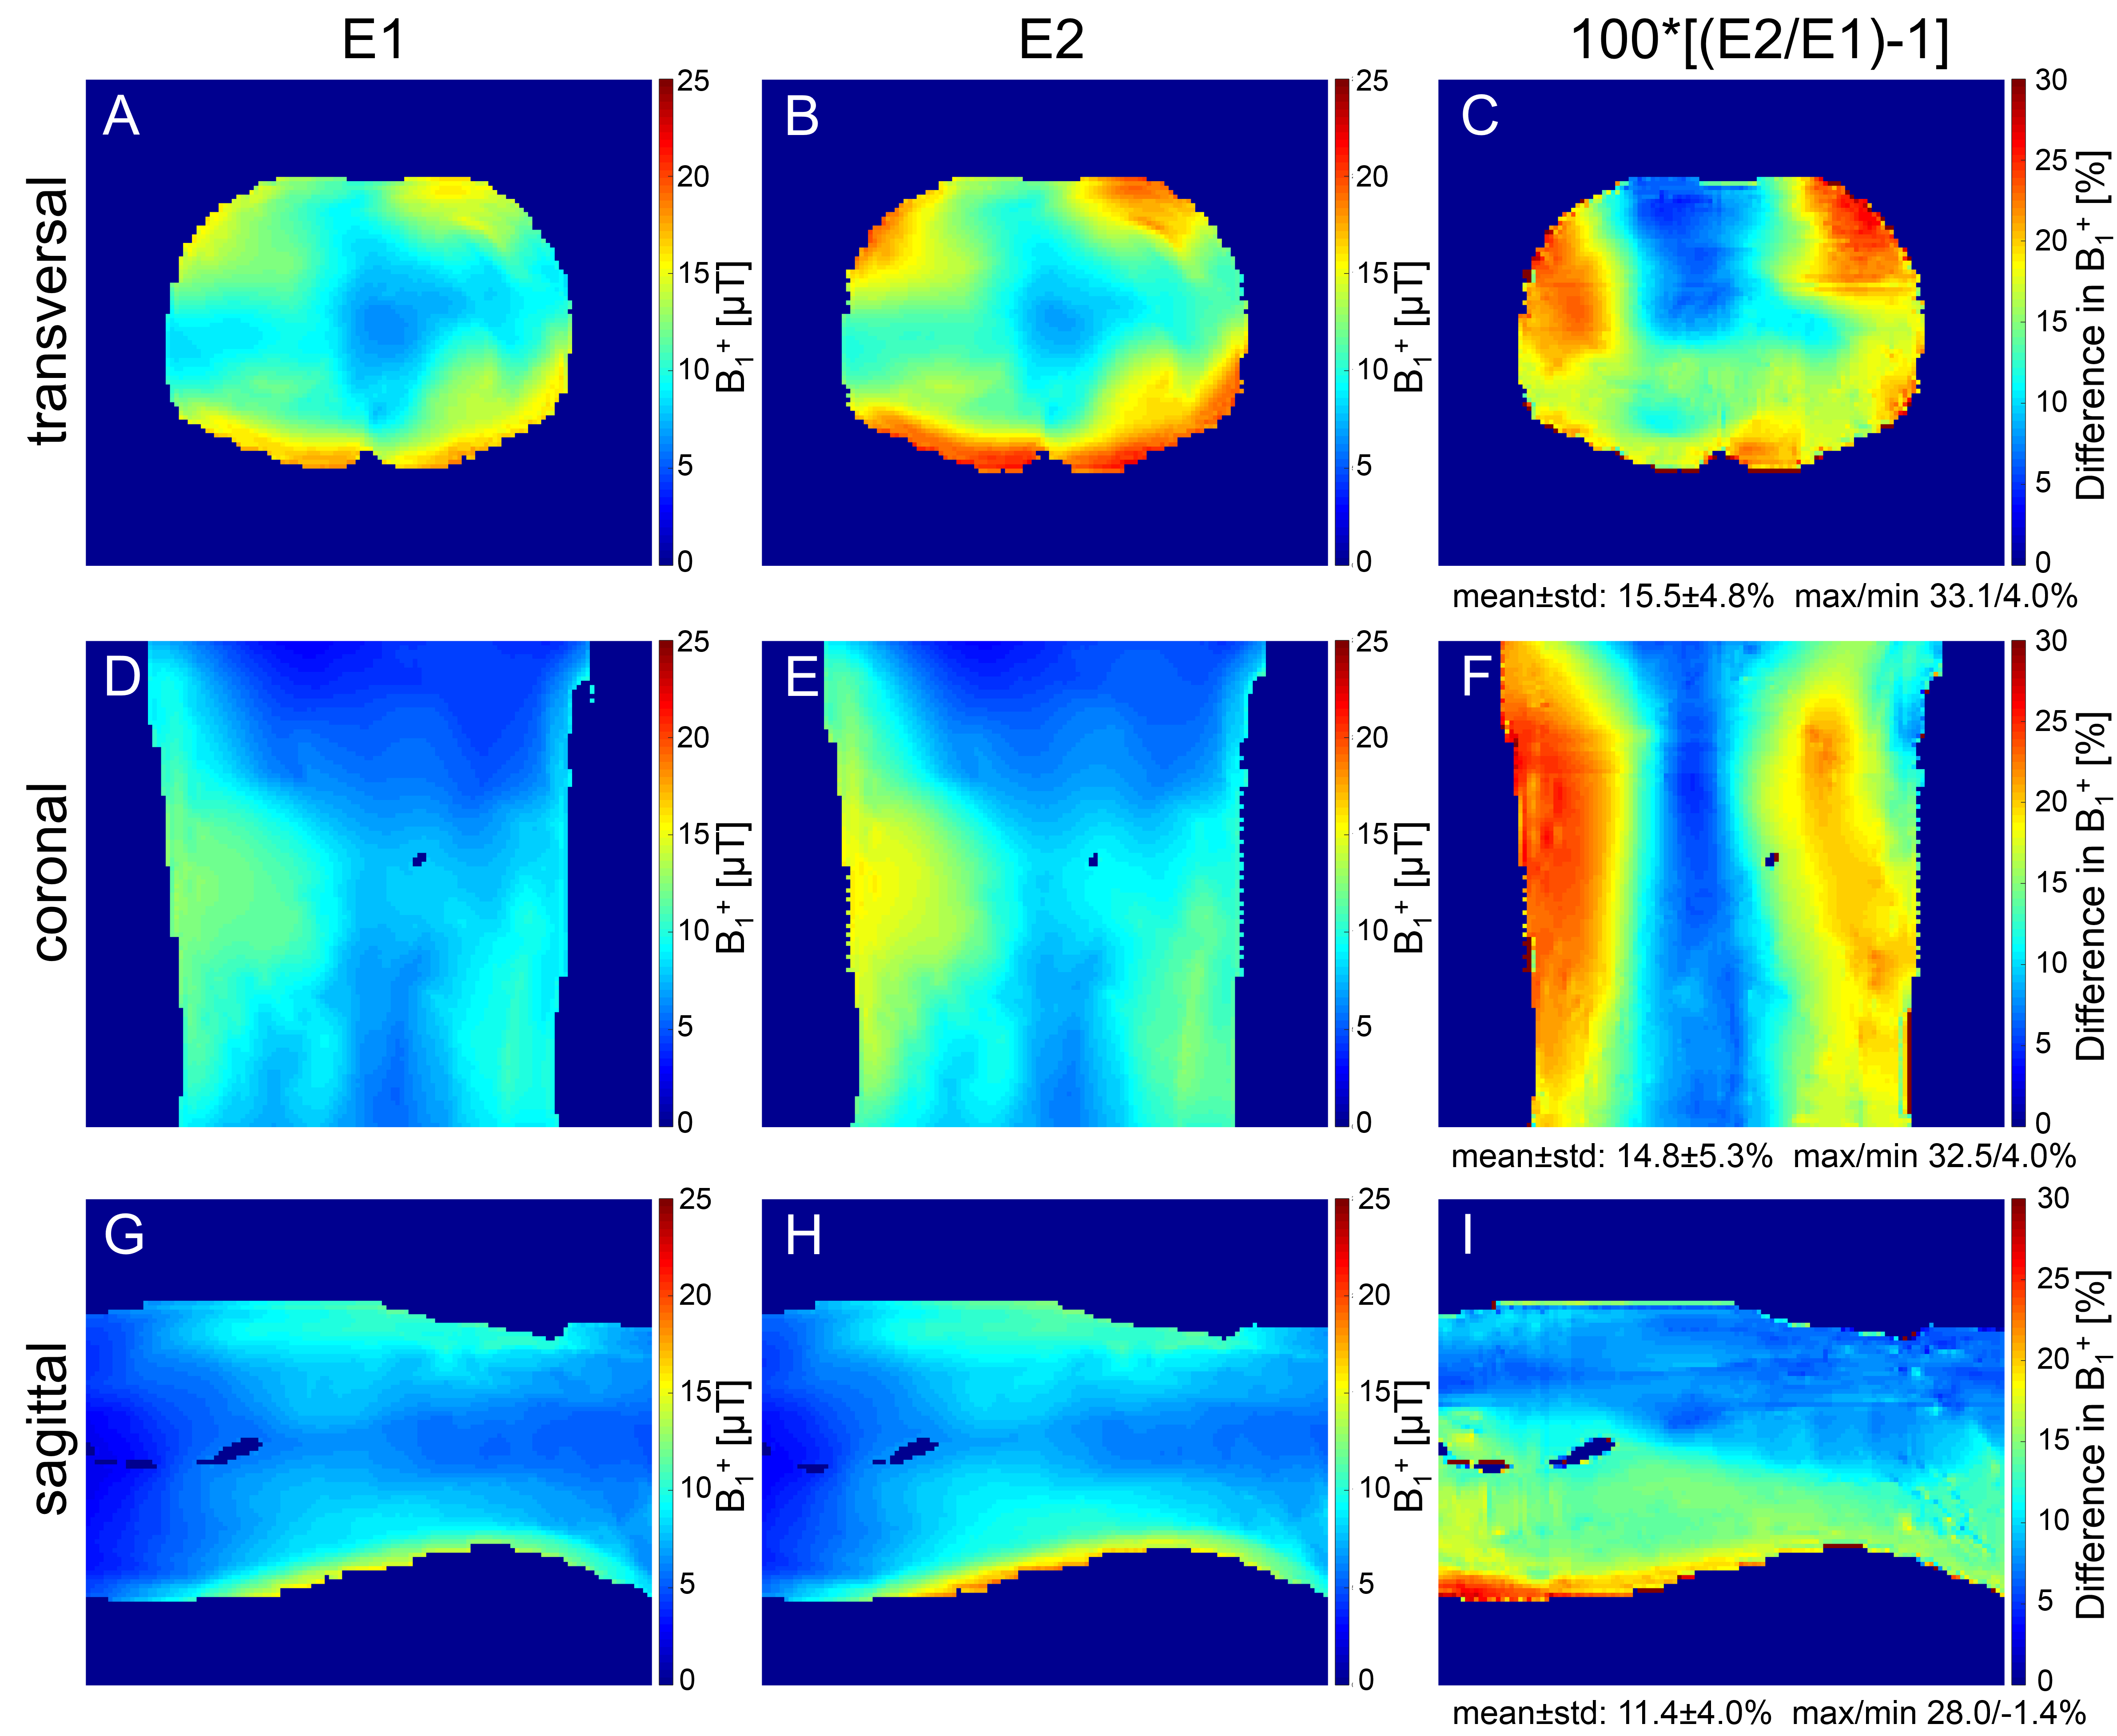
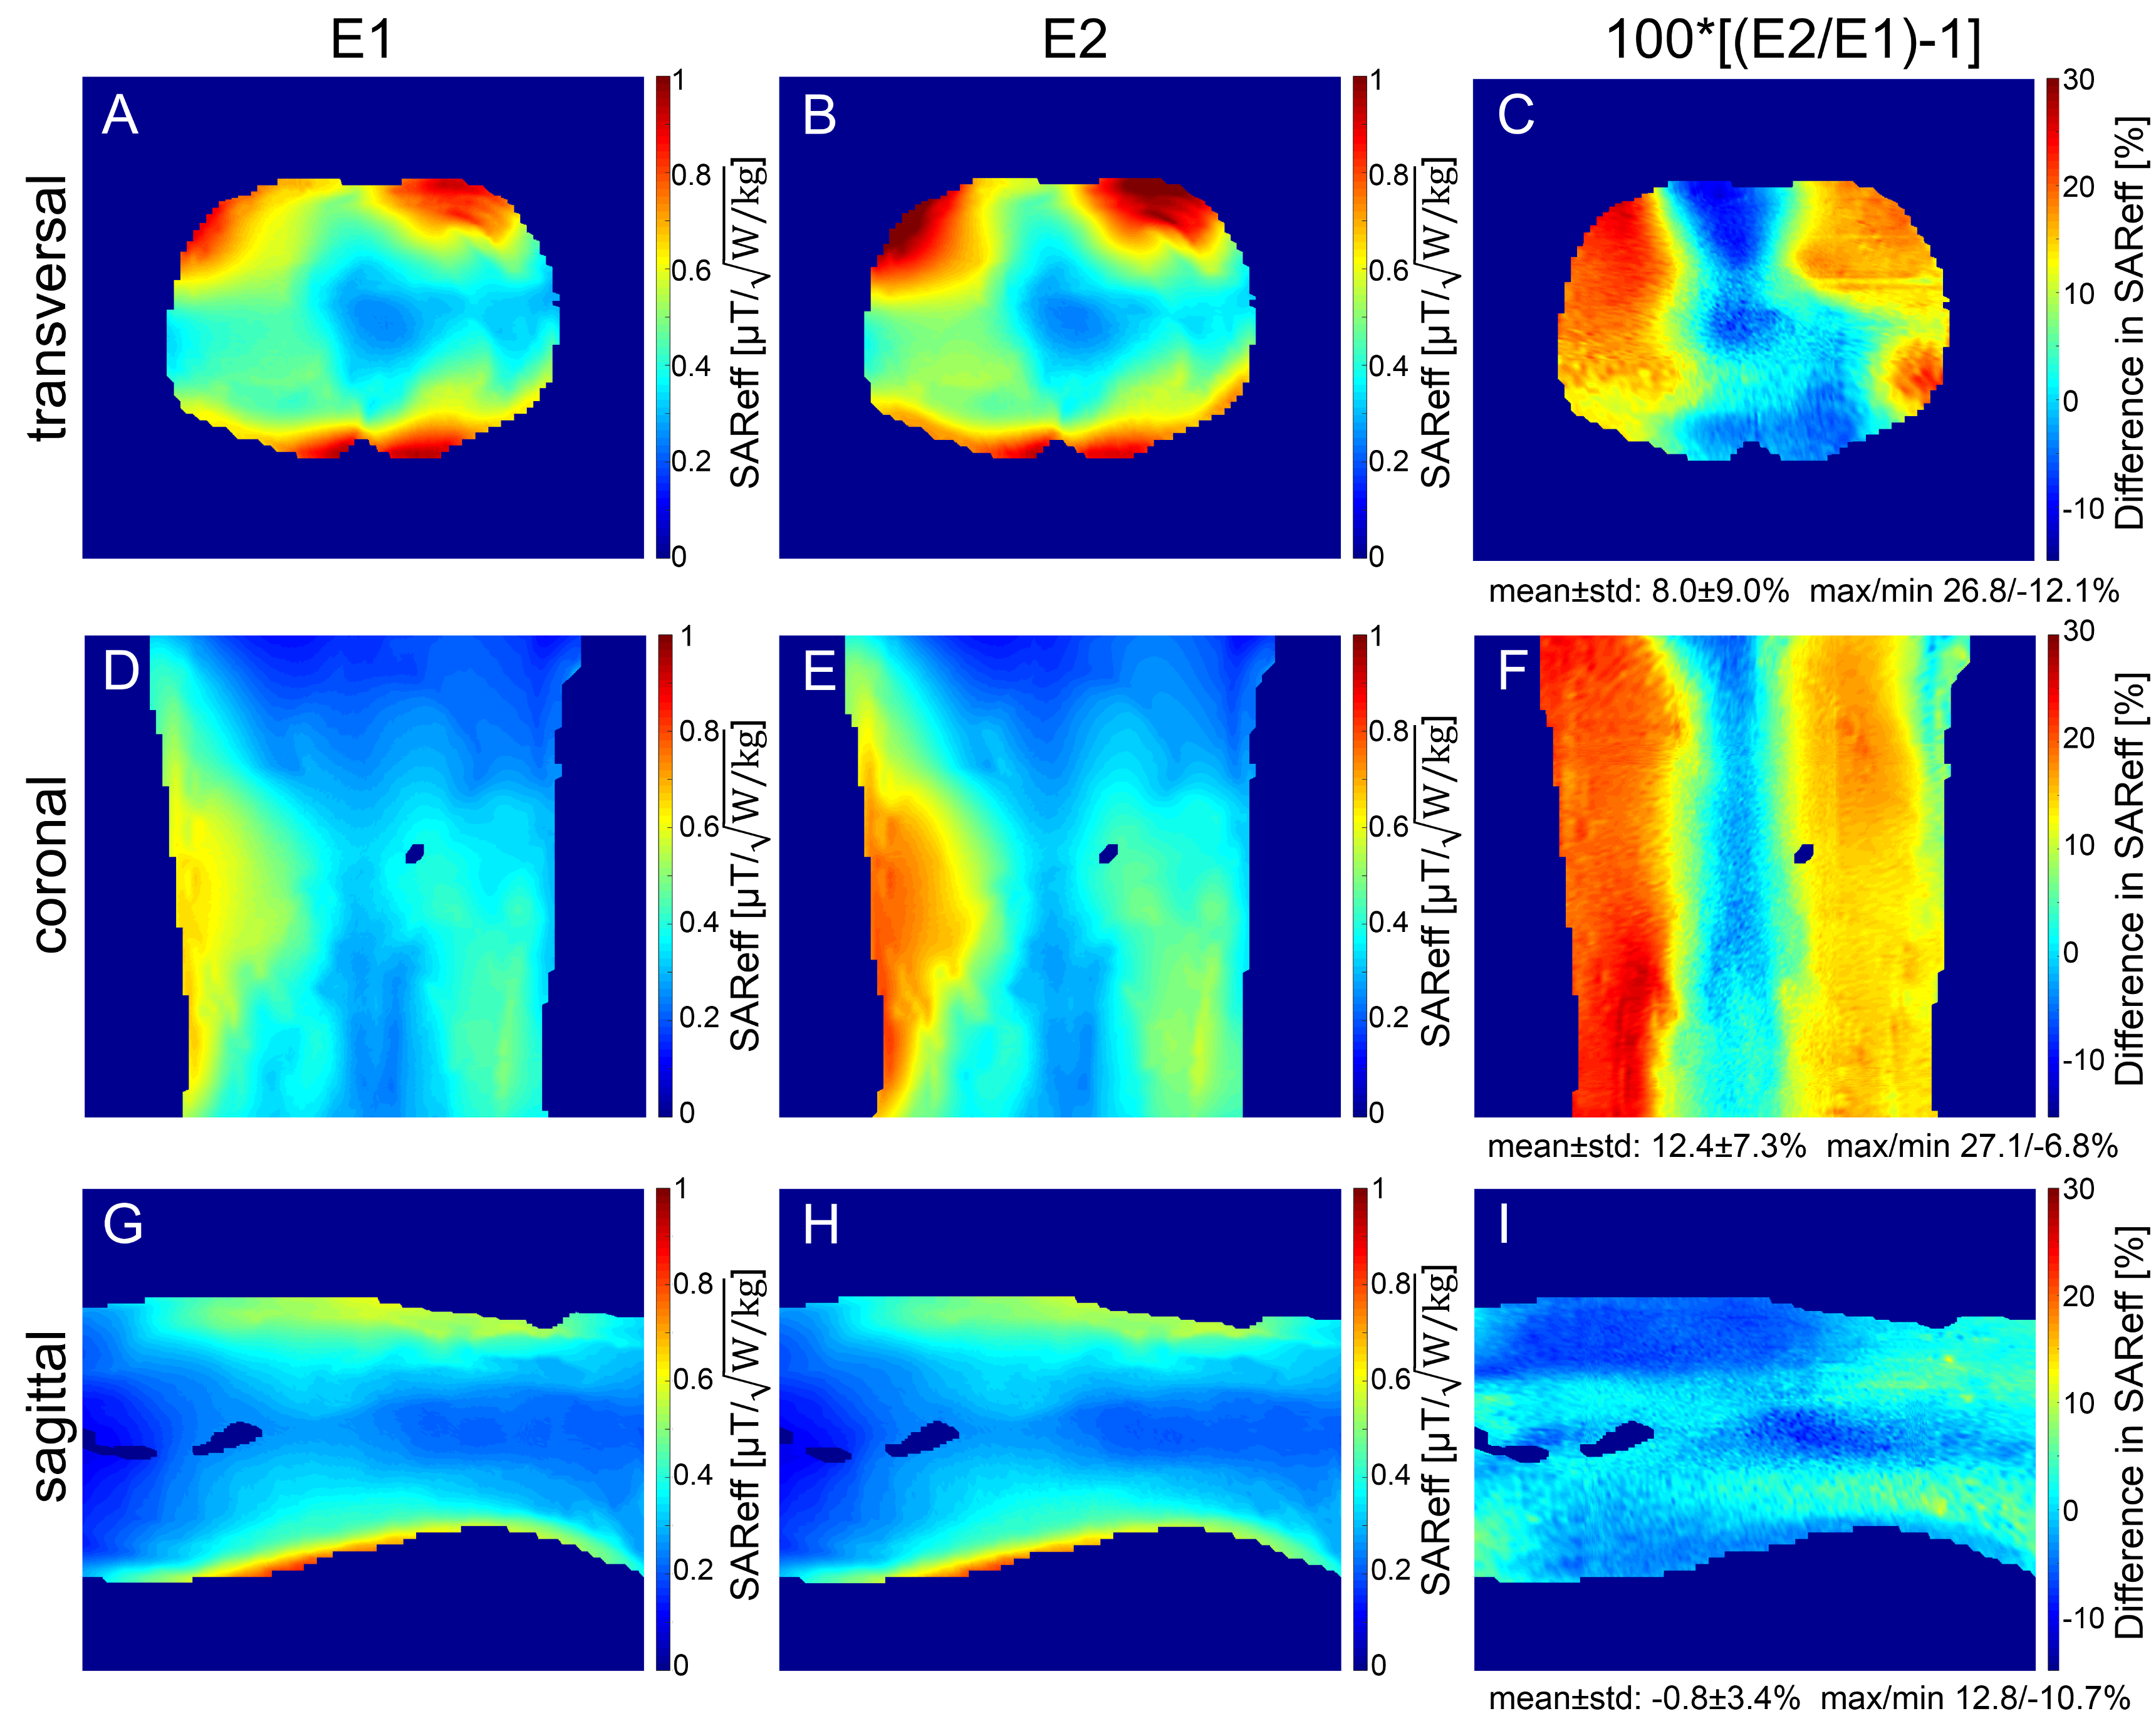
Simulations of the single coil elements and phantom showed that the total amount of the stimulated power that is absorbed in the phantom is increased by 50.4% for E2 (P = 0.1447 W) compared to E1 (P = 0.0962 W). This trend can also be observed for the simulations with a body model for the 8-channel configuration (Figure 2B,C). While the losses in the bore liner are basically equal, E2 achieves a higher amount of power dissipated in the body model. The comparison of the encoding capabilities (Figure 2D-F) shows that the arrays are approximately equivalent. Concerning S-parameters, lower coupling for the array with E1 (Figure 3A) compared to the array with E2 (Figure 3B) was observed. The difference between the S-parameter matrices (Figure 3A-B) depicts the increased coupling for E2 (Figure 3C). Figure 4 demonstrates the gain in B1+ efficiency using E2 instead of E1. This gain is maximum on the right and left side and more pronounced in the posterior than in the anterior region in transversal orientation and decreases from transversal (Figure 4A-C) to coronal (Figure 4D-F) to sagittal (Figure 4G-I) orientation. While in the central transversal and coronal orientation a gain in power efficiency for E2 can be observed in every single voxel, in sagittal orientation there are also regions where E1 performs slightly better (min -1.4%). The voxel-based comparison of the SAR efficiency (Figure 5) suggests that a gain in SAR efficiency using E2 instead of E1 is primary limited to both sides of the torso (Figure 5C,F), as was also observed for power efficiency. This explains why on average there is no gain in SAR efficiency in the sagittal orientation (-0.8 ± 3.4% in Figure 5I), while there is a gain of 12.4 ± 7.3% in coronal (Figure 5F) and 8.0 ± 9.0% in transversal orientation (Figure 5C).Conclusion
The presented modification of the meander element provides increased power efficiency and voxel-wise SAR efficiency. With regard to encoding capabilities, the arrays are approximately equal, while higher coupling can be observed for the modified version. Overall, it appears that the modified element may be useful for the construction of remote RF arrays at 7T.Acknowledgements
The research leading to these results has received funding from the European Research Council under the European Union's Seventh Framework Programme (FP/2007-2013) / ERC Grant Agreement n. 291903 MRexcite.References
1. Orzada S et al. ISMRM 2015. #630
2. Orzada S et al. ISMRM 2016, #167
3. Orzada S et al. ISMRM 2008, #2979
4. Rietsch S et al. ISMRM 2016, #174
5. Christ A et al. Phys Med Biol 2010;55(2):N23–38.
6. Eichfelder G, Gebhardt M. Magn Reson Med 2011;66(5):1468–76
7. Guérin B et al. Magn Reson Med 2014;73:1137–50
Figures