4301
Effect of Mismatching on the Transmit and Receive Performance of a Human Head 9.4T Tight-Fit Transceiver Phased Array.Nikolai I. Avdievich1, Ioannis A. Giapitzakis1, and Anke Henning1,2
1Max Planck Institute for Biological Cybernetics, Tübingen, Germany, 2Institute of Physics, Ernst-Moritz-Arndt University, Greifswald, Germany
Synopsis
Tight-fit multi-channel ultra-high field (UHF, >7T) transceiver (TxRx) phased arrays improve transmit (Tx) efficiency in comparison to larger Tx-only arrays. However, tight-fit TxRx-arrays may require matching for each subject. To evaluate a potential use of tight-fit TxRx-arrays without matching, we investigated both numerically and experimentally an effect of a strong mismatch on performance of a 9.4T 8-channel human head TxRx-array. We demonstrated that mismatching caused only ~5% decrease of the B1+ field, while may have stronger effect on the maximum local SAR. Additionally it also effects the SNR distribution. While overmatching favors SNR, undermatching may enhance Tx-efficiency evaluated as B1+/√SAR10g.
Purpose:
To evaluate the effect of mismatch on the transmit (Tx) and receive (Rx) performance of a human head ultra-high-field (UHF) tight-fit multi-channel transceiver phased array.Introduction:
Tight-fit multi-channel UHF (>7T) human head transceiver phased arrays (1,2) improve Tx-efficiency (B1+/√P) in comparison to Tx-only arrays, which are larger to fit Rx-only arrays inside (3). At the same time the tight-fit may cause a substantial change in coil loading due to variation in head sizes. Therefore, it is commonly accepted that transceiver arrays require subject specific tuning and matching of all array elements, which complicates use of these arrays in a clinical environment when patients with different head sizes, shapes and positions are scanned. Authors in (4) provide theoretical evidence that at UHF a mismatch can also effect the maximum local specific absorption rate (SAR), an important safety criteria. In this work, we evaluated both numerically and experimentally the effect of strong mismatch on the Tx- and Rx-performance of a human head 9.4 T tight-fit transceiver phased array.Methods:
For our evaluation we used a previously constructed 8-channel single-row surface loop human head 9.4T transceiver phased array (Fig.1), which had the following dimensions: width (left-right) - 20 cm, height (anterior-posterior) - 23 cm, length - 10 cm (2). Evaluation included electromagnetic (EM) simulations of the transmit B1+ field and SAR, as well as experimental measurements of the B1+ and SNR distributions. Experimental data were acquired on a Siemens Magnetom 9.4T human imaging system using a head/shoulder (HS) phantom (3), which was constructed to match tissue properties (ε = 58.6, σ = 0.64 S/m at 400 MHz). Experimental B1+ maps were obtained using the AFI sequence (5). Simulations were performed using CST Studio Suite 2015 (CST, Darmstadt, Germany) and the time-domain solver. For SAR evaluation two virtual family multi-tissue models, “Duke” and “Ella” (Fig.1), were used. In each measurement (simulations and experiments) we compared data obtained for the perfectly matched case (50 Ohm) with two strongly mismatched (to a level of -10 dB) cases, i.e. undermatched and overmatched (Fig.2).Results and Discussion:
Simulated and experimentally measured B1+ maps matched each other very well. As an example Fig.3 shows experimental B1+ maps obtained using the HS phantom for all 3 matching options. The spatial B1+ distribution changes slightly across different matching conditions. However, mismatching has a notable influence on the maximum central B1+ value, which we used for comparison. Table 1 summarizes all experimental and simulated data. As seen from Table 1, in both mismatching cases a ~ 10% decrease of power deposited into the tissue is observed. This results in ~ 5% decrease of the B1+ field strength in simulations, and 2% to 8% in experiments. At the same time mismatching may produce a stronger change in the maximum local SAR10g (10g-averaged), i.e. up to 26% increase due to overmatching and up 17% decrease due to undermatching, which cause corresponding changes in Tx-performance evaluated as B1+/√SAR10g (Table 1). Mismatching also affected the SNR distribution. Interestingly, overmatching causes an increase in local peripheral SNR values up to 15% to the matched case and up to 25% as compared to the undermatched case. As an example Fig.4 shows SNR maps for both mismatching cases evaluated using the HS phantom.Conclusion:
To evaluate the potential use of UHF tight-fit multi-channel transceiver arrays without subject specific matching, which substantially simplifies physiological and clinical studies, we investigated an effect of a strong mismatch on maximum local SAR as well as transmit and receive performance of a 9.4T 8-channel human head transceiver array. We demonstrated that mismatching to the -10 dB level causes only ~ 5% decrease of the B1+ field, while it may have a much stronger effect on the maximum local SAR value. Additionally it also effects the SNR distribution. While overmatching favors SNR, undermatching may enhance Tx-efficiency evaluated as B1+/√SAR10g. Thus, even tight-fit arrays are more sensitive to matching than larger Tx-only arrays, different strategies of pre-matching can be chosen depending on the requirements of a specific experiment trading SNR against SAR efficiency.Acknowledgements
No acknowledgement found.References
1) Gilbert KM et al, MRM 67:1487, 2012. 2) Avdievich NI et al, Proc. ISMRM 22, 2014, 622. 3) Shajan G et al, MRM 71:870, 2014 4) Kozlov M, Turner R, Proc. 43rd European MW Conf. 2013, 708. 5) Yarnykh VL. MRM 2007;57:192.Figures
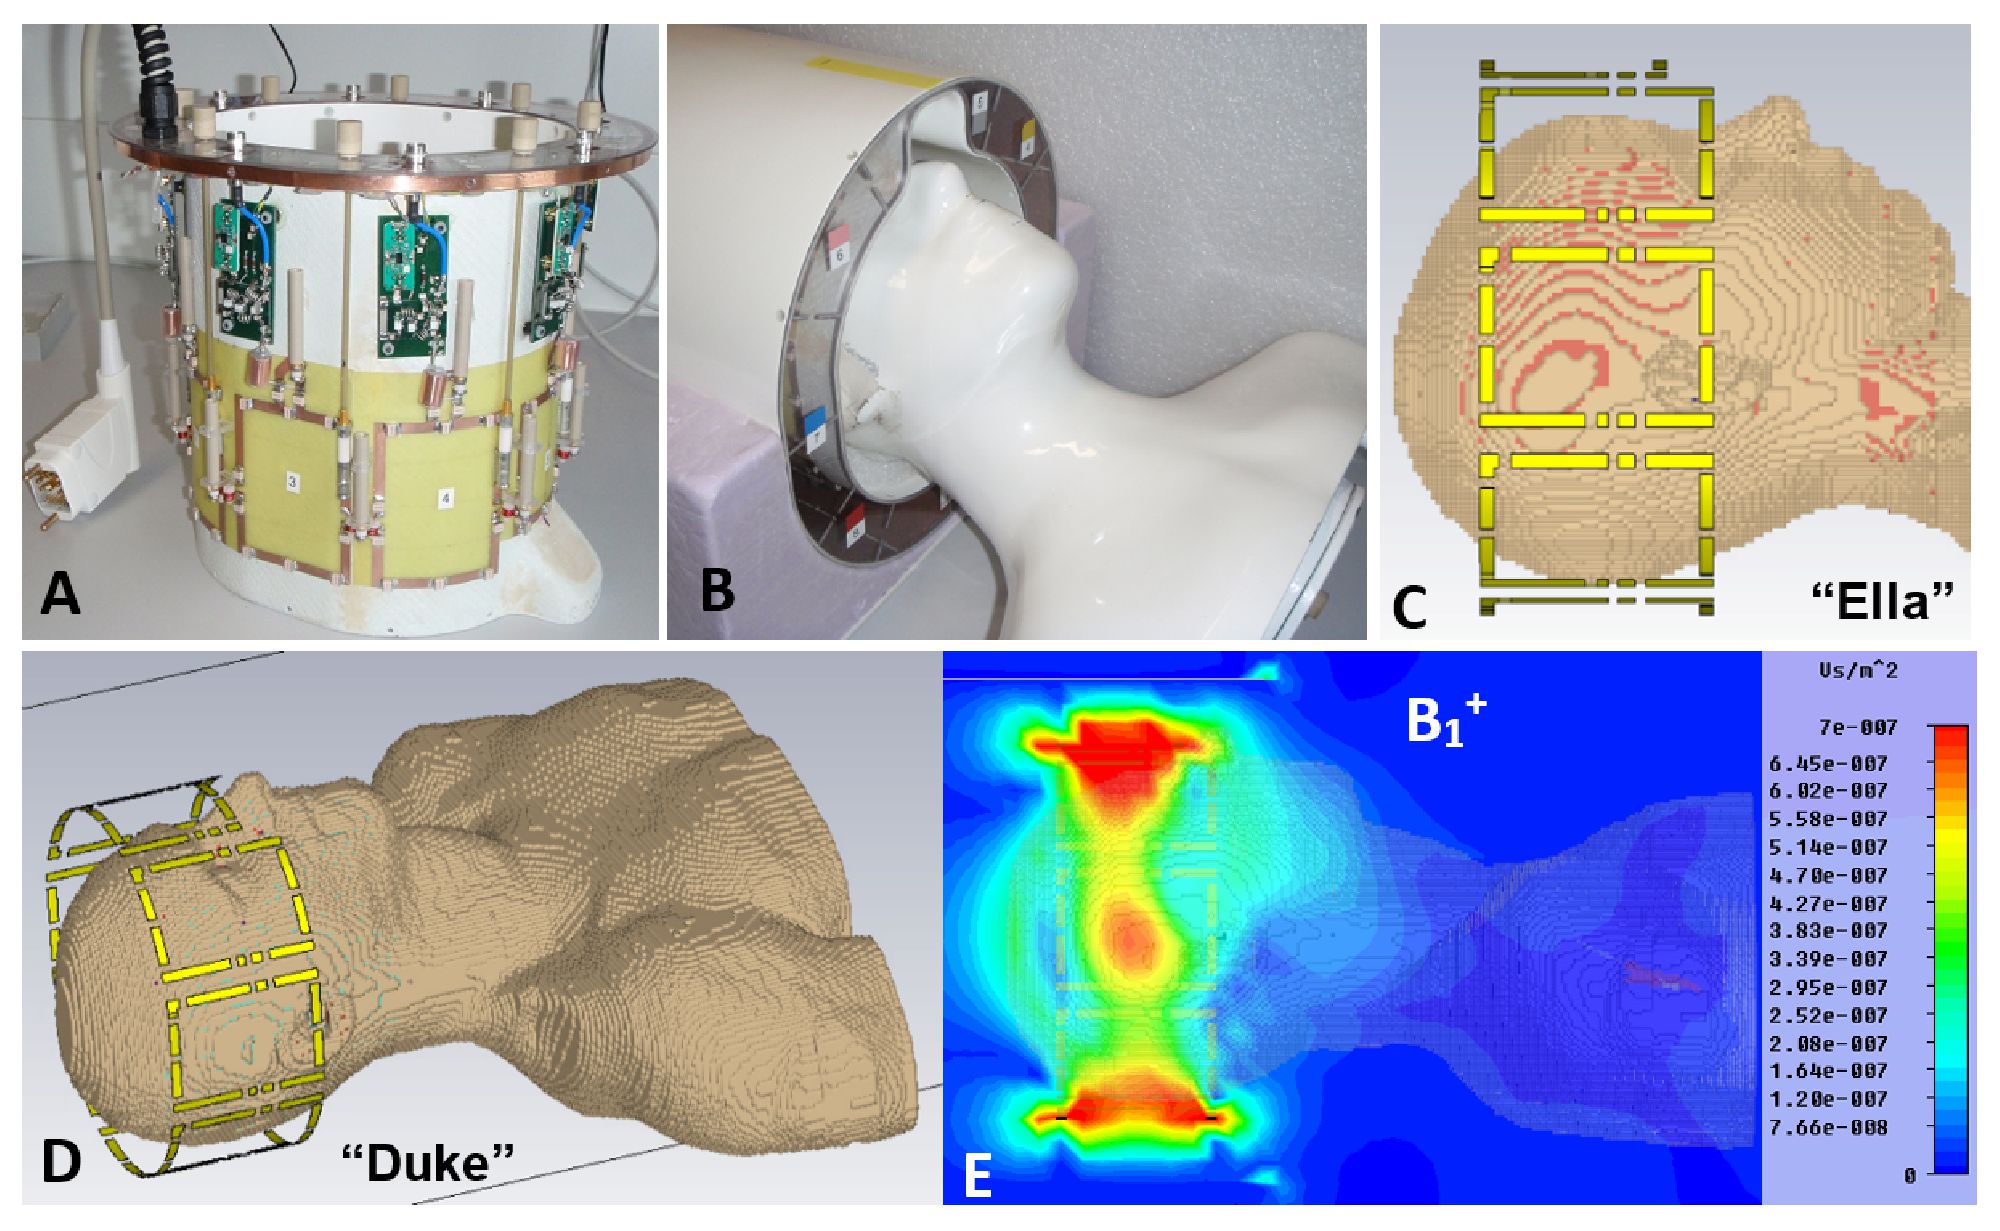
Figure 1. Photos of the phased array (A)
without the cover, (B) with the cover and HS phantom inside. CST
model of the phased array loaded by “Ella” (C) and “Duke” (D) models. E) An
example of the simulated B1+ map.
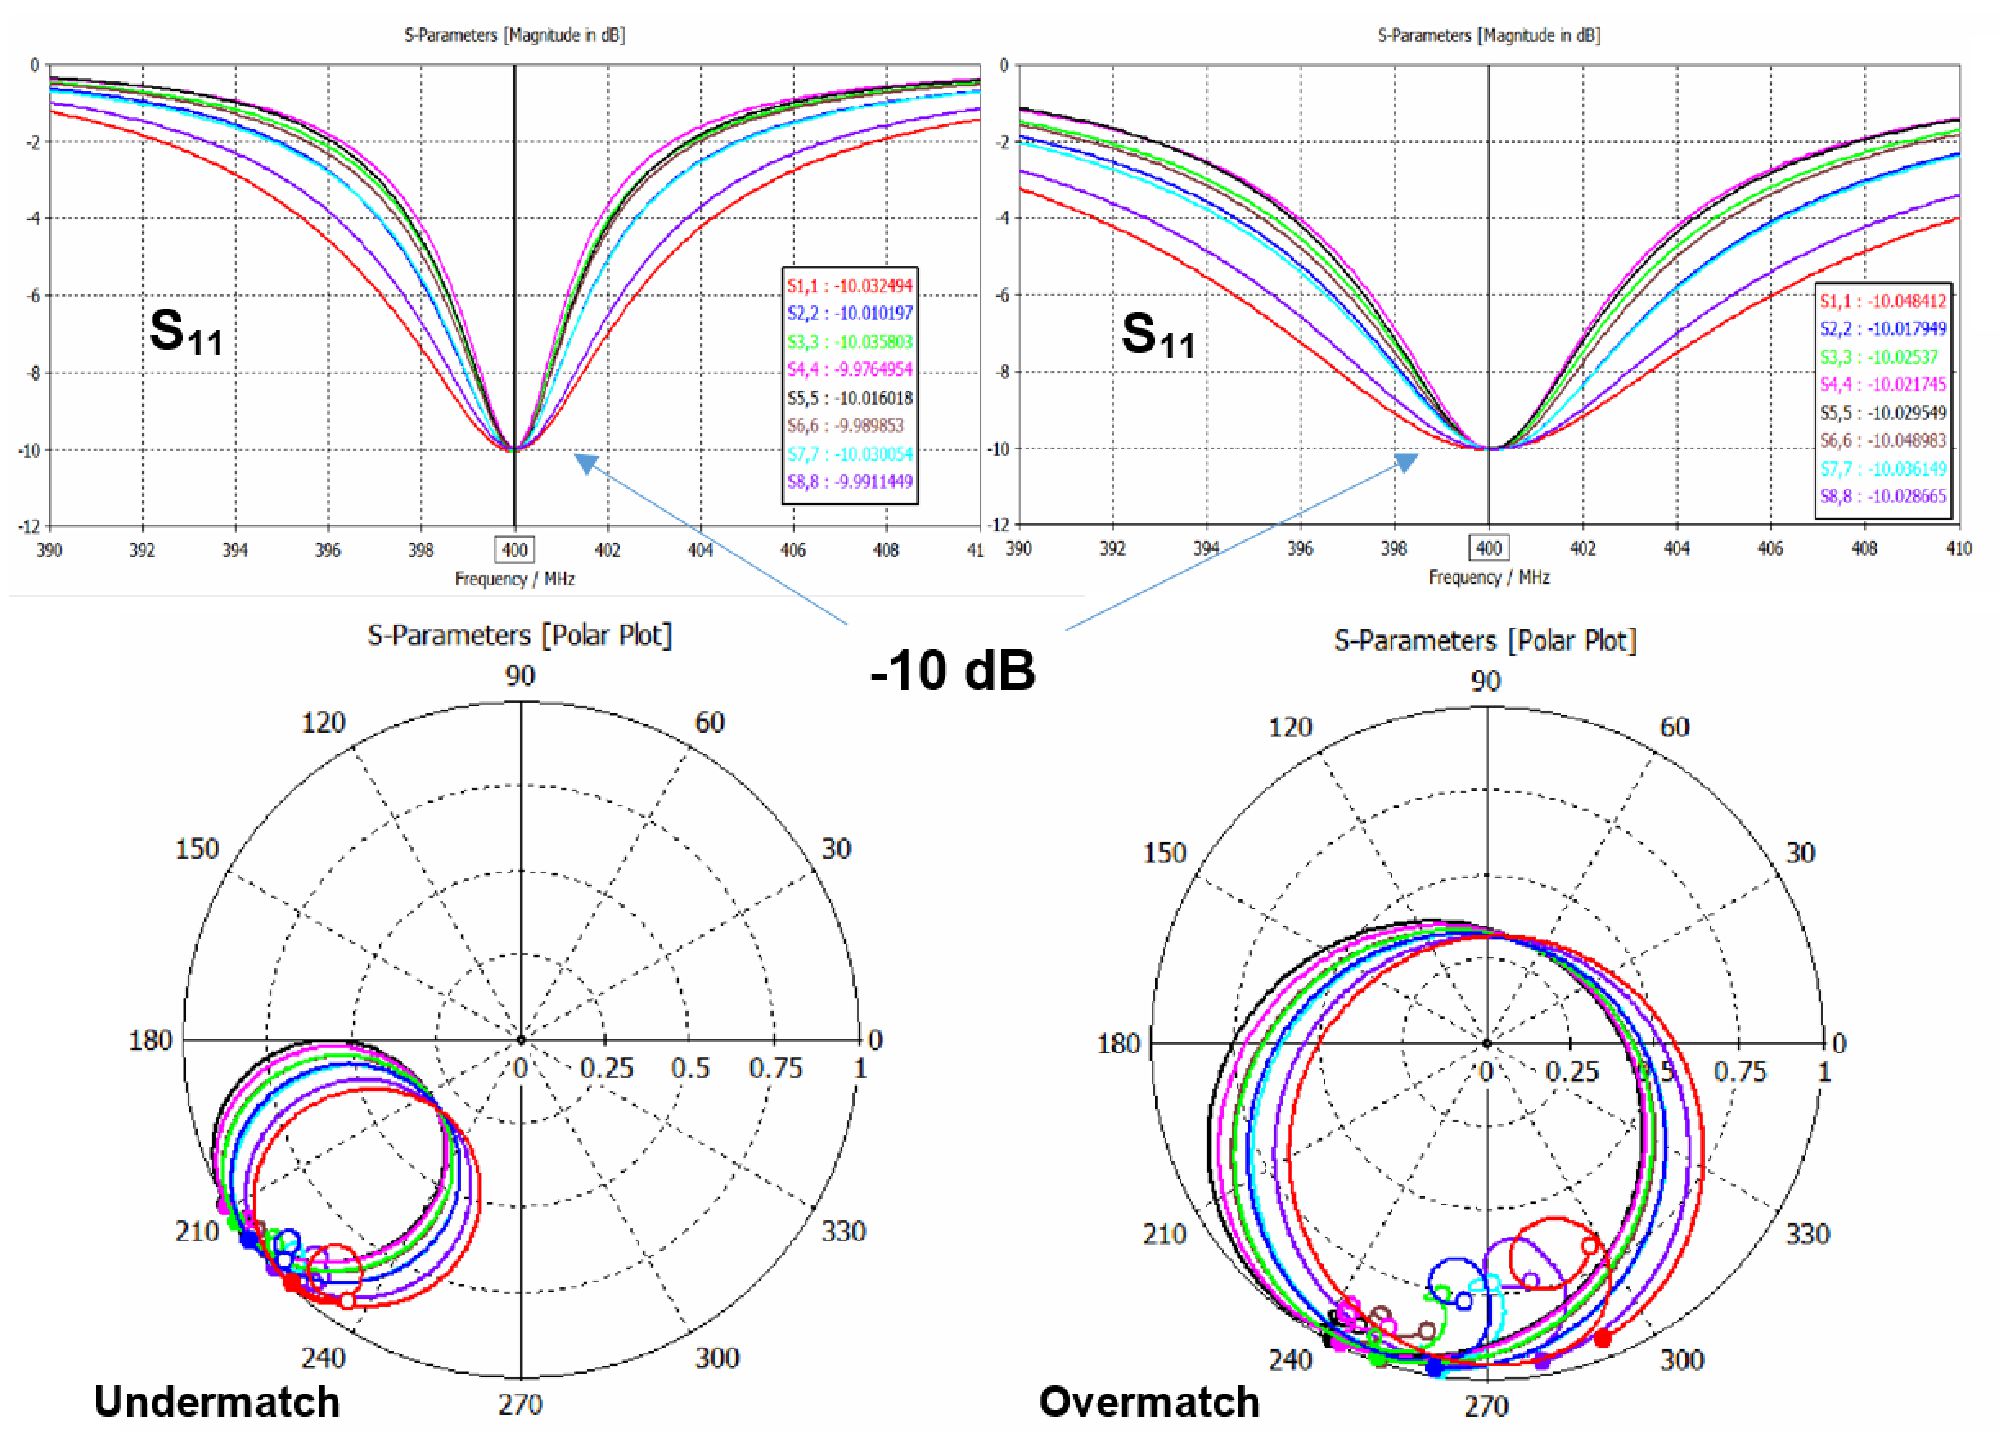
Figure 2. S11 charts for the
strongly (to the level of -10 dB) undermatched and overmatched cases.

Figure 3. Experimental central transversal B1+
maps measured for the matched, undermatched and overmatched cases using the HS
phantom.
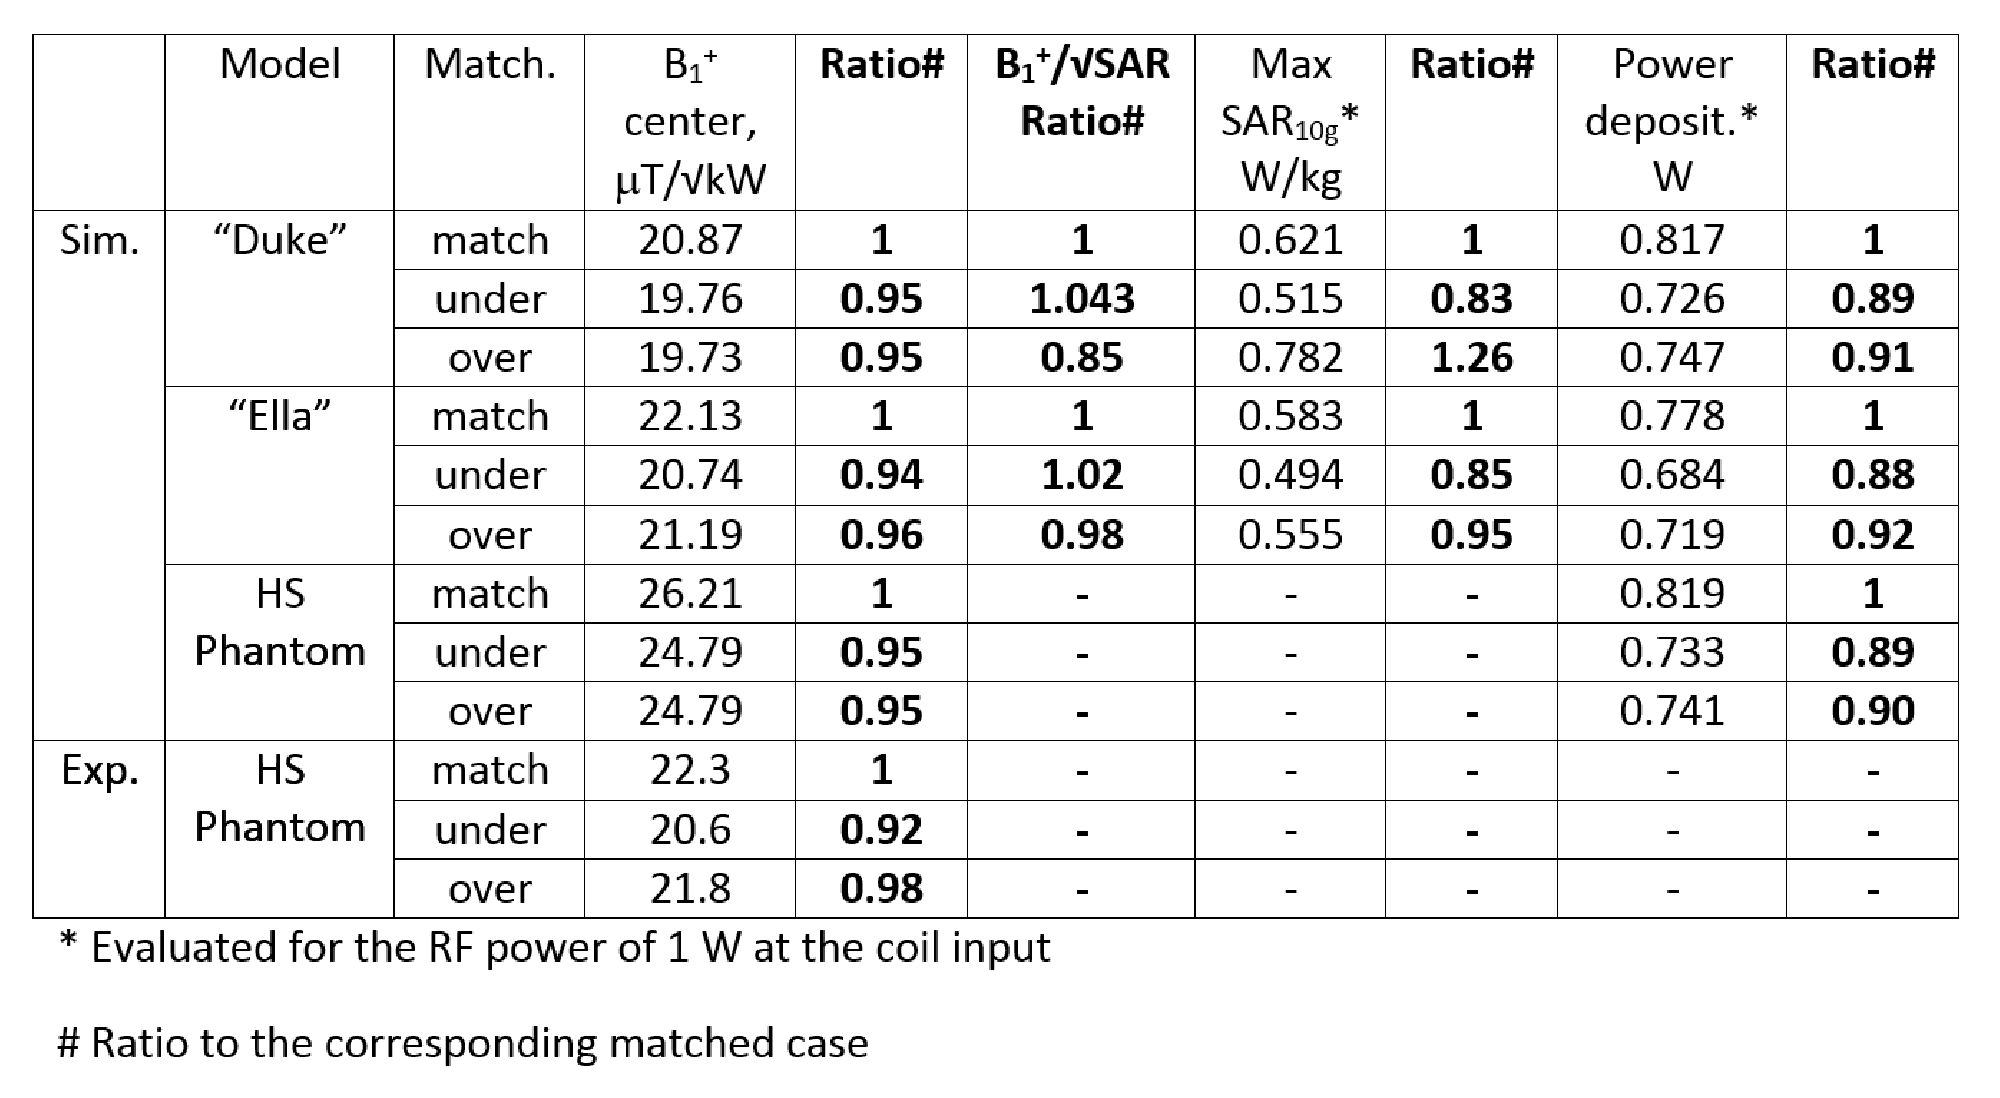
Table 1. Simulated and experimental
results.
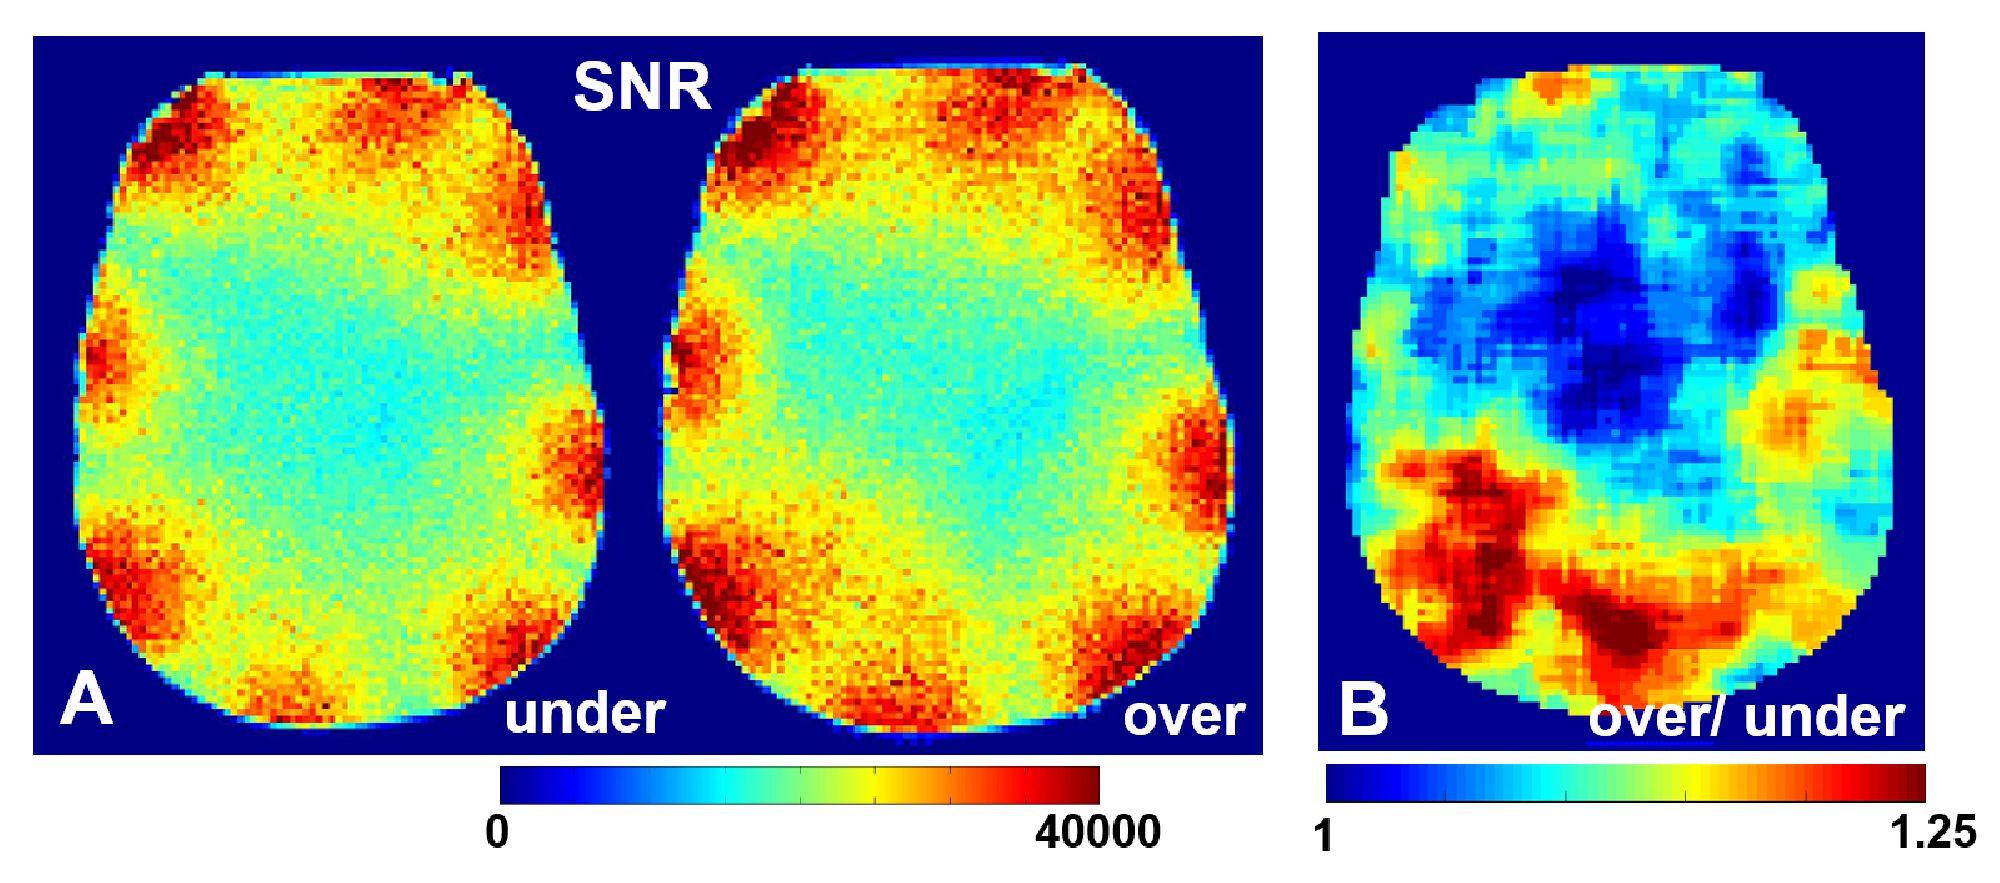
Figure 4. A) Experimental central
transversal SNR maps measured for the undermatched and overmatched cases using
HS phantom. B) Ratio of SNR maps shown in Fig.4A.