4275
Anomalous diffusion γ metrics detects physiological and microstructural changes in brain normal aging1CNR ISC UOS Sapienza University of Rome, Rome, Italy, Rome, Italy, 2SAIMLAL Dept., Morphogenesis and Tissue Engineering, Sapienza University of Rome, Rome, Italy, 3SAIMLAL Dept., Morphofunctional Sciences, Sapienza University of Rome, 4MIRCen, CEA/DSV/I2BM, Fontenay-Aux Roses, France, 5ImpAct Team, Lyon Neurosince Research Center, Lyon, France, 6Neuroimaging Laboratory, Santa Lucia Foundation, Rome, Italy
Synopsis
The intent of this study was to test the potential of parameters extracted by the so-called anomalous diffusion (AD) stretched exponential γ-imaging model, to detect microstructural modifications occurring in brain during normal aging. Conventional DTI metrics was also considered. 27 healthy volunteers with age range 21-77y underwent DW acquisitions. Parametric maps of Mean γ (Mγ) and γ Anisotropy (γA) were obtained and a quantitative analysis was carried in different regions of White and Deep Grey Matter. We found that AD and DTI parameters correlations with age indicate changes in different brain regions diversifying thus aging patterns.
Introduction
Brain
is a complex system undergoing modifications, on different scales, during the entire
lifespan. Moreover, iron deposition in subcortical grey matter has been
observed in elderly subjects. Diffusion Tensor Imaging (DTI), based on Gaussian
diffusion, showed to be a useful tool for the in-vivo assessment of these
changes. AD model, based on Continuous Time Random Walk framework, is supposed
to be more feasible in detecting microstructural changes in complex systems. Furthermore,
a dependence of AD-γ
parameter on magnetic
susceptibility inhomogeneity was recently found by our group in human brain. In
this study, we compare DTI and AD-model, investigating their potential to highlight
microstructural changes due to normal brain aging.Methodological Detail
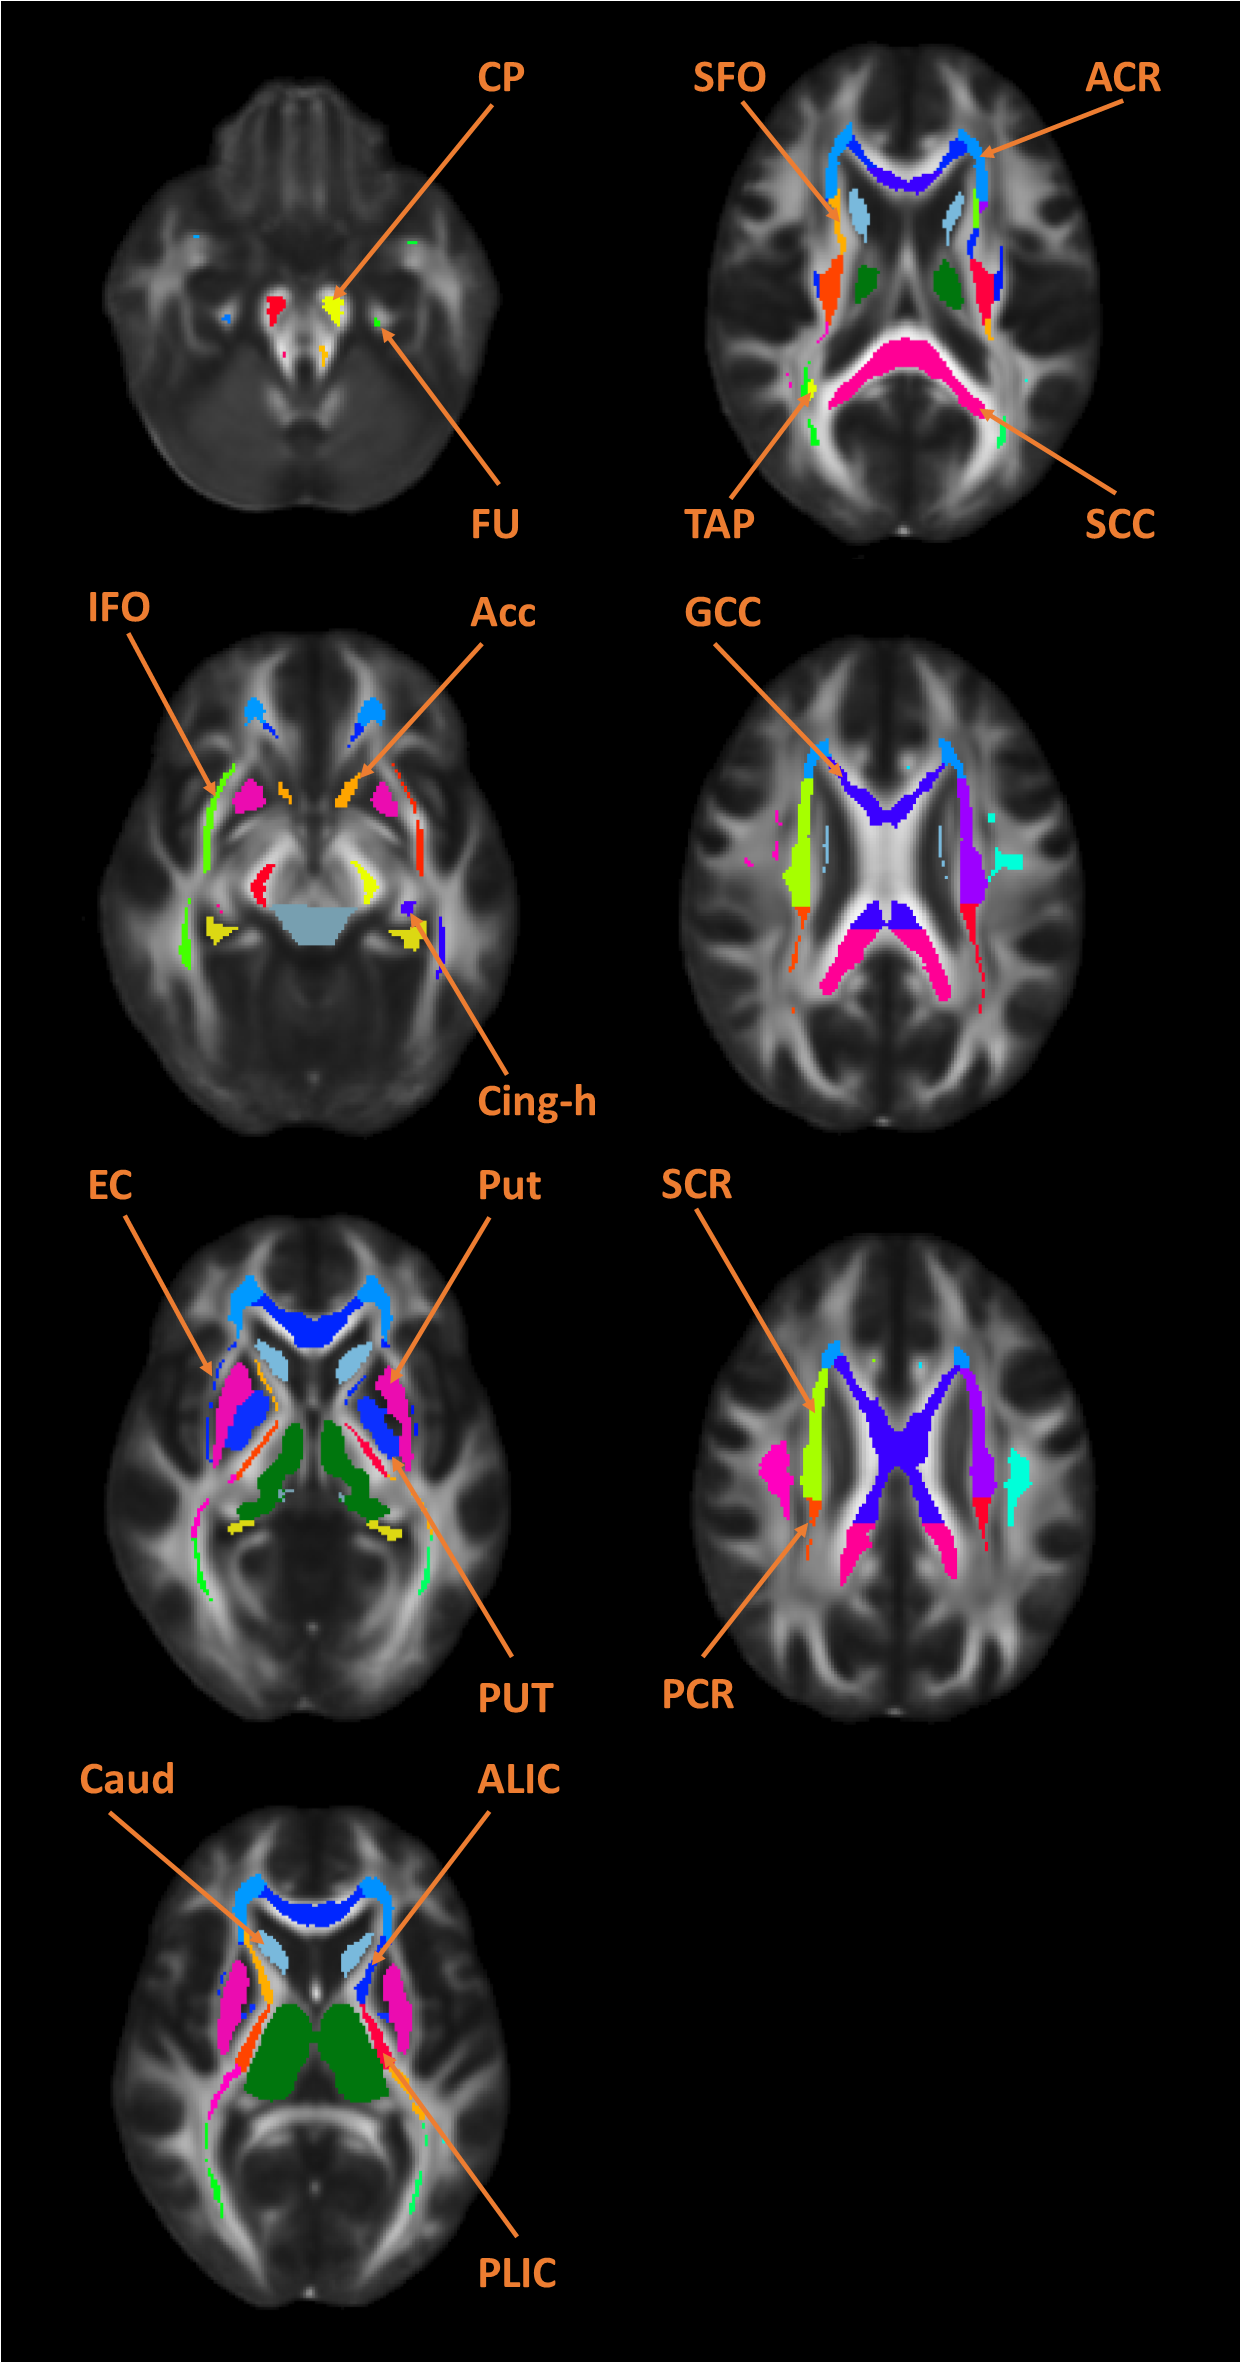
27 volunteers, age range 21-77y (15 men and 12 women, with mean age+-SD =43,8+-16,6 years) underwent MRI examination performed at 3.0T Siemens Magnetom Allegra (Medical Solutions,Erlangen,Germany). The same MRI protocol was applied to all the subjects, including whole-brain T1-weighted and Diffusion-Weighted Spin Echo-Echo Planar Imaging (DW-SE-EPI). The diffusion experiments were performed with the following parameters: TR/TE = 6400ms/107ms; Δ/δ = 107ms/35ms; bandwidth = 1860 Hz/px; matrix size = 128x128, number of axial slices=32; in-plane resolution 1.8x1.8mm2; slice thickness 3mm; number of averages=2. The diffusion-encoding gradients were applied along 15 non-collinear directions. Eleven b-values were used (200,400,600,800,1000, 1500,2000,2500,3000,4000,5000s/mm2) by varying the gradient strength g, plus the b=0 image with no diffusion weighting, with an anterior-posterior phase encode direction for all the scans. The acquisition time for the entire diffusion protocol was 42 minutes per subject. The images pre-processing was performed with EDDY tool. Mean Diffusivity (MD), Fractional Anisotropy (FA) together with the three diffusion eigenvalues and eigenvectors (V1,V2,V2) maps were obtained by means of FSL-DTIFIT routine, considering b-values range 0 -1500s/mm2. Mγ, γA,γ//,γ┴ were obtained as described in previous work 1, by using an home-made Matlab script. The data were spatially smoothed by means of a Gaussian filter with full-width-half-maximum of 3.2 mm. The fitting function was: $$S(b)= S(0)*∏_1^3exp[-A_i b^{γ_i} (V_{ix} G_x+V_{iy} G_y+V_{iy} G_y)^{2γ_i}]$$. Where b,Gx,Gy,Gz are arrays of dimension 165x1 (where 165 derives from the product between the b-values and the diffusion-encoding directions), Ai are the generalized diffusion constants, γi, the three values of the anomalous exponent projected along the 3 main axes of the DTI reference frame1. The analysis was made in different White-Matter (WM) and Sub-Cortical-Nuclei (SCN) regions. To define WM Regions of Interest (ROIs) we first preformed TBBS tool, creating a common template for all subjects and considering the common WM tracts. Thanks to a specific atlas we individuated the different ROIs. With FIRST tool with we segmented the SCN using T1-images, and then we coregistered the parametric maps to the T1-images. The correlation between AD, DTI metrics and subjects’ age was quantified with a Pearson’s correlation test. p-values < 0.05 were considered statistically significant.
Results
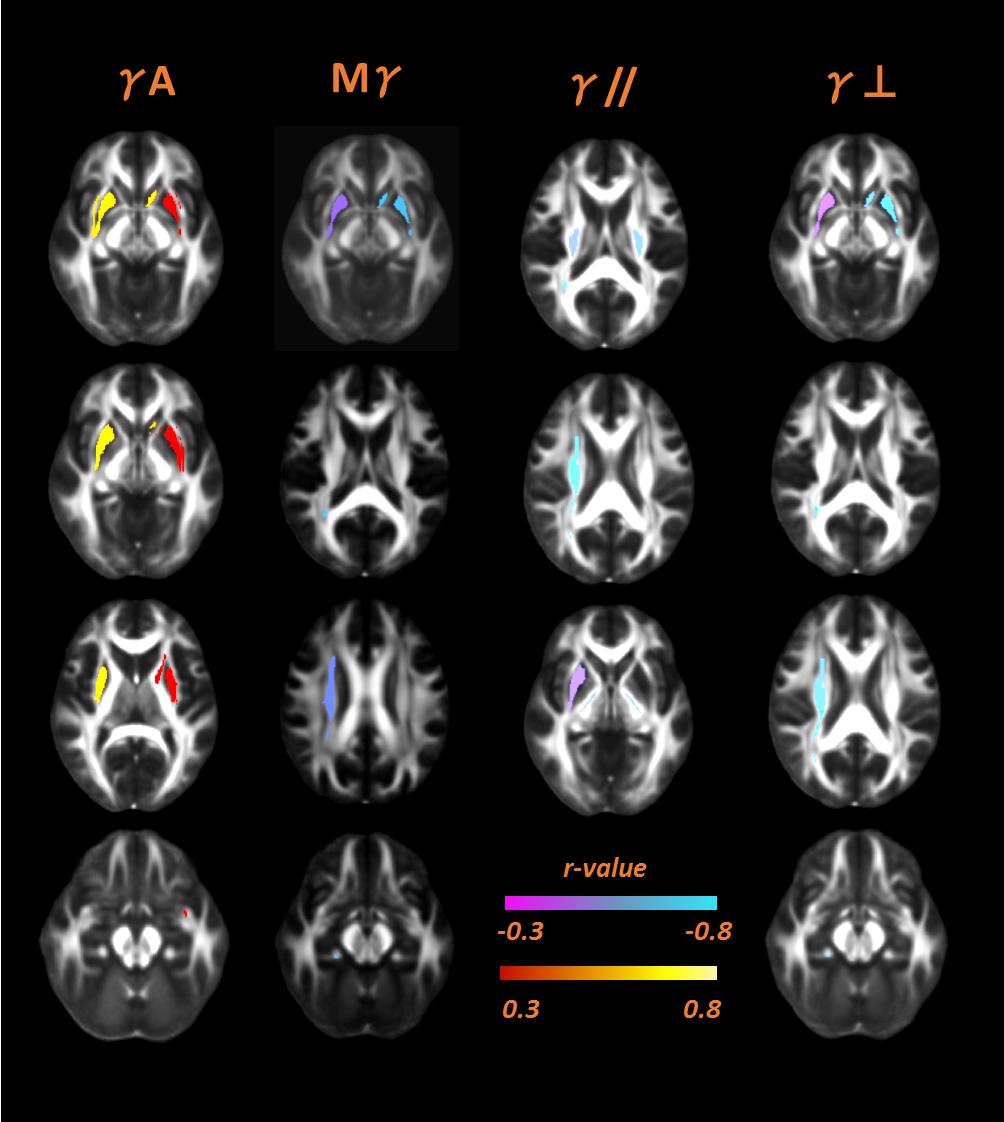
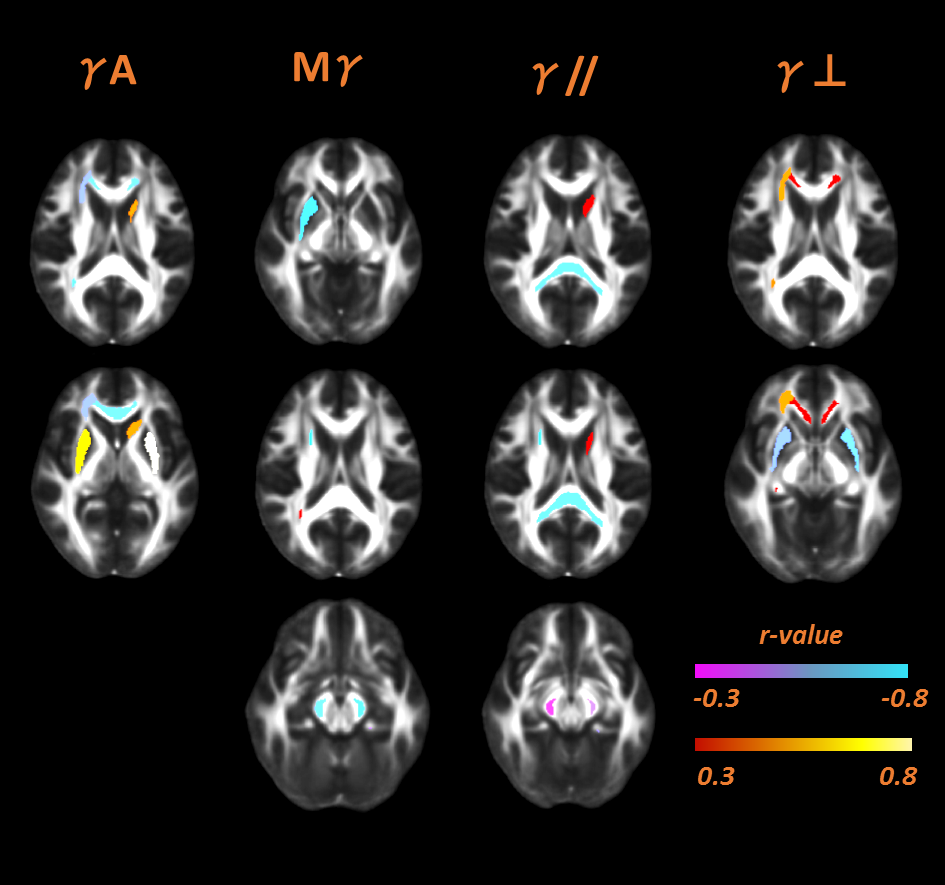
Significant correlations were found in 22 ROIs, 18 in WM and 4 in SCN. In WM, none of the correlations highlighted by AD-metrics were in the same region where DTI correlations with age were found. Mγ, γ//, γ⊥ correlated negatively with subjects' age where the correlations were significant, as well as FA, MD, D//, instead γA, D⊥ showed positive correlations with aging –figures 2,3. Regarding SCN, we found that Mγ, FA, D// increased with age, whereas negative correlations were found for all other parameters -figures 2,3.Discussions
Our results concerning DTI-metrics in SCN agree with those
found in literature. An increasing of FA together with constant MD values seems
to reflect a structural rearrangement 2. According to our previous
works3-4and our recent findings about γ dependence on magnetic
susceptibility in gray matter, we found a negative correlation between Mγ, γ⊥ and age in SCN. Indeed, with
aging, there is a progressive iron accumulation that increases magnetic
susceptibility differences in SCN5-7.
The general
decreasing trend of Mγ, γ⊥,
γ// with aging, as well as the increase of γA in WM indicates that water
diffusion becomes more compartmentalized with aging. This is consistent with
what is supposed to happen in brain microstructures during aging: an
augmentation of environment complexities, due to simultaneous microglia
selective atrophy and ipertrophy, together with the wrinkling profile of WM
fibers.Conclusion
The current study suggests that γ metrics can detect different changing patterns in brain aging compared to standard DTI parameters in WM, and it is sensible to iron accumulation due to aging in deep gray matter.Acknowledgements
No acknowledgement found.References
1. De Santis S, Gabrielli A, Palombo M, Maraviglia B, Capuani S. Non-Gaussian diffusion imaging: a brief practical review. Magnetic resonance imaging 2011;29:1410-1416.
2. Draganski, B., et al., Regional specificity of MRI contrast parameter changes in normal ageing revealed by voxel-based quantification (VBQ). Neuroimage, 2011. 55(4): p. 1423-34.
3. Palombo, M., et al., Spatio-temporal anomalous diffusion in heterogeneous media by nuclear magnetic resonance. J Chem Phys, 2011. 135(3): p. 034504.
4. Capuani, S., et al., Spatio-temporal anomalous diffusion imaging: results in controlled phantoms and in excised human meningiomas. Magn Reson Imaging, 2013. 31(3): p. 359-65.
5. Xu, X., Q. Wang, and M. Zhang, Age, gender, and hemispheric differences in iron deposition in the human brain: an in vivo MRI study. Neuroimage, 2008. 40(1): p. 35-42.
6. Li, W., et al., Differential developmental trajectories of magnetic susceptibility in human brain gray and white matter over the lifespan. Hum Brain Mapp, 2014. 35(6): p. 2698-713.
7. Aquino, D., et al., Age-related Iron Deposition in the Basal Ganglia: Quantitative Analysis in Healthy Subjects 1. Radiology, 2009. 252(1): p. 165-172.
Figures