4273
Age Related Differences in the geomT2 Relaxation Assessed Using Multi-Echo T2 Imaging1Psychiatry and Behavioral Neurosciences, Wayne State University School of Medicine, Detroit, MI, United States, 2MD/PhD Program, Wayne State University School of Medicine, Detroit, MI, United States, 3Psychology, Wayne State University, 4Institute of Gerontology, Wayne State University
Synopsis
Multi-echo T2 imaging (ME-T2) enables the investigation of multiple white matter compartments. The short T2 compartment has been the focus of recent investigations due to its specificity for the myelin water compartment. However, the much larger intra/extra cellular (IE) compartment has been relatively less explored. Here we investigate age differences in the geometric mean T2 (geomT2IEW) of the IE compartment in subcortical white matter tracts. We demonstrate that the effects of age on geomT2IEW are not uniform across white matter tracts and suggest that this index may offer additional value in the characterization of age differences of white matter microstructure.
Purpose
Multi-echo T2 (ME-T2) imaging enables gauging the contribution of water signal from different cellular and extracellular compartments in subcortical white matter (WM). A relatively short T2 relaxation component is associated with the water trapped between myelin sheaths and its magnitude is commonly expressed as a myelin water fraction. A much larger water signal from the intracellular and extracellular (IE) compartment of WM with intermediate T2 relaxation times, however, remains relatively less explored. The geometric mean T2 of water from the IE space (geomT2IEW) in WM is relatively longer1 and axonal density (AxD) lower2 in the splenium of the corpus callosum (CC) compared to the genu. Thus, geomT2IEW may reflect the influence of AxD and axonal size3 (AxS). To elucidate the complex relationship between the geomT2IEW and WM microstructure, we explored the effects of age on geomT2IEW in subcortical WM tracts, in a sample spanning the developmental and adult age range.Methods
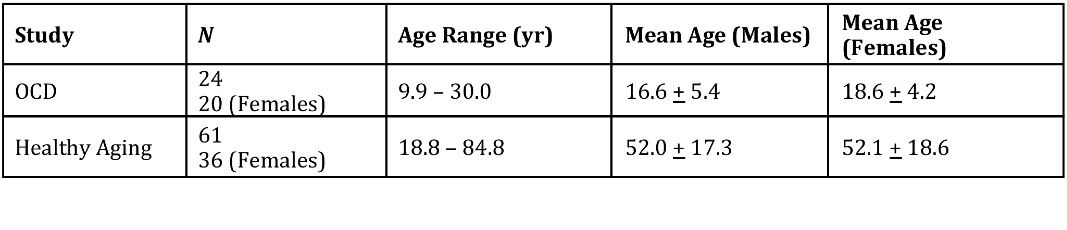
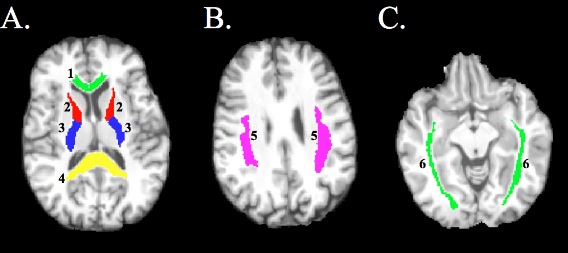
The participants were paid volunteers recruited from a longitudinal study of healthy aging, and control subjects from a study of OCD (see Figure 1 for sample description). All images were collected on 3T Siemens Verio system using either a 12 or 32-channel receive-only head coil. The ME-T2 was acquired using a 3D-GRASE sequence (32 echoes, 11 ms inter-echo spacing, TR = 1,110 ms, FOV = 220×165 mm2, matrix size= 192×144 in the axial plane and 24 5-mm thick slices). Six white matter tracts or regions of interest (ROI) were examined, which included the anterior limb of internal capsule (ALIC), posterior limb of internal capsule (PLIC), genu and splenium of the CC, superior longitudinal fasciculus (SLF), and the inferior fronto-occipital fasciculus (IFOF). The ROIs were identified using the JHU White Matter Atlas in standard space, projected into the subjects’ space, and used to extract ME-T2 data (Figure 2). Regularized NNLS was used to fit the ME-T2 data with 200 logarithmically spaced T2 values from 10-2,000 ms. The IE T2 component was defined as T2 values between 40 and 200 ms. A repeated measures general linear model (RM-GLM) was fit to the data. In the GLM, geomT2IEW was the dependent variable, ROI - a six-level within-subject factor, sex - a between-subject factor, and age, as well as age2, centered at the sample mean - continuous independent variables. Bootstrapped 95% confidence intervals, using 5,000 samples, were generated for coefficients corresponding to age and age2 terms.Results
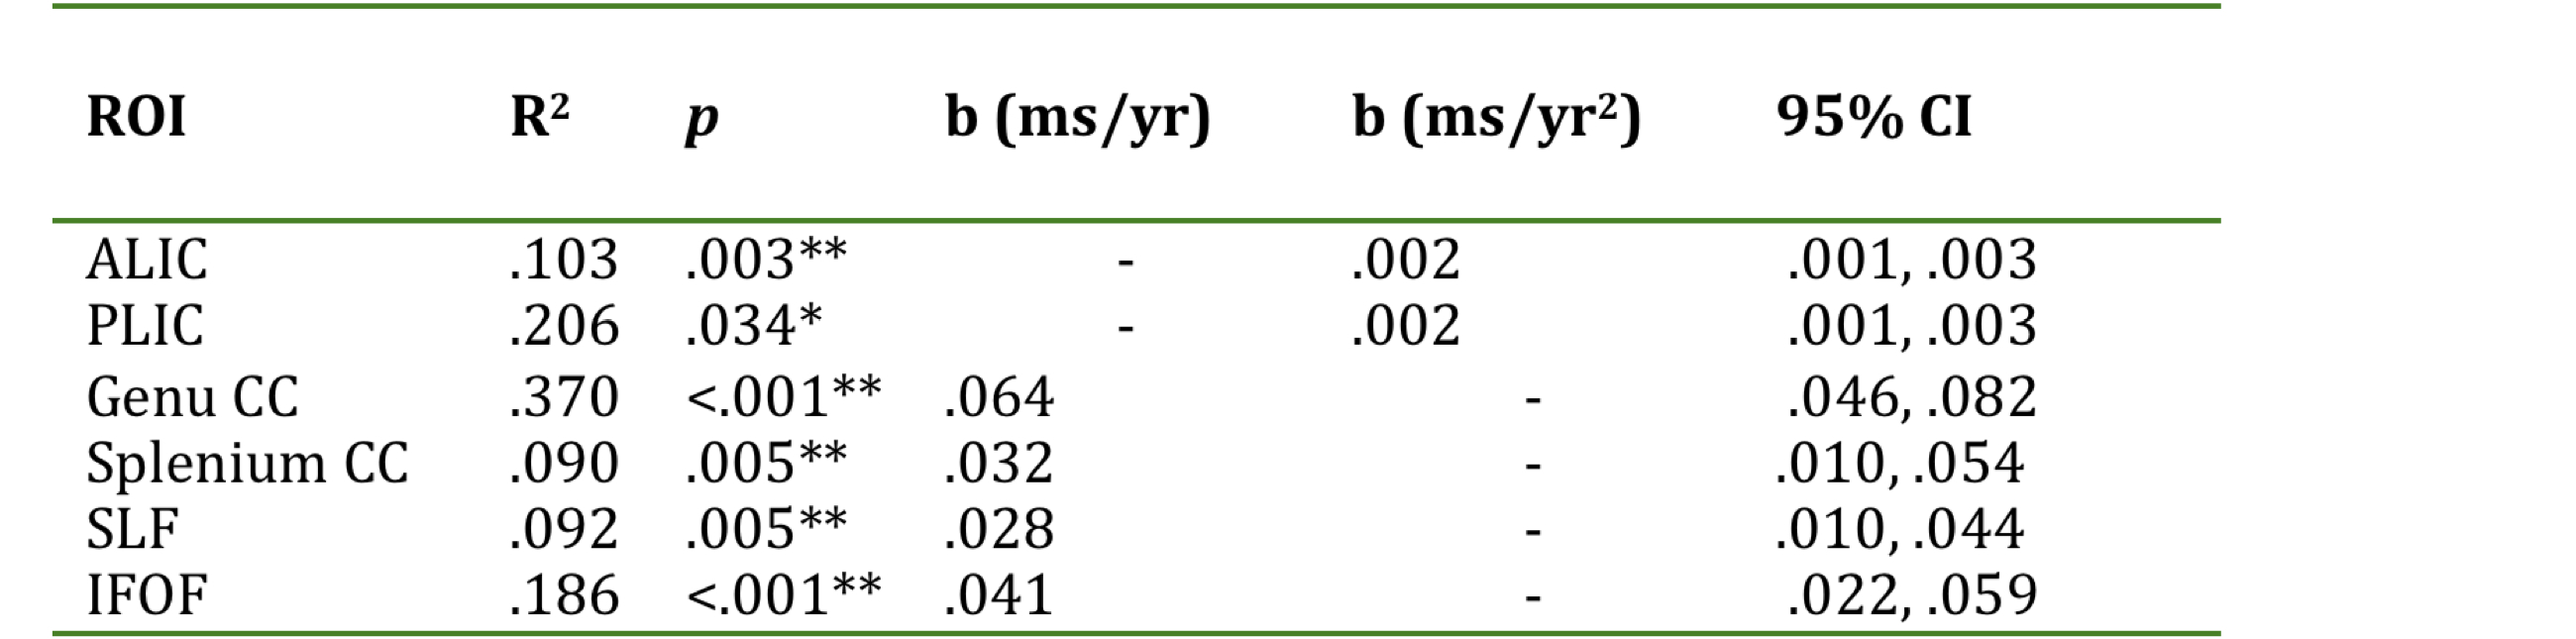
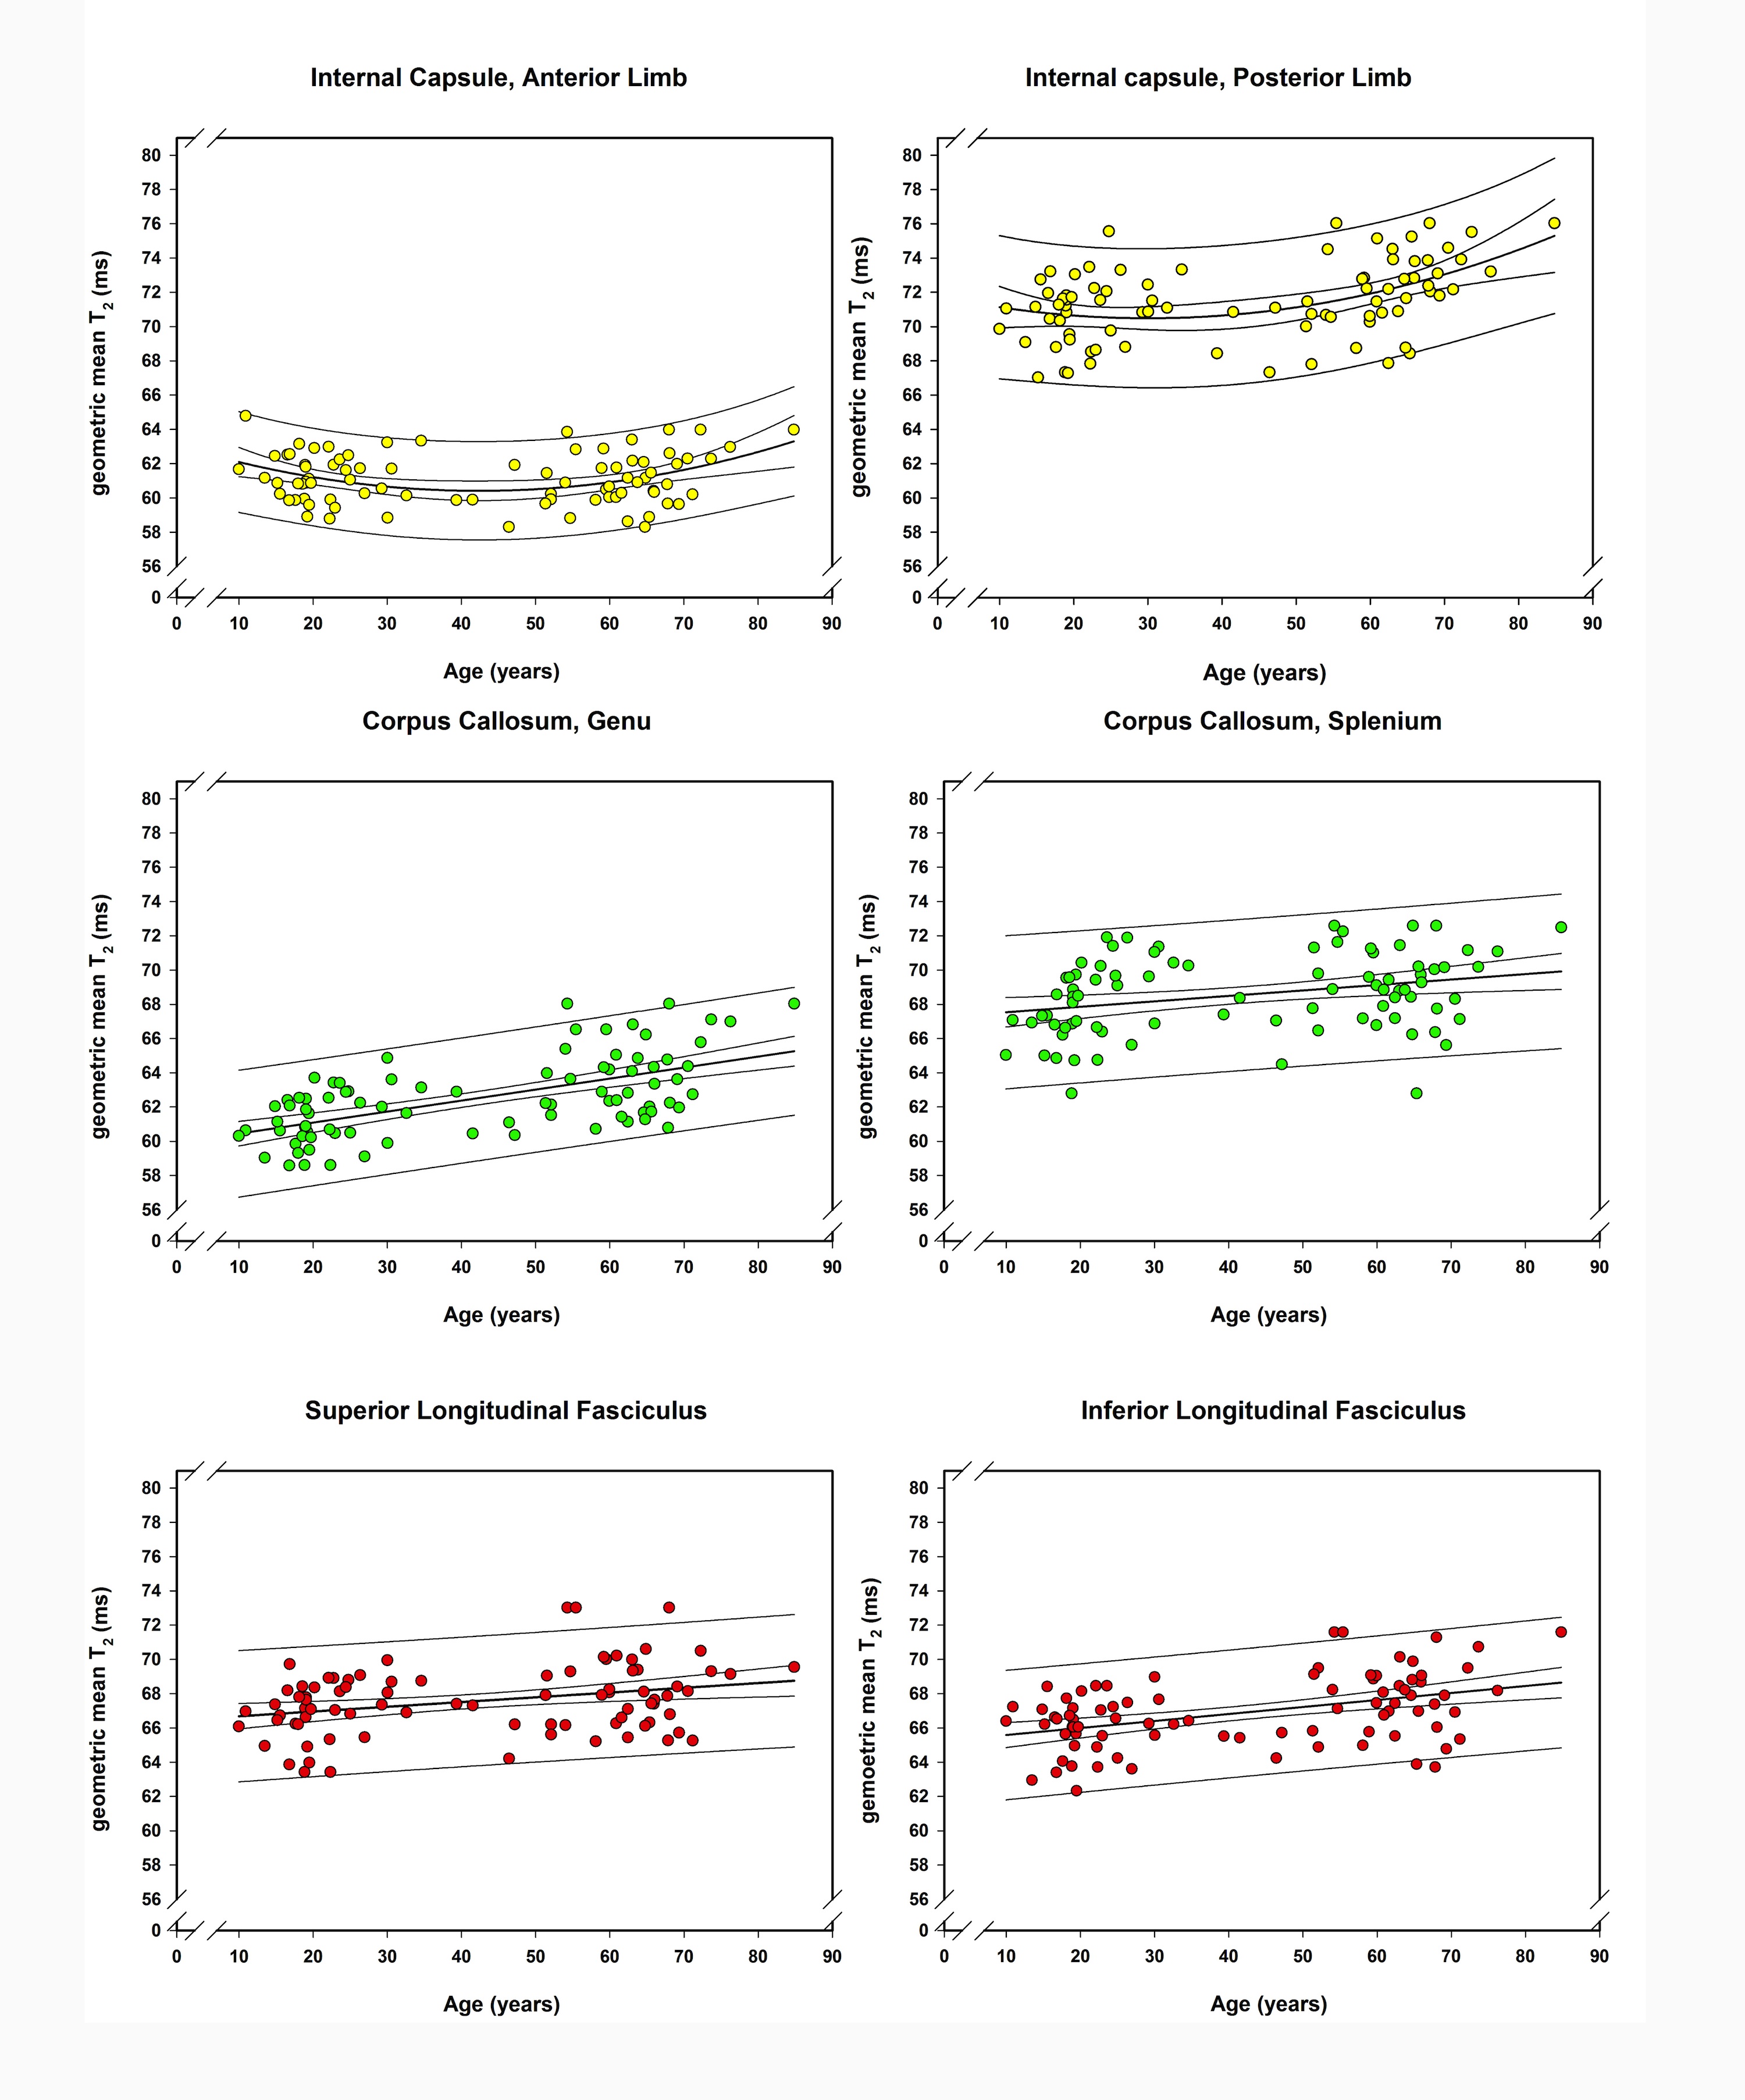
After discarding non-significant ROI × age2 × sex and ROI × age × sex interactions (F <1; F =1.764, p =.127, respectively), we found significant interactions: ROI × age [F(5,405) = 14.559, p < .001] and ROI × age2 [F(5,405) = 5.997, p < .001]. In the post-hoc analysis (see Figures 3 and 4) both age2 and age were initially entered in the regression for each ROI, and dropped if non-significant.Conclusions
We observed quadratic effects of age in the ALIC and PLIC and linear age differences in the SLF, IFOF and the Genu and Splenium of CC. Given the heterogeneous effect of age on geomT2IEW, future studies should directly evaluate the relationships between geomT2IEW of the IE compartment, AxD and AxS. Because this sample consisted of adolescents, young and older adults it is likely that age differences in geomT2IEW reflect age differences in AxD and AxS. Nonetheless, we show that the geomT2IEW provides characterization of subcortical WM microstructure that is complementary to MWF, and that the magnitude of age differences varies across WM tracts.Acknowledgements
This work was supported by a grant from the National Institute on Aging [R37-AG011230] to Naftali Raz and the Lycaki-Young Funds from the State of Michigan.References
1. Whittall KP, MacKay AL, Graeb DA et al. In vivo measurement of T2 distributions and water contents in normal human brain. Magn Reson Med. 1997;37(1):34-43.
2. Aboitz F, Scheibel AB, Fisher RS, et al. Fiber composition of the human corpus-callosum. Brain Research. 1992;598(1- 2):143-153.
3. Dula AN, Gochberg DF, Valentine HL et al. Multiexponential T2, magnetization transfer, and quantitative histology in white matter tracts of rat spinal cord. 2010; 63(4):902-909.
Figures