4268
A two-region approach to assess brain iron changes as a function of age in basal ganglia, midbrain and dentate nuclei of healthy subjects using quantitative susceptibility mapping1Magnetic Resonance Innovations Inc., Detroit, MI, United States, 2Department of Radiology, Tianjin First Central Hospital, Tianjin, People's Republic of China, 3Department of Radiology, Wayne State University, Detroit, MI, United States
Synopsis
In this work, 81 healthy subjects were recruited to assess iron deposition as a function of age in eight major brain nuclei using quantitative susceptibility mapping. By thresholding out
Introduction
As the most important transition metal in the brain, iron plays a key role in a variety of physiological interactions. However, elevated iron is also associated with neurodegenerative disease. Detection of abnormal levels of iron requires a reliable baseline of normal iron deposition in the brain. Quantitative Susceptibility Mapping (QSM) is a post-processing technique that uses SWI phase information and has proven to be a reliable MR method for iron quantification1. Using QSM, our group has recently established a sensitive and robust baseline of regional high iron content (RII) as a function of age in seven major deep gray matter nuclei of 174 healthy subjects2. In this regional analysis, any susceptibility value higher than an age-dependent threshold is considered as a high iron content voxel2. However, the dentate nucleus is not included in these 7 structures but is important to study because it has been implicated in the accumulation of gadolinium (a paramagnetic metal which acts like iron) after multiple administrations of gadolinium-based contrast agents (GBCAs)3. Therefore, the purpose of this work is to validate the regional analysis developed by Liu et al. and to assess global (i.e., iron in the entire structure) and local (high iron content region) normal susceptibility changes as a function of age in the dentate nucleus2.Methods
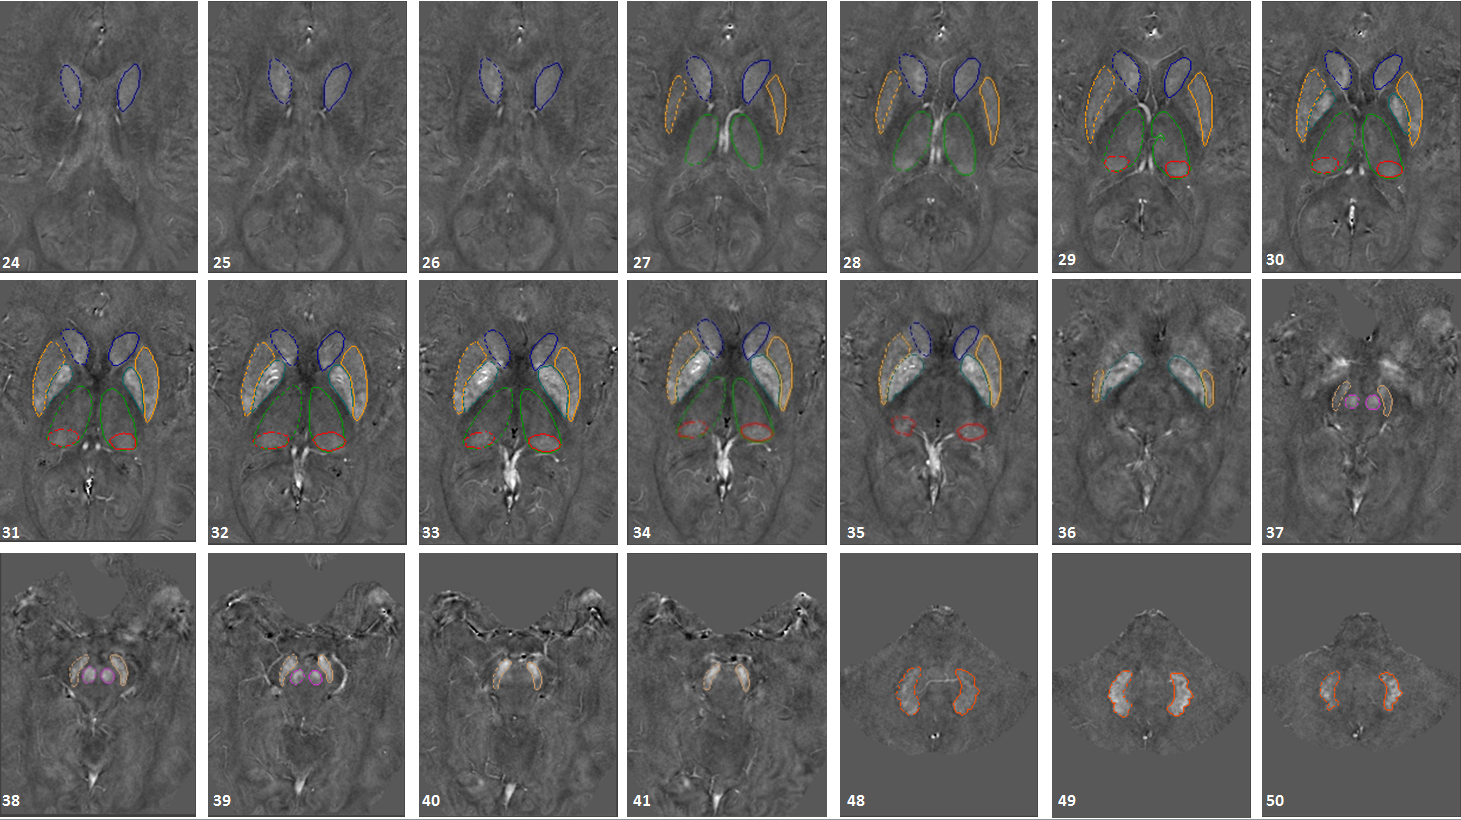
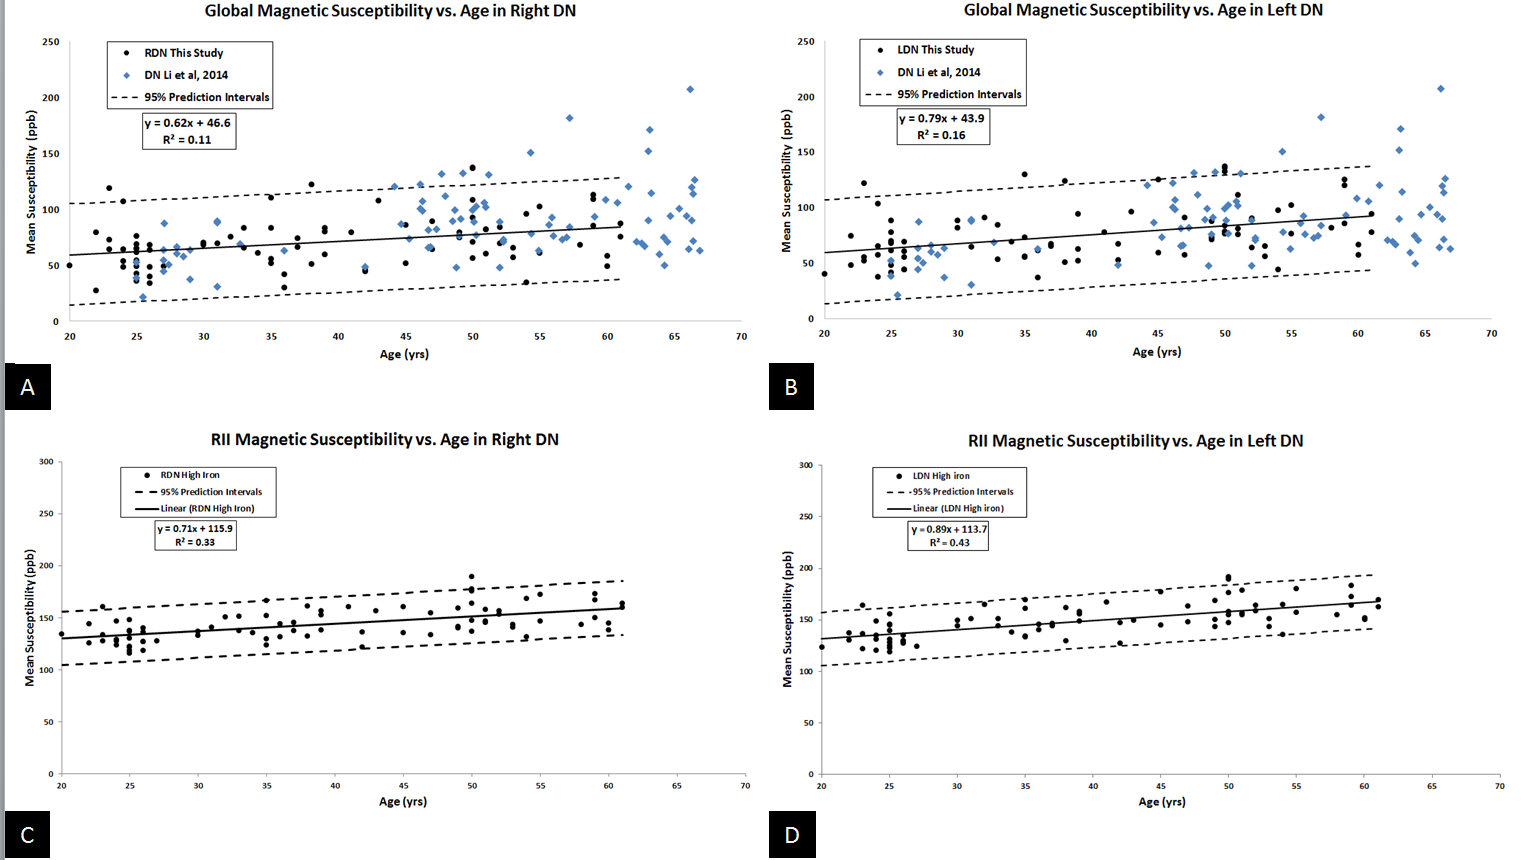
Eighty-one healthy subjects (39.14±12.56, age range 20-61 years old) were recruited to assess magnetic susceptibility changes in eight brain nuclei (Figure 1). A 3D GRE sequence with a 3.0 T Trio scanner (SIEMENS, Erlangen, Germany) was used with the following imaging parameters: TR/TE = 20/29 ms, FA = 15°, slice thickness = 2 mm, bandwidth/pixel = 120 Hz/pxl and matrix size (Nx × Ny) = 448 × 336 resulting in an in-plane resolution of 0.51 × 0.51 mm2. The susceptibility maps were reconstructed using a MatLab-based toolbox SMART 2.0 (the MRI institute for Biomedical Research, Detroit, MI, USA). The reconstruction steps included BET for brain tissue extraction4, 3DSRNCP for phase unwrapping5, SHARP for background field removal6 and an iterative approach for inverse filtering1,7,8. The 3D regions of interest were manually traced on multiple slices using our in-house software SPIN (MR Innovations, Detroit, MI, USA), as shown in Figure 1. For all basal ganglia and midbrain nuclei, mean susceptibilities in RII region were calculated and plotted as a function of age and were also compared to the regional analysis reported in Liu et al.’s work2. In DN, however, mean susceptibility values were also extracted from the entire 3D ROIs (i.e., global analysis) and compared to the results published by Li et al within a similar age range9. RII mean susceptibility versus age was plotted for this structure as well. Finally, a linear regression model was applied to evaluate the correlation between susceptibility and age.Results
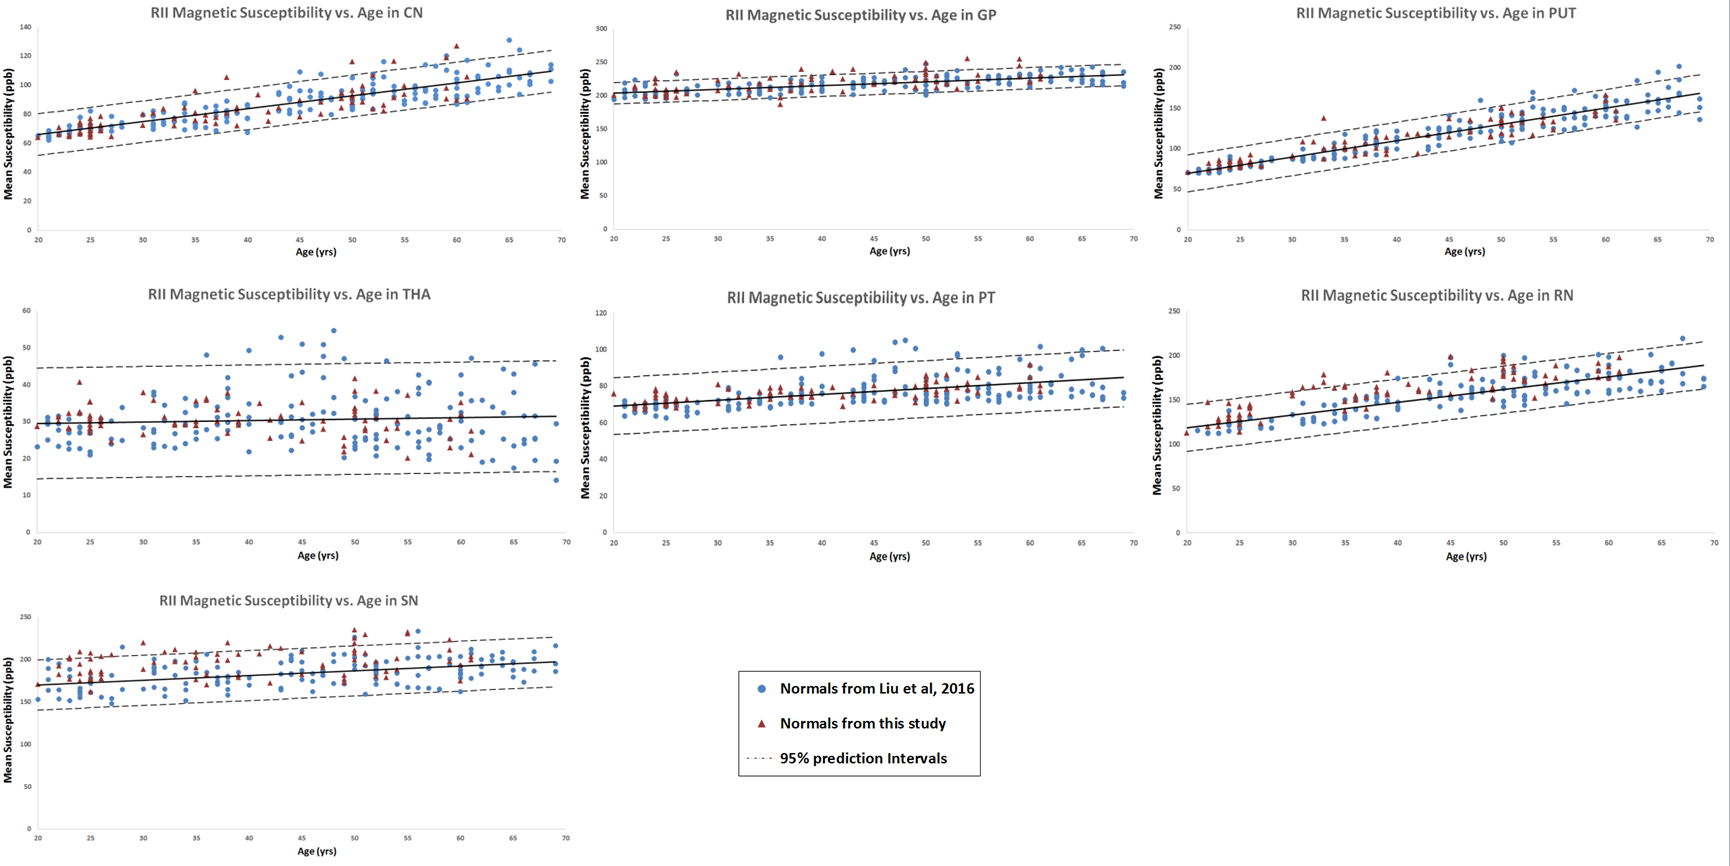
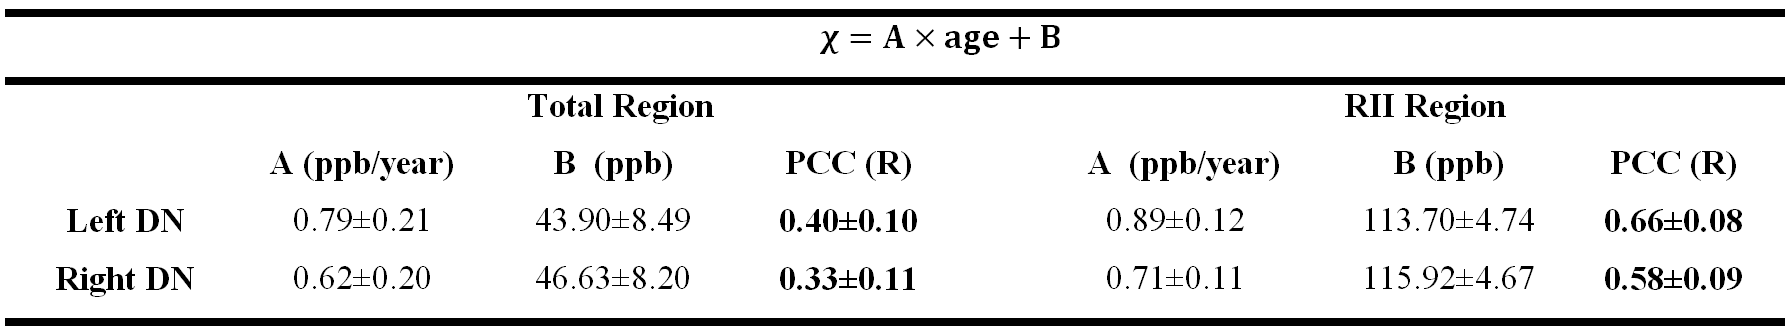
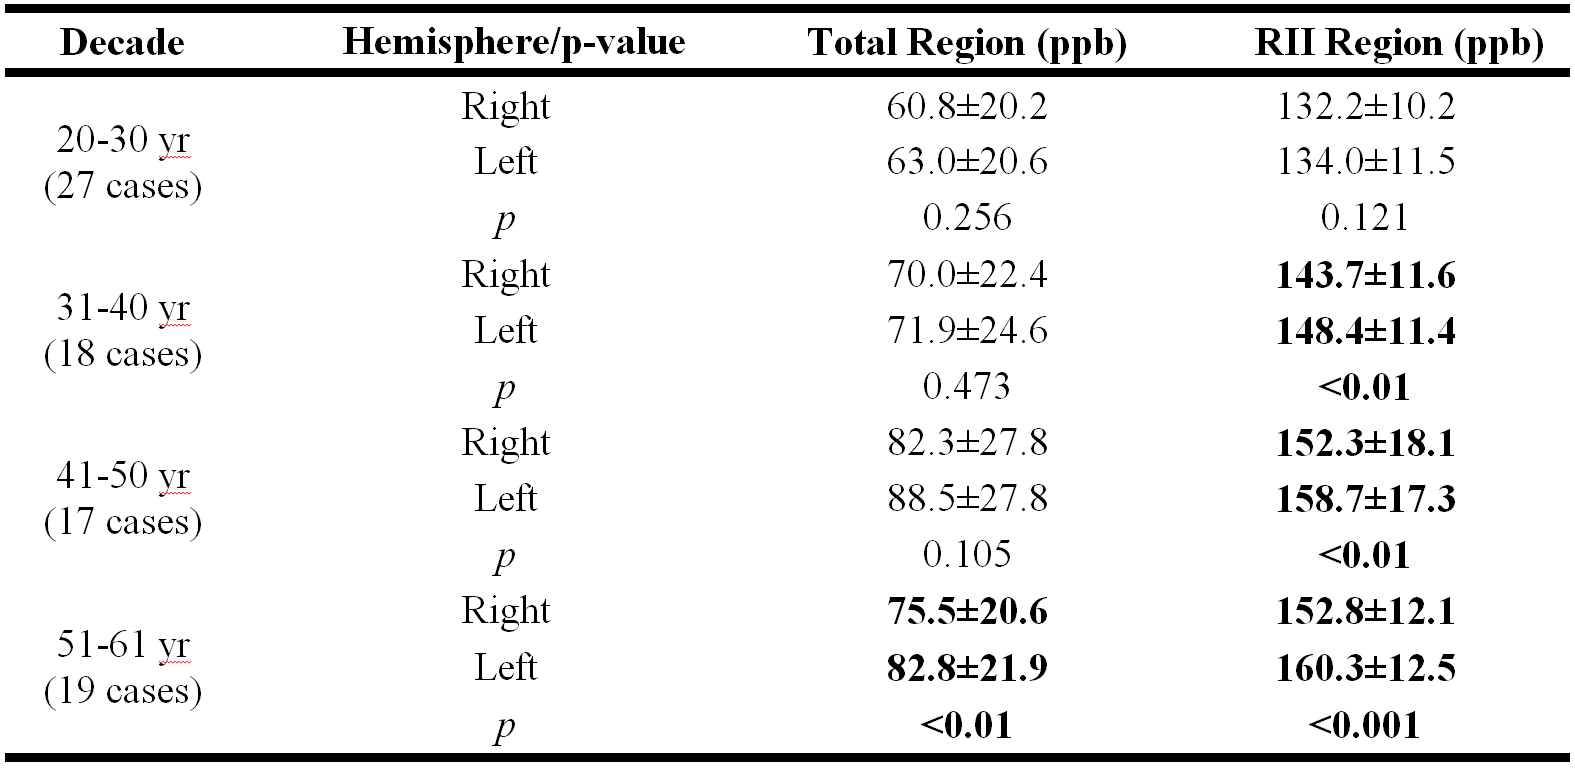
Figure 2 shows mean RII susceptibility changes as a function of age in the right hemisphere of seven deep gray matter nuclei as compared to the regional baseline established in Liu et al.’s study2. Figure 3 shows global (Figure 3A and 3B) and regional (Figure 3C and 3D) analyses for each hemisphere of the DN. The global analysis is plotted against a similar QSM study done by Li et al9. Linear regression parameters and hemisphere difference in different decades for both analyses are also shown in Table 1 and Table 2, respectively.Discussion and Conclusion
There are a few findings in this work. First, the susceptibility-age correlation in RII region was observed to be highly consistent with the regional analysis done by Liu et al. which validated the robustness of this newly established normal baseline. Second, in addition to the DN global analysis showing a very good agreement with Li et al.’s QSM study, the higher slope and PCC values in the regional analysis confirms greater sensitivity and precision of this technique in the dentate nucleus as well, similar to other deep gray matter nuclei. Third, except for the subjects aged in the 20-30 year decade, there appears to be a significant difference between the two hemispheres in the DN RII region, with left having the higher iron content, while in global analysis a significant difference is observed only in the last decade. In summary, the RII approach may prove to be a more sensitive and robust baseline in studying abnormally high levels of iron content in neurodegenerative disease and gadolinium deposition in patients undergoing multiple contrast agent administrations.Acknowledgements
No acknowledgement found.References
1. Haacke EM, Liu S, Buch S, Zheng W, Wu D, Ye Y. Quantitative susceptibility mapping: current status and future directions. Magnetic resonance imaging. 2015;33(1):1-25.
2. Liu M, Liu S, Ghassaban K, Zheng W, Dicicco D, Miao Y, et al. Assessing global and regional iron content in deep gray matter as a function of age using susceptibility mapping. Journal of magnetic resonance imaging : JMRI. 2016;44(1):59-71.
3. Kanda T, Oba H, Toyoda K, Kitajima K, Furui S. Brain gadolinium deposition after administration of gadolinium-based contrast agents. Jpn J Radiol. 2016;34(1):3-9.
4. Smith SM. Fast robust automated brain extraction. Human brain mapping. 2002;17(3):143-55.
5. Abdul-Rahman HS, Gdeisat MA, Burton DR, Lalor MJ, Lilley F, Moore CJ. Fast and robust three-dimensional best path phase unwrapping algorithm. Applied optics. 2007;46(26):6623-35.
6. Schweser F, Deistung A, Lehr BW, Reichenbach JR. Quantitative imaging of intrinsic magnetic tissue properties using MRI signal phase: an approach to in vivo brain iron metabolism? NeuroImage. 2011;54(4):2789-807.
7. Haacke EM, Tang J, Neelavalli J, Cheng YC. Susceptibility mapping as a means to visualize veins and quantify oxygen saturation. Journal of magnetic resonance imaging : JMRI. 2010;32(3):663-76.
8. Tang J, Liu S, Neelavalli J, Cheng YC, Buch S, Haacke EM. Improving susceptibility mapping using a threshold-based K-space/image domain iterative reconstruction approach. Magnetic resonance in medicine : official journal of the Society of Magnetic Resonance in Medicine / Society of Magnetic Resonance in Medicine. 2013;69(5):1396-407.
9. Li W, Wu B, Batrachenko A, Bancroft-Wu V, Morey RA, Shashi V, et al. Differential developmental trajectories of magnetic susceptibility in human brain gray and white matter over the lifespan. Human brain mapping. 2014;35(6):2698-713.
Figures