4265
Cross-Sectional Assessment of Diffusion Parameters in Specific Brain Tracts correlated with Cortical Thinning throughout Healthy Aging1InBrain Lab, Department of Physics, Faculty of Philosophy, Sciences and Letters of Ribeirão Preto, University of São Paulo, Ribeirão Preto, Brazil, 2Department of Internal Medicine, Ribeirão Preto Medical School, University of São Paulo, Ribeirão Preto, Brazil
Synopsis
The human brain is a complex structure that undergoes continuous, non-linear changes over the lifespan. We used anatomic and diffusion data from 165 healthy subjects, collected retrospectively from CCIFM/HC-FMRP. T1-weighted images were used for cortical parcellation, thus 102 of 148 cortical regions had statistically significant decrease with age. Three fiber tracts were selected: Corpus Callosum, Uncinate Faciculus and Corticospinal Tract, their diffusion parameters, FA and MD, showed significant relationship with cortical thickness of the biggest cortical area in the ending of each tract. Despite these correlations, it was possible to verify that age is the pivotal variable in this relationship.
PURPOSE
To evaluate structural brain connectivity throughout healthy brain aging, using diffusion quantitative parameters as tract integrity attributes and its relationship with cortical thinning.
INTRODUCTION
Brain aging is a complex and heterogeneous process that is associated with a high level of variability between subjects. MRI allows in vivo characterization of structural and functional brain changes due to advancing age. Diffusion quantitative parameters, as Fractional Anisotropy (FA) and Mean Diffusibility (MD), can characterize the degradation of the axonal fibers. Tractography analysis has related FA and MD alterations with age, suggesting these as sensitive markers of aging, that may precede atrophy in several brain regions1-7. In addition, cortical thickness may be an additional indicator of brain aging, the loss of gray matter starts early and progresses gradually, as reported in literature8,9. Knowledge about the link between the decrease in white matter integrity and the cortical degeneration, due to aging, is scarce. We hypothesize that the FA decrease and MD increase across tracts relate to cortical thinning, with some anatomical specificity throughout aging.
METHODS
Image data, collected retrospectively, consisted of DTI and T1-weighted images from 165 healthy individuals (18-90 y.o., 81 M) acquired in a 3T Philips Achieva MR scanner. Anatomical images were used at FreeSurfer software (version 5.3.0)10, using default options and Destrieux atlas11, for cortical segmentation and estimation of the cortical thickness of the 74 cortical regions per hemisphere. Fractional anisotropy (FA) and mean diffusivity (MD) maps were obtained using default options in the FSL software12. Tracts were reconstructed using TrackVis software13, three tracts were manually selected based on anatomical information: Corpus Callosum (CC), subdivided in Genu, Body and Splenium, Corticospinal Tract (CST) and Uncinade Fasciculus (UF). Several tract-cortical relationship were analyzed: CC-Genu with right and left Superior frontal gyrus (F1), CC-Body with right and left Superior parietal lobules (lateral part of P1), CC-Splenium with right and left Precuneus (medial part of P1), CST with right and left Precentral gyrus and for UF with right and left Temporal lobe and Orbital part of the inferior frontal gyrus. A multiple-regression model was used to explain FA and MD variations considering the specific cortical thicknesses and the age effect. Statistical analyses were performed using R software14.
RESULTS
Analysis of cortical thickness information were carried out in relation to age for the 148 cortical regions, thus 102 regions show significant reduction in healthy aging (pcorrected<0.05). Transverse temporal sulcus and Subcallosal gyrus were the regions of the most cortical thinning (0.11mm/decade).
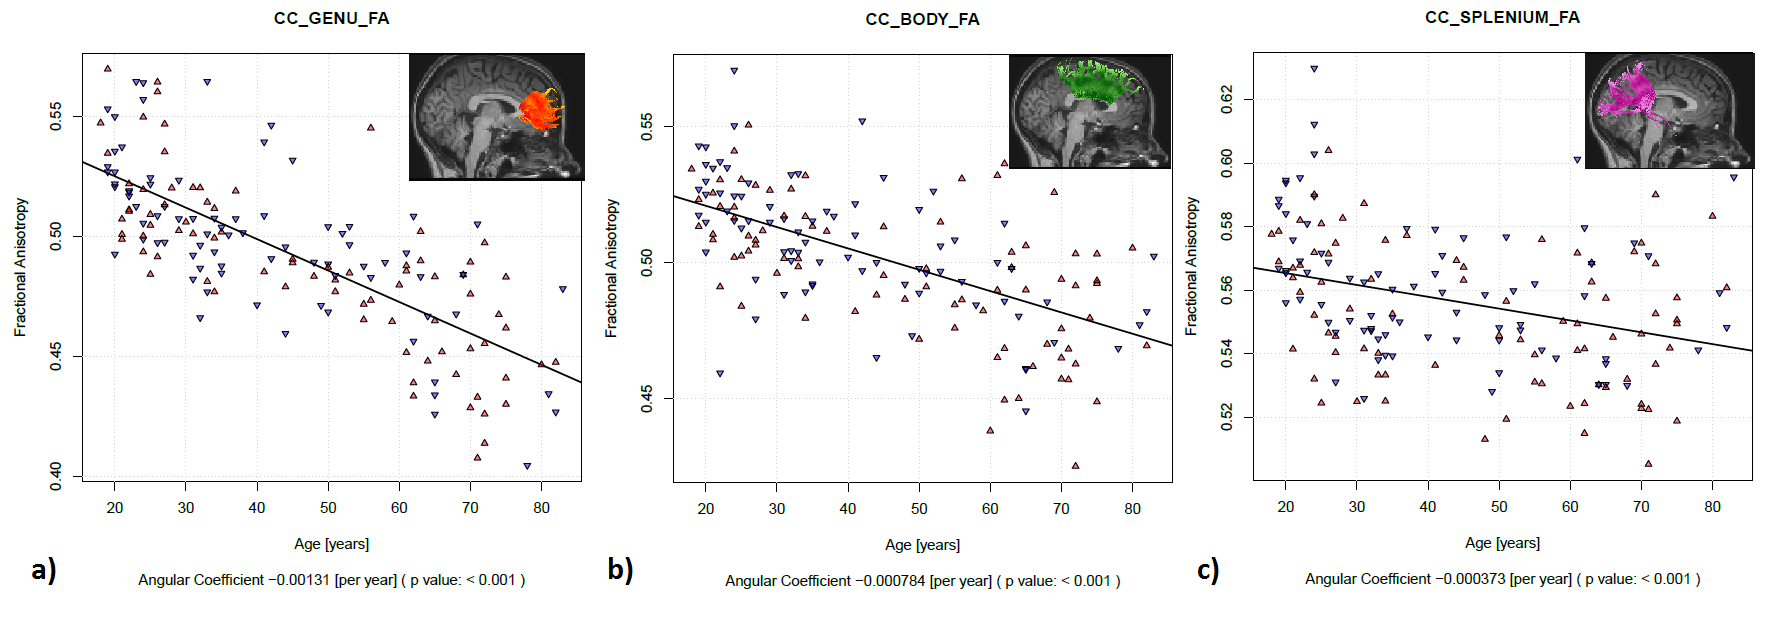
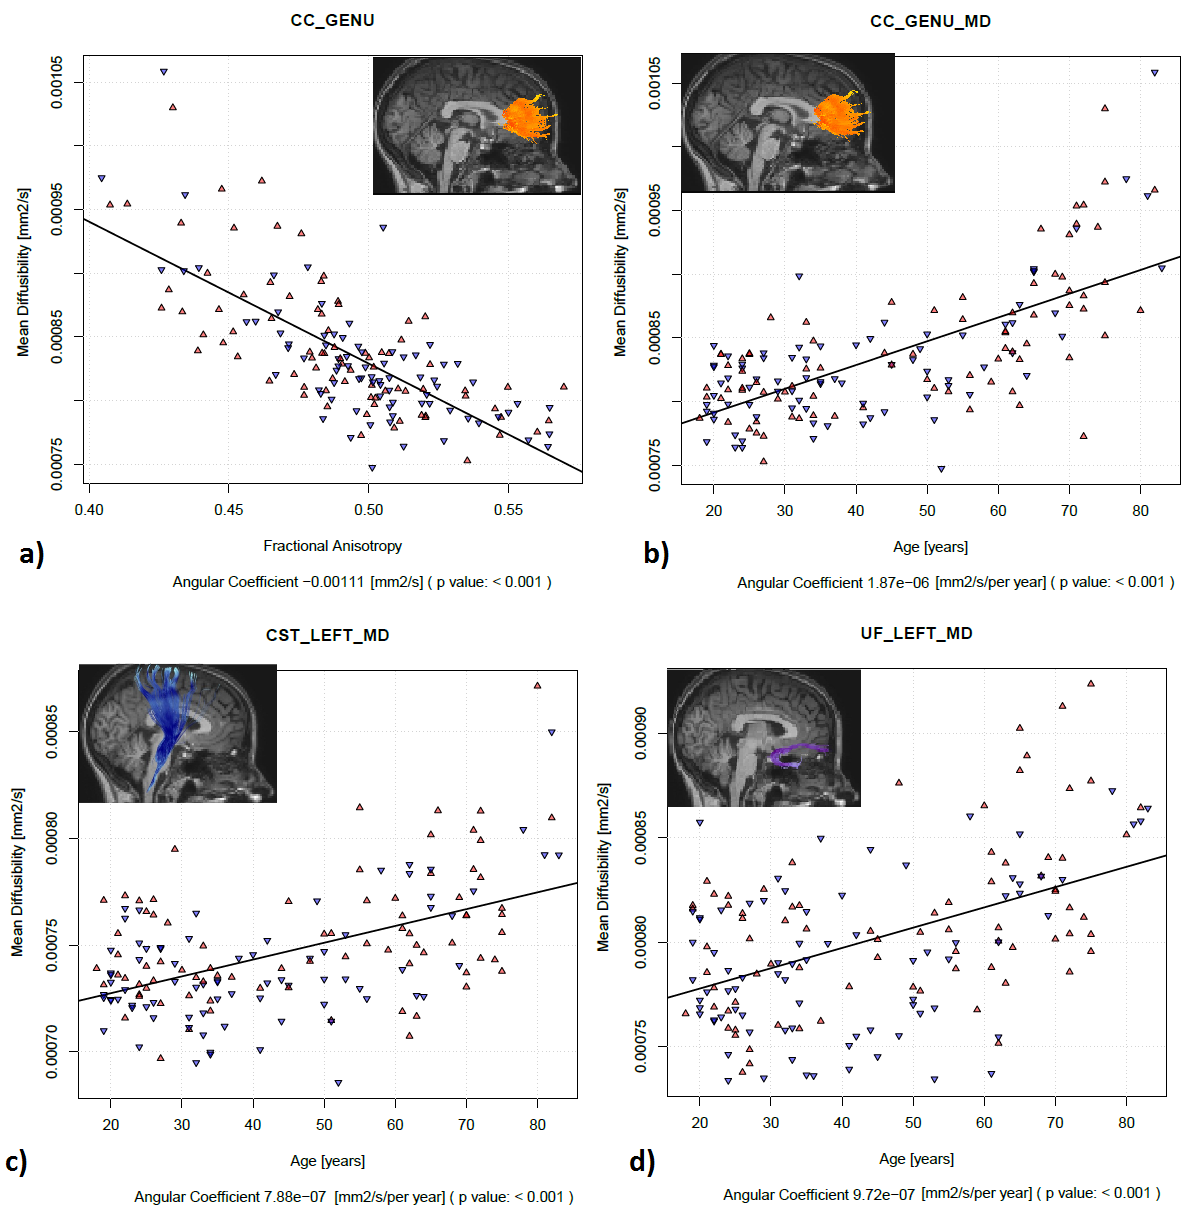
From the structural images, it was possible to verify an antero-posterior gradient of FA decrease in the Corpus Callosum (CC), Figure 1, as reported in the literature15,16. All selected tracts show a significant decrease of FA values and increased MD with age, considering a linear relationship between these two diffusion parameters, Figure 2.
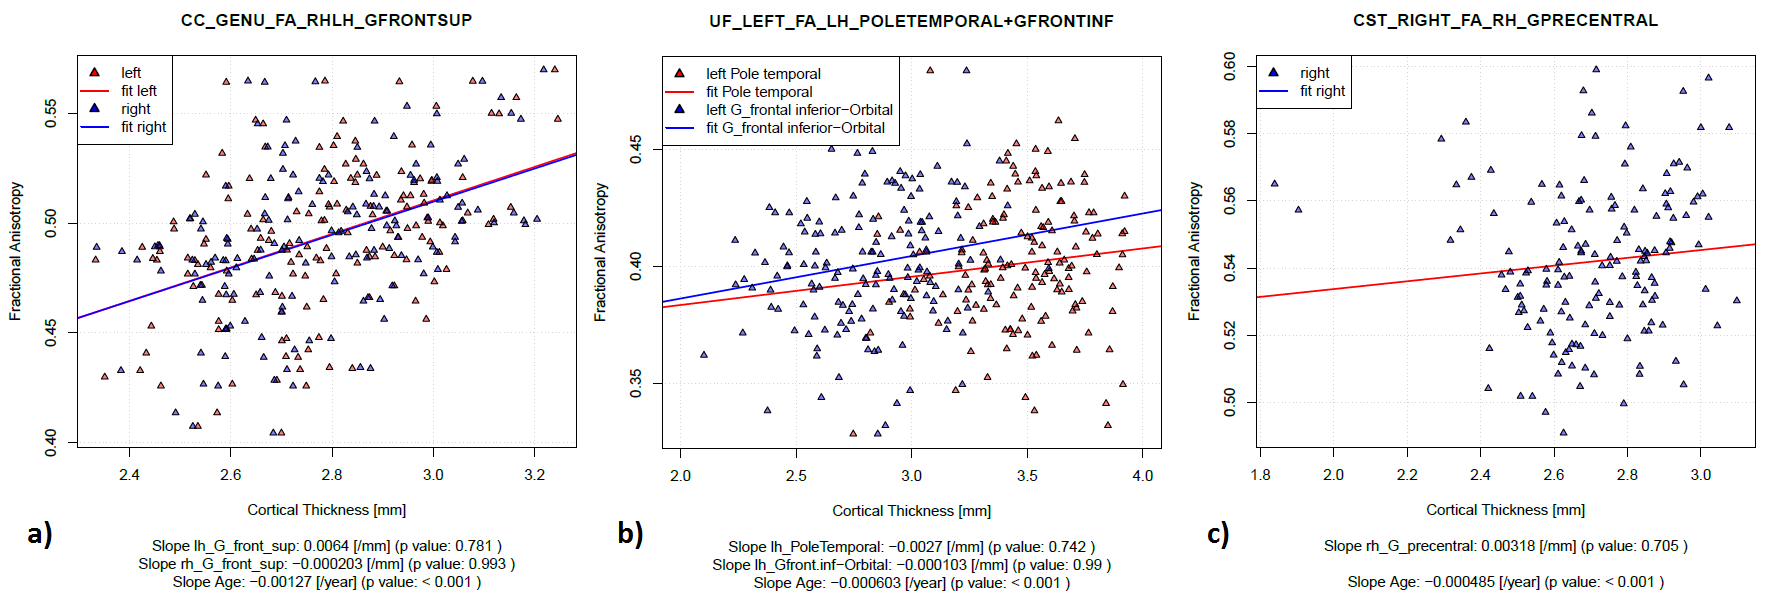
The cortical thickness of specific cortical regions that connects the terminations of the tracts was correlated with tract integrity. For each tract, a distinct region of the cortical segmentation was selected, considering the most significant for the cortical connection (Figure 3).
After the multiple regressions and considering the statistical significances (Figure 3), it was clear that the main factor correlating the diffusion parameters and the cortical thickness was the age.
DISCUSSION
Cross-sectional FA and MD diffusion analysis indicates widespread microstructural deterioration of the normal-appearing white matter in normal aging, together with cortical thinning of several brain areas (102 of 148 cortical regions). These findings indicate a combination of global and tract-specific relationships between diffusion quantitative parameters, describing WM integrity, and cortical thinning. Gray matter damage is expected to lead to white matter degeneration, where degeneration of axons is seen followed by degradation of the myelin sheath, and vice-versa. However, in the static brain the relationship between tract integrity and cortical thickness is not direct.CONCLUSION
The combination of tract-specific relationships between diffusion quantitative parameters, describing the fibers integrity, are indirectly related to the cortical thinning of cortical regions, mainly due to the age effect. It is important to understand the healthy aging mechanisms to be able to differentiate these, concerning neurodegenerative processes.Acknowledgements
Grant support: FAPESP
Personnel support: INBRAIN Research Group
References
1.Hugenschmidt, C. et al. Relating Imaging Indices of White Matter Integrity and Volume in Healthy Older Adults. Cerebral Cortex.2007;(18)2:433-442.
2. Giorgio, A. et al. Age-related changes in grey and white matter structure throughout adulthood. NeuroImage.2010;(51)3:943-951.
3.Kochunov, P. et al. Fractional anisotropy of cerebral white matter and thickness of cortical gray matter across the lifespan. NeuroImage.2011;(58)1:41-49.
4.Voineskos, A. et al. Age-related decline in white matter tract integrity and cognitive performance: A DTI tractography and structural equation modeling study. Neurobiology of Aging.2012;(33)1:21-34.
5.Michielse, S. et al. Selective effects of aging on brain white matter microstructure: A diffusion tensor imaging tractography study. NeuroImage.2010;(52)4:1190-1201.
6.Teipel, S. et al. Decline of fiber tract integrity over the adult age range: A diffusion spectrum imaging study. Journal of Magnetic Resonance Imaging.2013;(40)2:348-359.
7.Storsve, A. et al. Longitudinal Changes in White Matter Tract Integrity across the Adult Lifespan and Its Relation to Cortical Thinning. PLOS ONE.2016;(11)6: e0156770.
8.Salat, D. Thinning of the Cerebral Cortex in Aging. Cerebral Cortex.2004;(14)7:721-730.
9.Thambisetty M, Wan J, Carass A, et al. Longitudinal changes in cortical thickness associated with normal aging. Neuroimage. 2010;52(4):1215-1223.
10.Fischl, B. FreeSurfer. Neuroimage.2012;62(2):774-781.
11.Fischl, B. Automatically Parcellating the Human Cerebral Cortex. Cerebral Cortex. 2004;14(1):11-22.
12.Jenkinson, M. et al. FSL. NeuroImage. 2012;62(2):782-790.
13.Wang R, Wedeen VJ.. TrackVis. org. Martinos Center for Biomedical Imaging, Massachusetts General Hospital. Proc Int Soc Magn Reson Med. 2007;15:3720.
14.R Core Team (2016). R: A language and environment for statistical computing. R Foundation for Statistical Computing, Vienna, Austria. URL https://www.R-project.org/.
15.Sullivan EV, et al. Equivalent disruption of regional white matter microstructure in aging healthy men and women. Neuroreport. 2001;12:99–104.
16. Sullivan E V,Pfefferbaum A. Neuroradiological characterization of normal adult ageing. The British Journal of Radiology.2007;(80)2:99-108.
Figures