4264
Changes in myelination and cortical thickness with advancing age1Sir Peter Mansfield Imaging Centre, University of Nottingham, Nottingham, United Kingdom
Synopsis
This study explores the relationships that cortical myelination and cortical thickness have with age, and expands on existing literature by investigating whether the previously reported trends are still present when only looking at individual lobes of the brain. We find that quadratic variations occur in all four lobes of the brain in regards to myelination, and that cortical thickness declines linearly with age in all lobes except the temporal. We also find that myelination levels and cortical thickness appear to change independently of each other.
TARGET: Those interested in the cortex and brain changes with aging.
PURPOSE
Changes in cortical myelination and cortical thickness (CT) with age have been previously reported, but have never been confirmed to be present across the whole brain, and furthermore a relationship between the two has never been confirmed. CT has previously been shown to reduce at a rate of 0.004mm/year averaged over the whole brain in healthy individuals[1]. T1 measurements have previously suggested that white matter myelination follows a parabolic trend peaking at age 40[2]. However, it is arguably better to use magnetization transfer (MT) as a marker for myelin, as this is less affected by changes in cortical iron content than T1 based methods[3].AIM
To explore how cortical myelination, as assessed by MT, and CT evolve with age in different cortical regions, and to determine whether there is any correlation between this relationship and the rate of cortical thinning.METHODS
After local ethics approval, 58 volunteers (40±22 years, 27 male) were scanned using a Philips Achieva 7T system. CT and grey matter (GM) masks were extracted for each subject via SPM[4] using a Phase-Sensitive-Inversion-Recovery image (FOV=240x216x160mm3, 0.8x0.8x0.8mm3, TI1/TI2=780ms/1600ms). Three z-spectra were acquired for each subject at different saturation powers using an MT-TFE sequence (saturation-train: 20 sinc-pulses, BW=200Hz, 17 off-resonances between 5kHz to 5kHz, B1rms=0.33, 0.65 and 1.09μT; acquisition: TE/TR/FA=2.7ms/5.8ms/8°, FOV=192x192x60 mm3, 1.5x1.5x1.5mm3, low-high k-space acquisition and SENSE factor RL=2))[5]. Quantitative MT data was derived by fitting the three z-spectra to a look-up-table of simulated spectra based on the Bloch-McConnell equations[6]. The mean CT and MT values were estimated for each participant for 78 of the 116 AAL atlas regions (excluding sub-cortical and cerebellar regions). MT vs age data were fitted to a quadratic function[2], and the CT vs age data was fitted to a linear function, both for the whole brain and each AAL region. False discovery rate correction was performed to check for statistical significance across the whole brain. The relationship between MT and CT was also investigated, and standard deviation in MT and CT across the brain were also measured.RESULTS
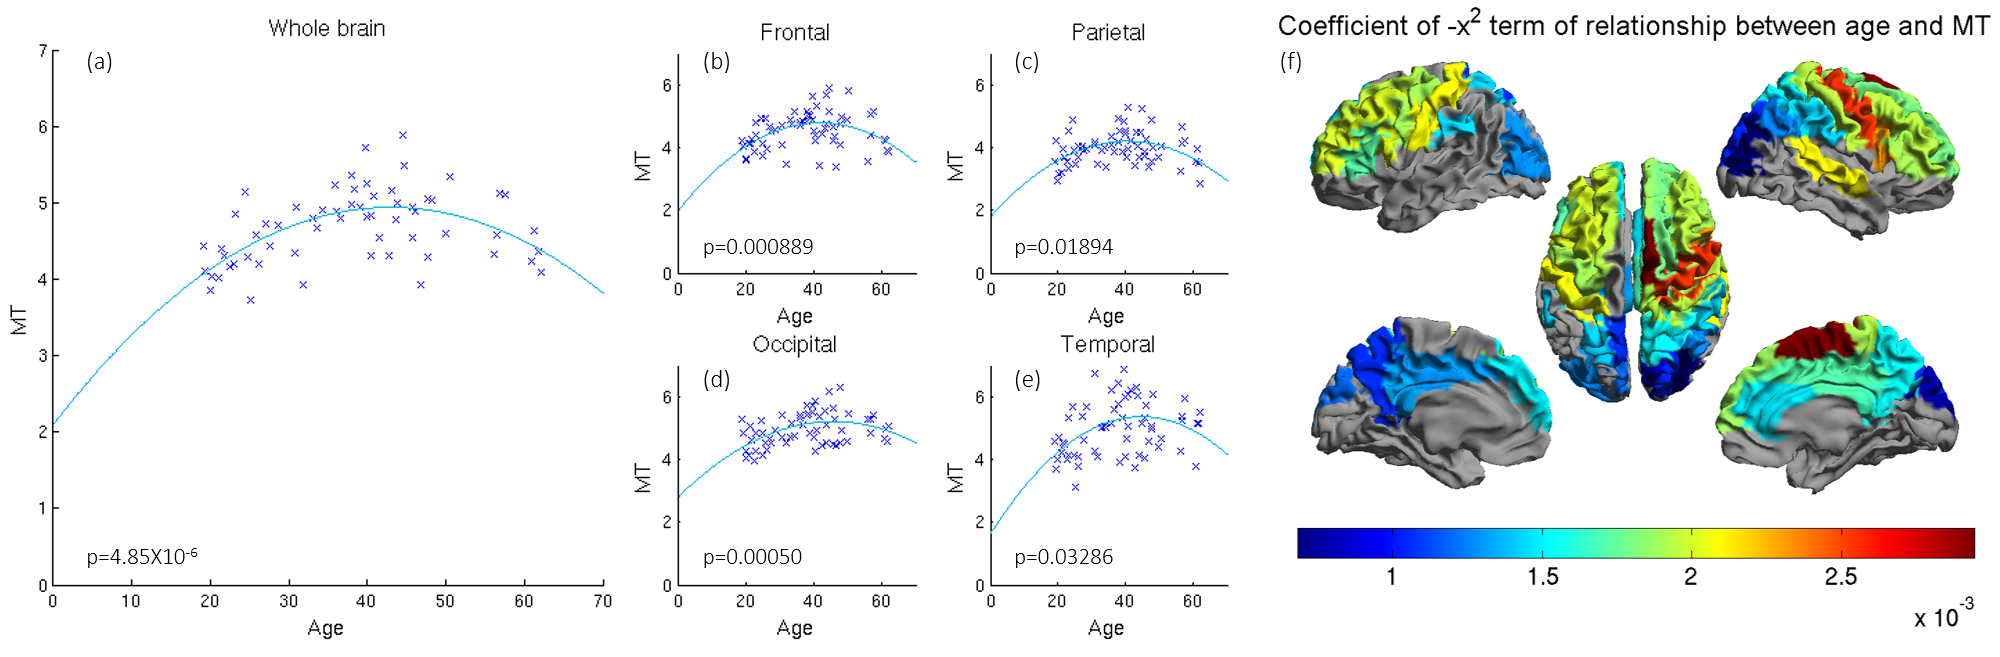
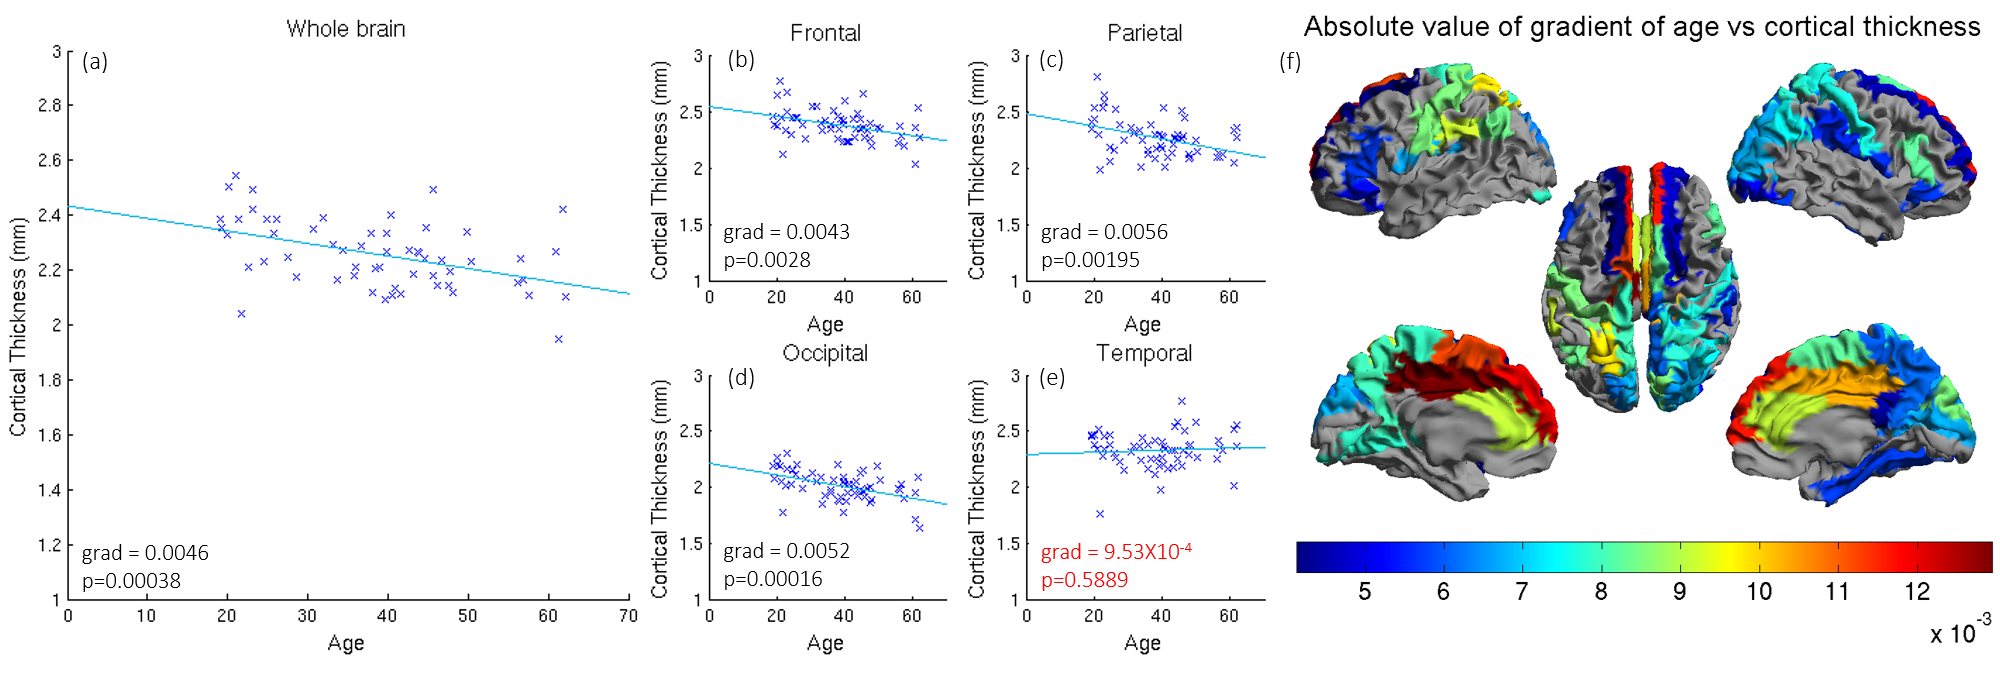
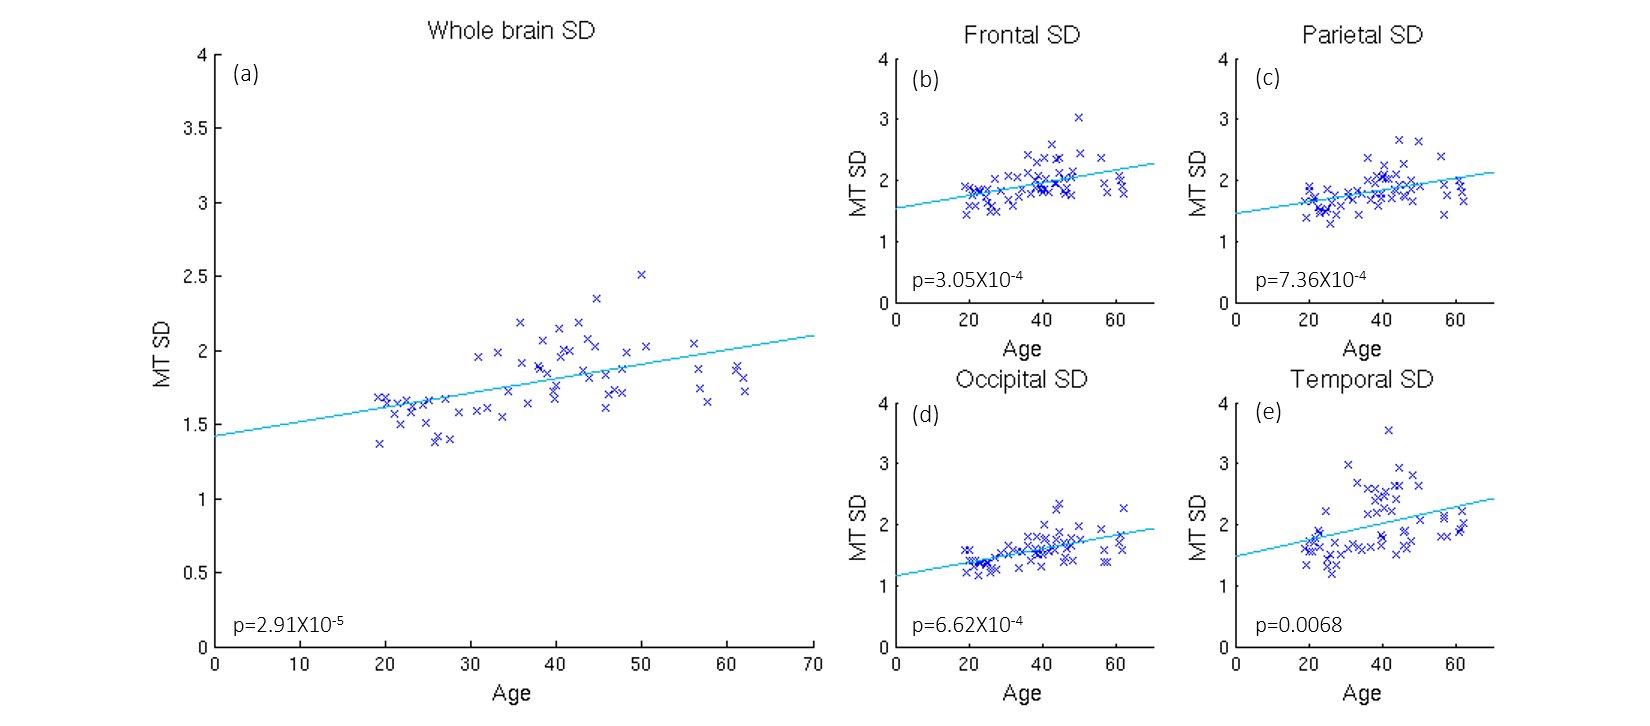
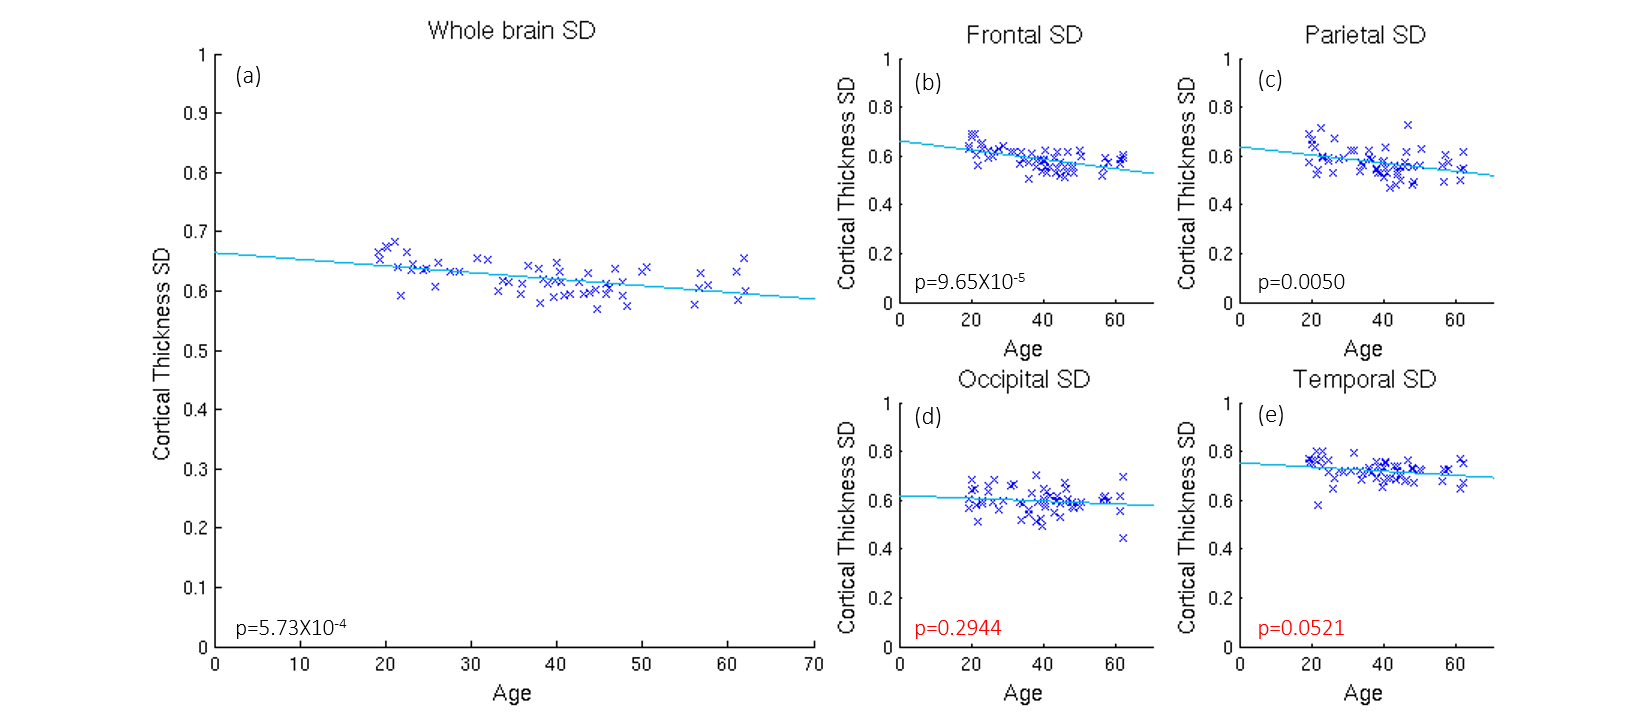
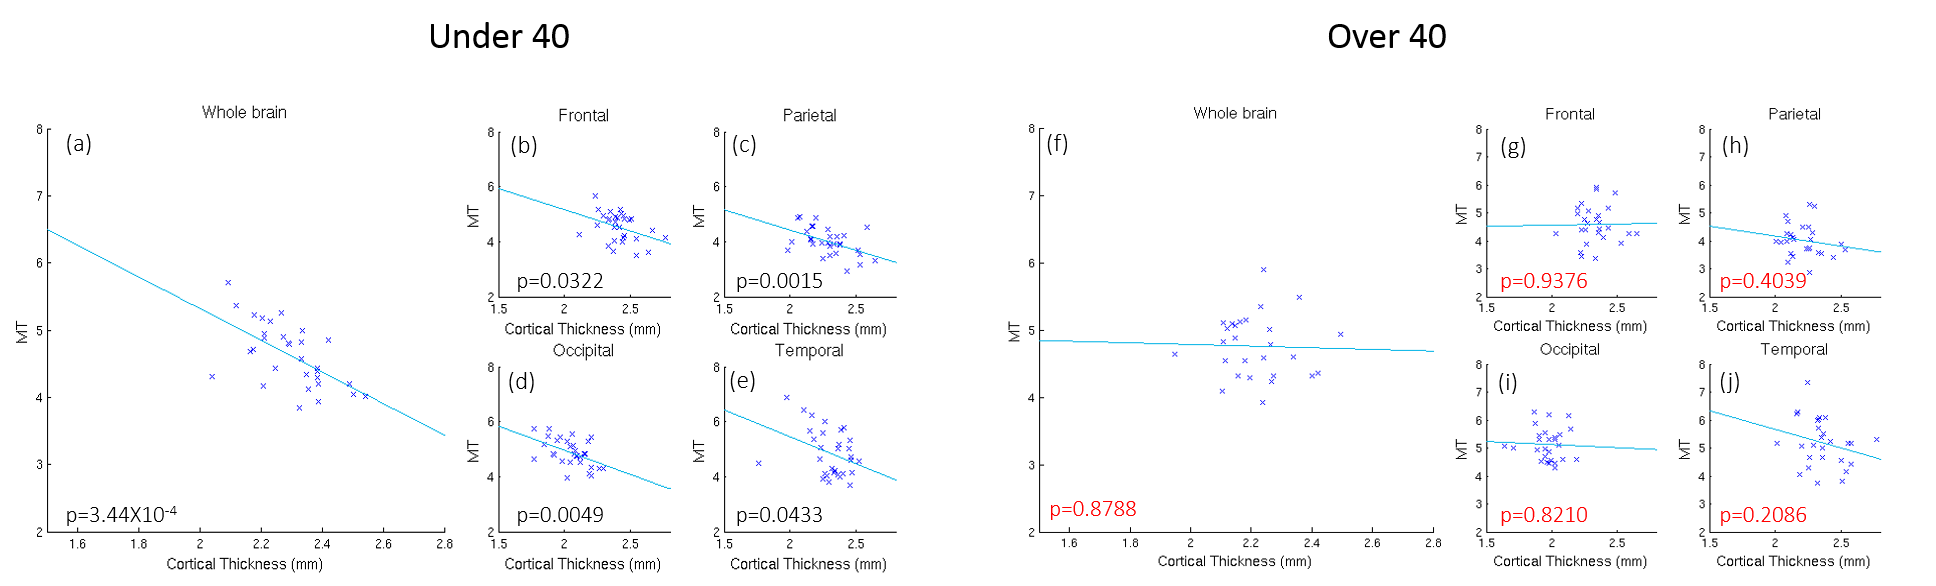
Significant quadratic variations were found between MT and age, across the whole cortex (Figure 1(a): p<5e-6) and with variations across the cortex (Figures 1(b-e): p<0.05). CT also decreased significantly with age (Figure 2(a): p<0.0004) with some variation across the brain (Figure 2(b-e): p<0.003). The standard deviation (SD) in MT across the brain increased significnatly with age and decreased for CT (Figures 3 and 4). Figure 5 shows a linear trend between MT and CT in subjects under the age of 40, and that CT does not change with MT for subjects over 40. These trends were not significant in individual AAL regions.DISCUSSION
Our results confirm previous work finding a quadratic relation between the amount of cortical myelin and age peaking around the early/mid-forties before declining with advancing age. Furthermore, we extend upon these results by showing that the rate of demyelination is not constant across all regions of the brain, and that certain regions such as the precentral gyrus have a more pronounced rate of change than others, such as the occipital lobe We confirm previous results showing a linearly decrease of CT with age and extended upon these by showing that the relationship across AAL regions is not uniform, for instance the medial frontal gyrus decreases at 0.0012mm/year, whereas other regions decrease at a much slower rate. The change in the variance in MT and CT with age may relate to local changes in brain function and warrant further investigation. Finally, we explore the relationship between CT and cortical myelination, dividing the subjects into age<40 and age>40. While general trends can be observed, an analysis into the individual AAL regions showed that the relationship between CT and MT is not significant anywhere in the brain, suggesting that demyelination and cortical thinning occur independently of each other.CONCLUSION
While demyelination and cortical thinning occur naturally with advancing age, our results suggest that this does not occur at a uniform rate over the cortex. Myelination levels were confirmed to have a quadratic trend as predicted by T1 studies. Cortical thinning and demyelination appear to occur independently with aging.Acknowledgements
Andrew Carradus holds a studentship from the Haydn Green Foundation.References
1. Lemaitre H et al. (2012) Normal age-related brain morphometric changes: nonuniformity across cortical thickness, surface area and gray matter volume? Neurobiology of Aging 33 (2012) 617.e1– 617.e9
2. Cho S et al. (1997) Establishing norms for age-related changes in proton T1 of human brain tissue in vivo. Magnetic Resonance Imaging 15(10):1133-1143
3. Lorio S et al. (2014) Disentangling in vivo the effects of iron content and atrophy on the ageing human brain. Neuroimage 103(2014):280-289
4. SPM (http://www.fil.ion.ucl.ac.uk/spm)
5. Mougin O, Clemence M, Peters A, Pitiot A, Gowland P (2013) High-resolution imaging of magnetization transfer and nuclear Overhauser effect in the human visual cortex at 7 T. NMR Biomed 26(11):1508-1517
6. Geades N et al. Quantitative z-spectrum analysis of the healthy human brain at 7T. Magn Reson Med, in press
Figures