4263
QSM and R2* texture analysis in the aging brain1DZNE, Magdeburg, Germany, 2Institute of cognitive neurology and dementia research (IKND), Magdeburg, Germany
Synopsis
To date, several studies have shown the value of quantitative susceptibility mapping (QSM) and R2* to detect aging-associated neurobiological mechanisms often based on single parametric features, either mean or median values, to characterise QSM/R2* behaviours in regions of interest (ROIs). In this study we propose the use of Haralick texture features to probe regional distribution characteristics of voxel intensities in R2*/QSM images. The results demonstrate that Haralick texture features add value to study the aging brain since they increase significantly the accuracy in subcortical R2*/QSM differentiation between elderly and young subjects.
Purpose:
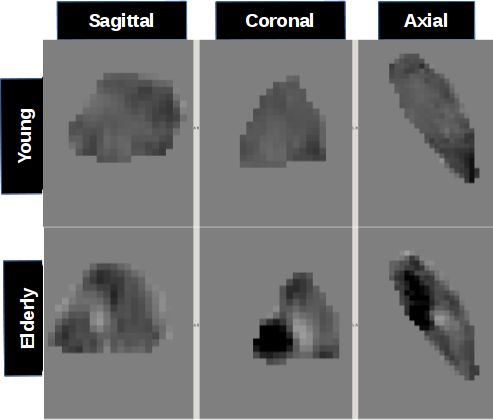
To date, several studies have shown the value of quantitative susceptibility mapping (QSM) and R2* to detect aging-associated neurobiological mechanisms [1-4]. Outcome measures in regional analyses, however, are often based on single parametric features, either mean or median values, to characterise QSM/R2* behaviours in regions of interest (ROIs). In the aging brain, progressive loss of myelin occurs, and minerals such as calcium and iron accumulate. Such events lead to heterogeneous QSM/R2* distributions such as that depicted in Figure 1. In such scenario, median/mean values might not accurately capture brain changes. The focus on this work was to investigate the usefulness of Haralick texture features (HTF) to probe relative-frequency QSM/R2* distributions in 12 subcortical structures, and to assess whether, in combination with traditional summary statistics, such measures could improve the detection of age-related effects.Methods:
R2* and QSM values were measured with 7 Tesla MRI in 12 subcortical structures in 20 healthy young individuals (22-28 years old; 11 females, 9 males) and 20 healthy older adults (64-75 years old; 11 females, 9 males). Detailed information on the MRI protocol, QSM reconstruction and R2* mapping routines can be found here [1]. The imaging protocol included an anatomical T1 MP-RAGE scan sequence in addition to the multi-echo gradient echo sequence used to estimate both quantitative metrics. A T1-based study-wise space for analysis was thus generated using ANTS [5]. HTF [6] as well as median and standard deviation were estimated from each ROI. The following 3D HTF were obtained through estimation of the gray level co-occurrence matrix (with a distance factor of one voxel along 13 non-collinear orientations) using an in-house Matlab program: energy, entropy, correlation, contrast, homogeneity, variance, sum mean, inertia, cluster shade, cluster tendency, maximum probability and inverse variance. The following ROIs were included: caudate nucleus, putamen, globus pallidus, hippocampus, amygdala and thalamus, which were segmented automatically using the FIRST algorithm [7]. In addition, red nucleus, subthalamic nucleus, substantia nigra, cerebellar dentate nucleus, plus internal and external pallidum were manually segmented [1]. A total of four support-vector machine (SVM) models were trained: using (i) parametric measures (i.e. median and standard deviation) and (ii) combined (parametric and texture) features, each set of features inferred from each MRI measure separately. A stratified k-fold approach (k=5) was used for cross validation with standardised feature data. SVM performance was estimated as the area under the receiver operator characteristic (AUROC) curve, which were compared across feature sets and quantitative measures, respectively, using Wilcoxon rank sum tests.Results:
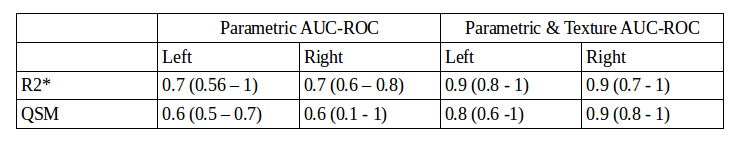
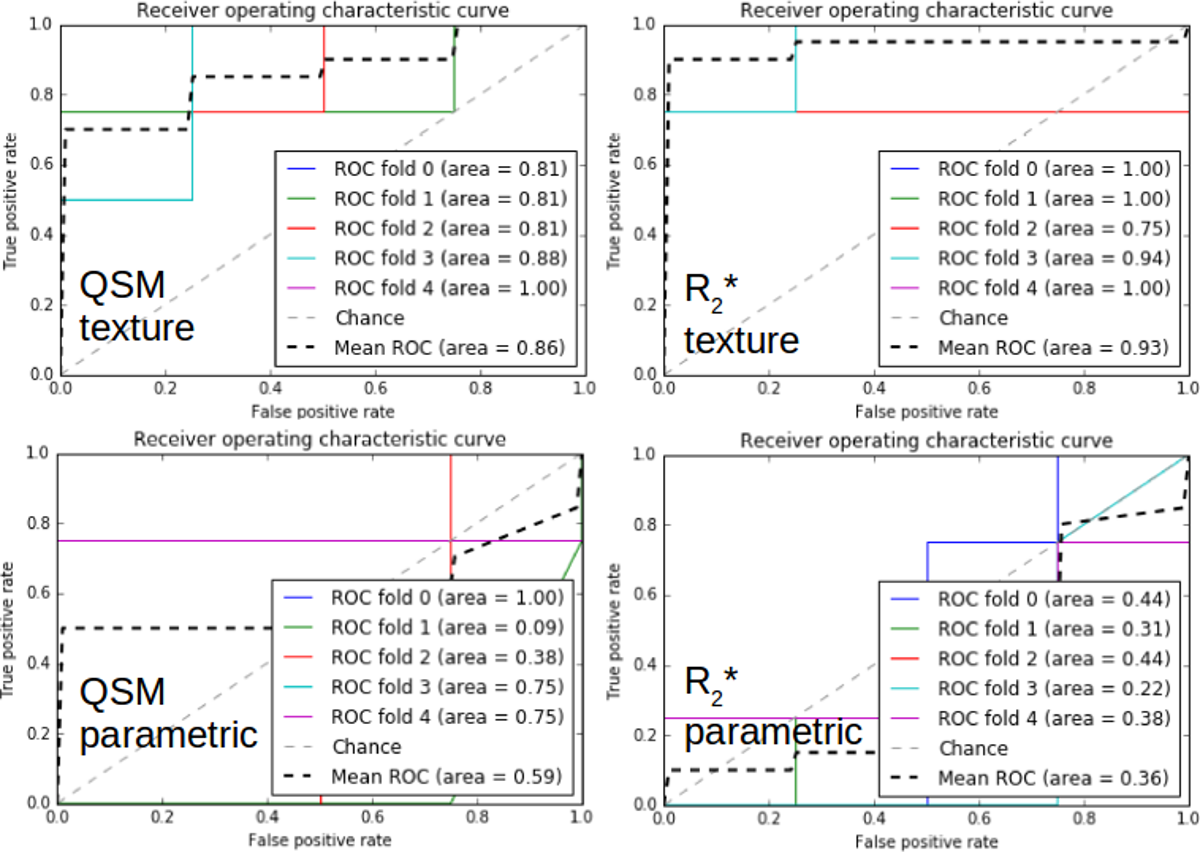
Table 1 summarises AUROCs for each classification experiment. Overall, left/right results were found to be analogous. The average classifier performance obtained using parametric data (only) did not exceed 60%. Using both parametric and texture metrics, AUROCs increased significantly (QSM p=0.01, R2* p<1e-2). Figure 2 shows the ROC curves obtained using the four classifiers for right hemisphere data.Discussion:
Parametric features (median and standard deviation) describing regional R2*/QSM behaviours have shown value in the detection of brain changes due to aging. This study, however, found the combination of HTF with parametric features can better inform machine learning models for the discrimination of elderly R2*/QSM measurements from those in a young adult population. The advantage of HTF is that they can characterise regional distributions according to homogeneity, gray-tone dependency, contrast, number and nature of boundaries, and image complexity. They ultimately provide a new set of informative tools to characterise locally heterogeneous MRI contrasts such as R2* and QSM.Conclusion:
Haralick texture features probe regional distribution characteristics of voxel intensities. This study showed they can add value to study the aging brain; they increase accuracy in subcortical R2*/QSM differentiation between elderly and young subjects.Acknowledgements
We gratefully thank all the participants in this research study to-gether with our radiographers for their dedicated efforts in scanning standardisation and quality assurance.References
1.- Betts et al. NeuroImage 138 (2016) 43–63
2.- Li et al. Hum Brain Mapp 35 (2014) 2698-2713
3.- Acosta-Cabronero et al. J Neurosci 36 (2016) 364–374
4.- Bilgic et al. Neuroimage 59 (2012) 2625–2635
5.- Avants et al. Med. Image Anal. 12, (2008) 26–41
6.- Haralick et al. IEEE Trans Cybern, 6 (1973) 610-621
7.- Patenaude et al. NeuroImage 56 (2011) 907–922
Figures