4261
MR R2* and Quantitative Susceptibility Mapping: Variability in Normal Subjects across the Adult Lifespan1Radiology and Clinical Neurosciences, Hotchkiss Brain Institute, University of Calgary, Calgary, AB, Canada, 2Seaman Family MR Research Centre, Foothills Medical Centre, Alberta Health Serivces, Calgary, AB, Canada
Synopsis
R2* relaxation and susceptibility measurements are both candidate biomarkers for studying brain change. The relative variability of R2* and quantitative susceptibility mapping (QSM) approaches was studied in six deep brain regions in 182 normal subjects (18-89 years). The variability of R2* measures (average coefficient of variation, CoV: 0.33, mean ± standard deviation over regions) was found to be significantly less than QSM measurements (average CoV: 5.72). The variability in R2* measurements was found to vary with age, unlike QSM which showed no age effects. The increased variability observed in QSM measurements, however, may obscure smaller age effects.
Introduction
Iron accumulation in the brain has been proposed as a biomarker for a variety of neurodegenerative diseases. Two MR imaging techniques: R2* mapping and quantitative susceptibility mapping (QSM) are popular methods to quantify brain iron change. Both methods have received some validation: For example, tissue transverse relaxation rate (R2*) has been found to correlate strongly with iron concentration using histological staining post mortem studies.1 Similarly, tissue susceptibility has been found to correlate with iron concentration using x-ray fluorescence imaging and inductively coupled plasma mass spectrometry.2 This study seeks to assess differences in variability between R2* and QSM methods, in a normal healthy subjects across the adult human lifespan.Methods
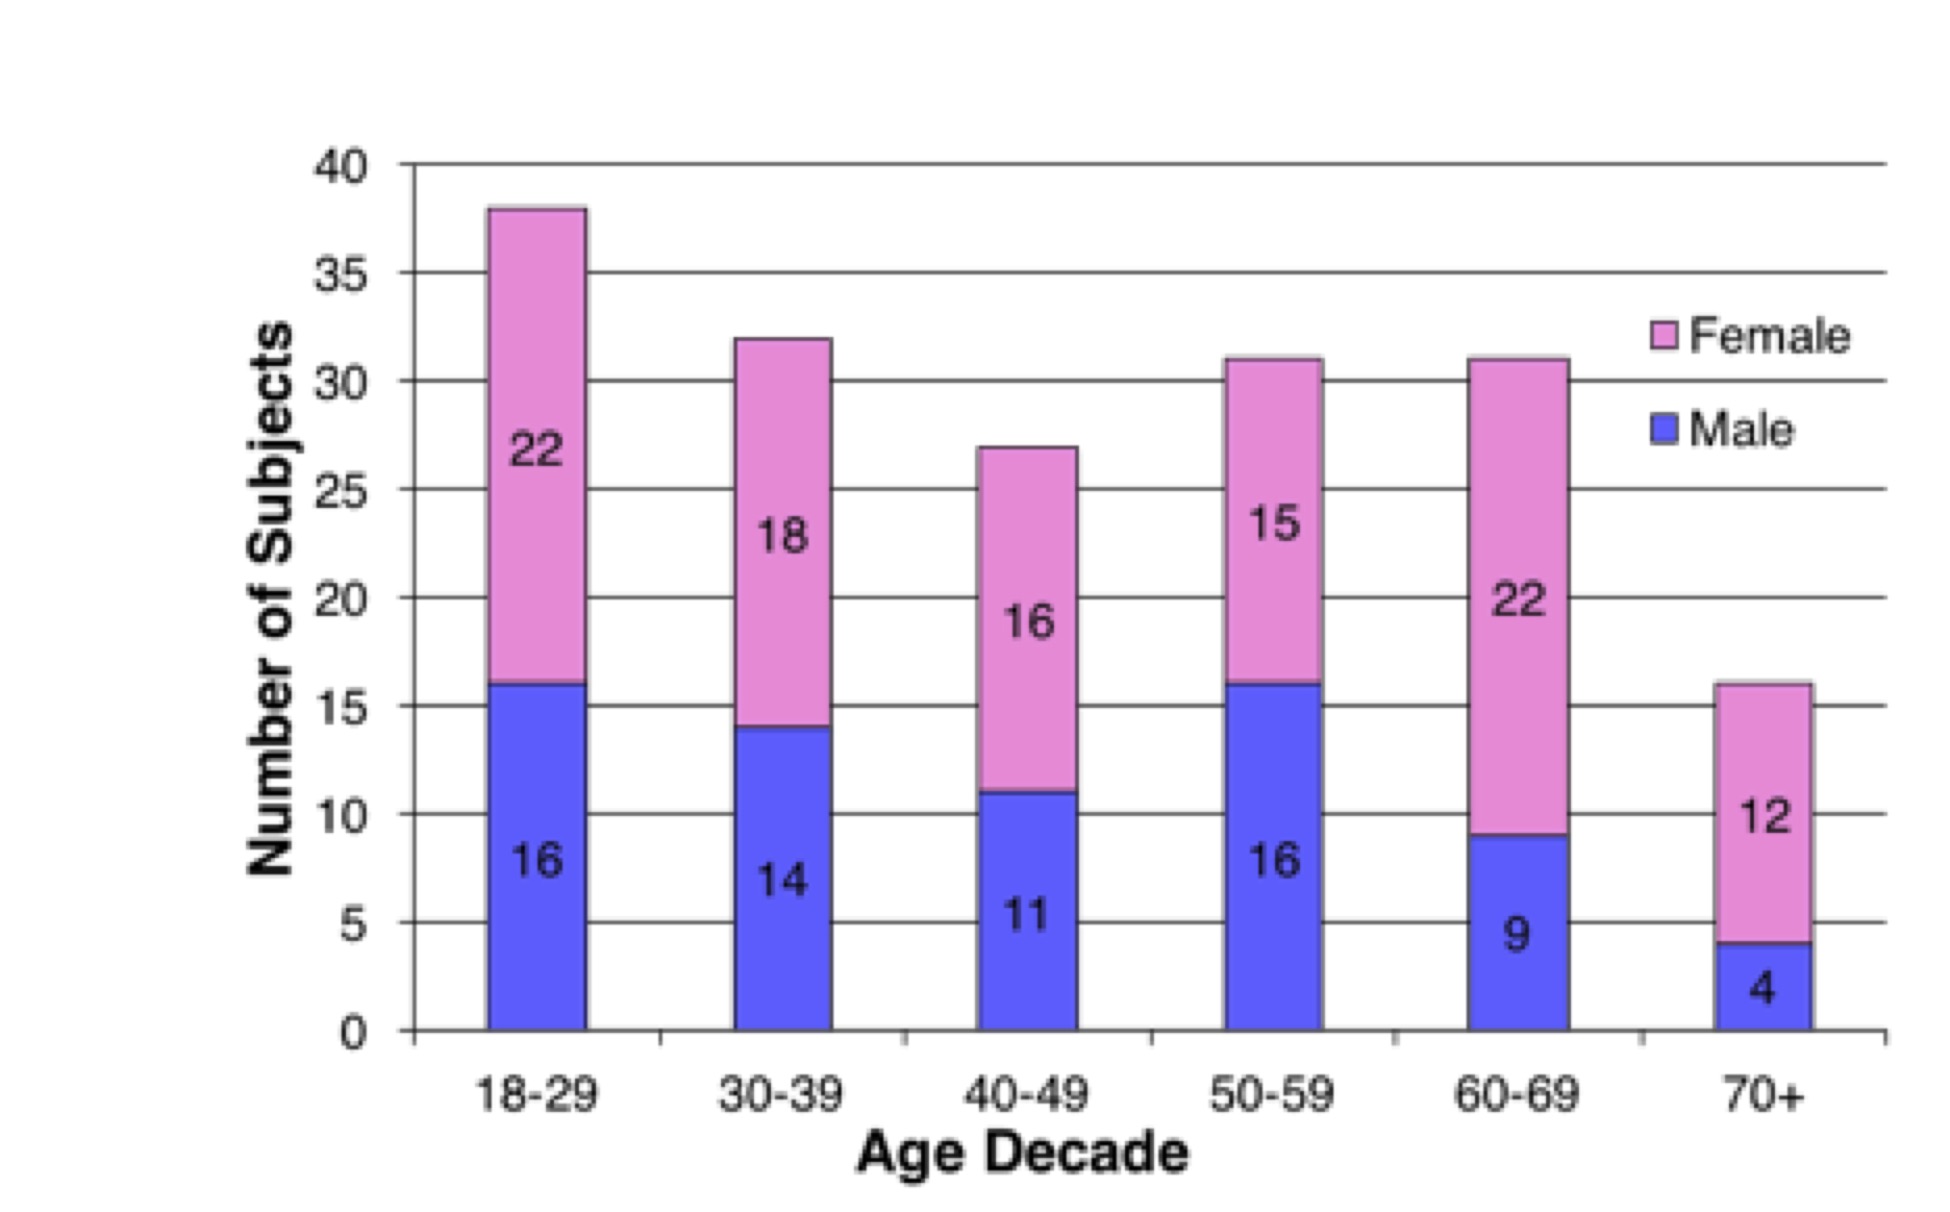
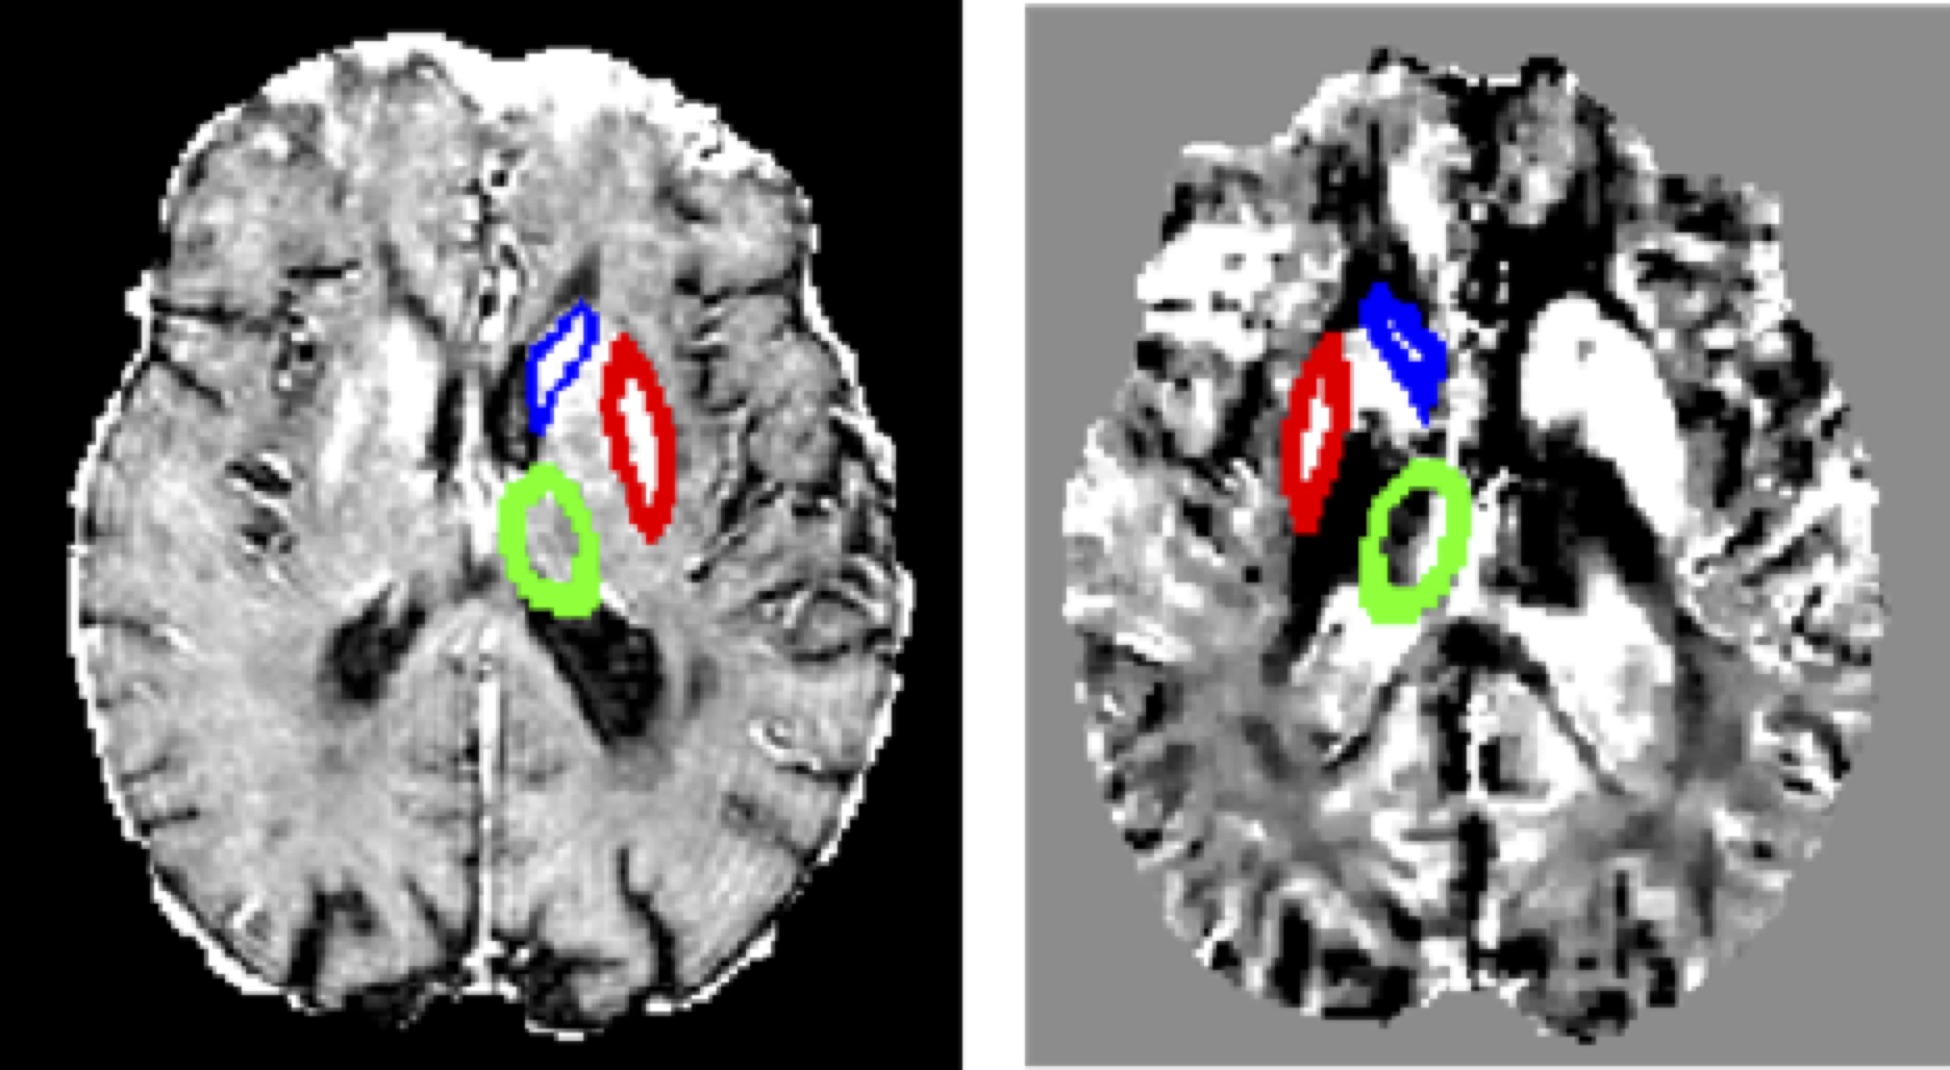
Imaging data were collected as part of the ongoing Calgary Normative Study; a study seeking to understand MR imaging-derived biomarkers of healthy aging. Subjects were validated as being cognitively normal using the Montreal Cognitive Assessment test (MoCA score ≥26 per assessment guidelines3), and were screened to exclude overt neurological or psychiatric illness. All participants (n = 182; mean age ± std dev: 46 ± 16 years, 70 (40%) males, Figure 1) were imaged on a 3 T MR scanner (Discovery 750, GE Healthcare, Waukesha, WI) using a multi-echo T2*-w GRE sequence (TE1 = 3.0 ms, DTE = 3.3 ms, ETL = 8 echoes, TR = 30 ms). The magnitude images were used to determine R2* by Levenberg-Marquardt least squares minimization curve fitting to an exponential function. Susceptibility maps were calculated from the magnitude and phase images by brain extraction, phase unwrapping, background field removal using REPHASE,4 and regularized dipole inversion. The Montreal Neurological Institute 152 1-mm brain atlas, the Harvard-Oxford probabilistic subcortical region labels,5 and FSL6 was used to register the first echo magnitude images and segment brain regions. Variability was assessed in the six deep brain regions (left and right caudate nucleus, putamen, and thalamus, Figure 2). The coefficient of variation (CoV) for each region was calculated for each method. Signal intensity histograms for each region for each method were examined. Analysis of variance (ANOVA) was used to compare the regional coefficients of variation between R2* and QSM. Linear regression versus age was performed for each region and processing method. Significance was set at p < 0.008 (with Bonferroni correction for six comparisons).Results
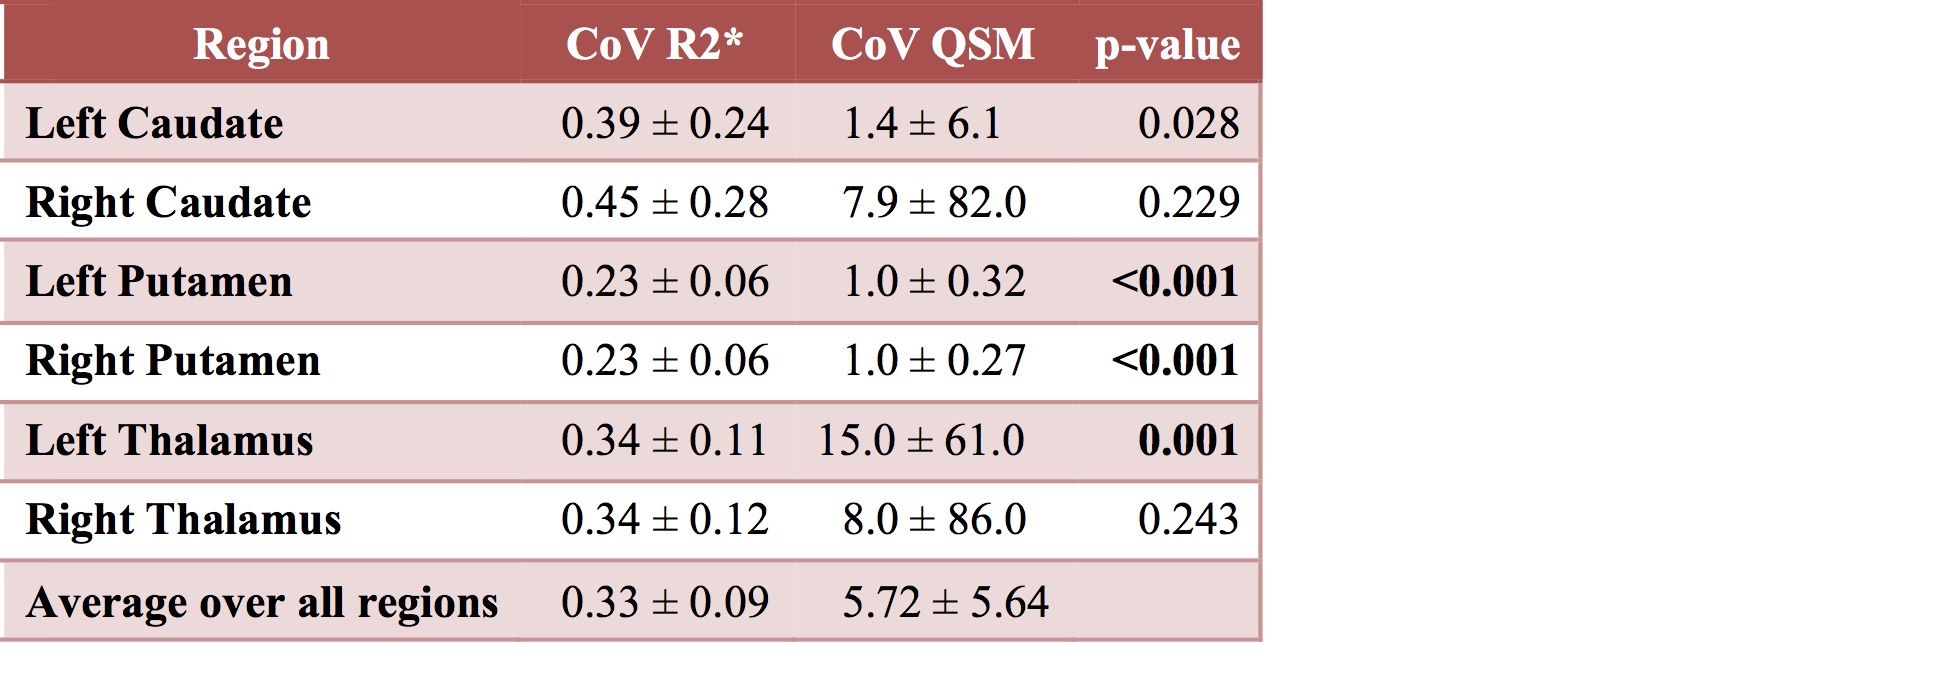
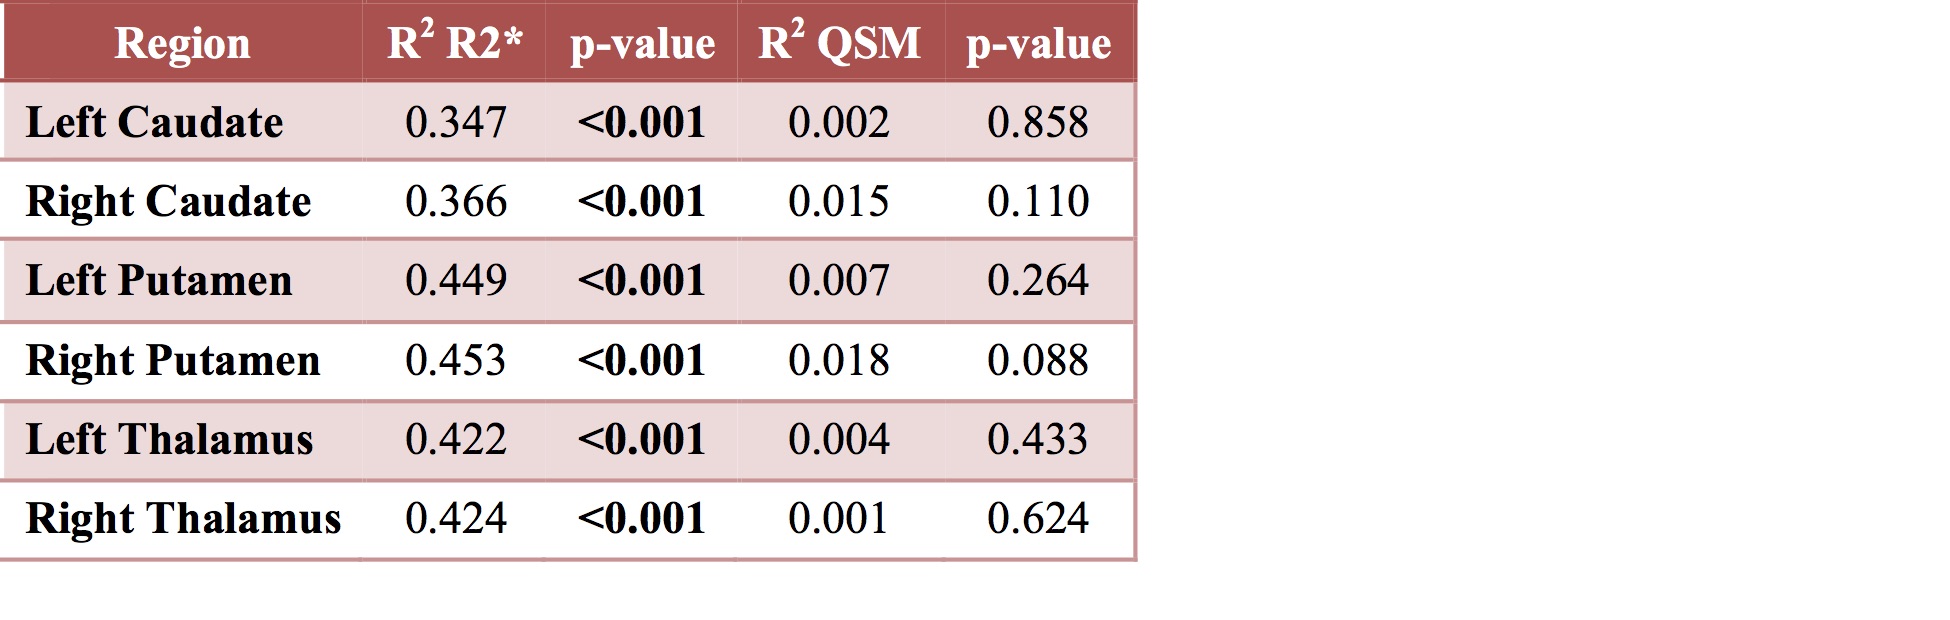
No (0%) R2* maps and 7 (3.8%) susceptibility maps exhibited severe processing artifacts, primarily dipole streaking, and were excluded from analyses. Overall, R2* mapping was found to have on average a lower CoV (0.33 vs 5.72) likely reflecting the higher levels of noise and artifact in QSM data. CoV for R2* measurements were statistically significantly lower in three regions (the left and right putamen, and left thalamus) compared to QSM (Figure 3). A small yet significant relationship was found between CV and age in all regions for R2* mapping (Figure 4). No significant relationship was found between CoV and age in any region for QSM.Conclusions
R2* mapping was found to
have significantly lower variability in 50% of the regions examined. R2*
variability was also affected by age. The greater variability in the QSM data is
likely attributable to the sensitivity of the method to noise and processing errors
causing image artifacts.
Acknowledgements
Funding for this study was provided by the Canadian Institutes for Health Research and the Hopewell Professorship in Brain Imaging.References
1. Langkammer C, Radiology. 2010; 257: 455.
2. Zheng W, NeuroImage. 2013; 78: 68.
3. Nasreddine ZS, J Am Geriatr Soc. 2005; 53: 695.
4. Sun H, Magn Reson Med 2014; 71:1151.
5. http://fsl.fmrib.ox.ac.uk/fsl/fslwiki/Atlases
6. Jenkinson M, NeuroImage. 2012; 62: 782.
Figures