4257
Quantitative cerebral arteriolar vasomotor function mapping by spectral analysis of time series MR signal fluctuations1Faculty of Health Sciences, Hokkaido University, Sapporo, Japan, 2Department of Radiology, National Hospital Organization Hokkaido Medical Center, Sapporo, Japan
Synopsis
Cerebral arteriolar vasomotor function would be a biomarker for early diagnosis of dementia. We developed a quantitative mapping technique for cerebral arteriolar vasomotor function without administrating any agents. The natural respiratory fluctuation of CO2 in arterial blood was used, which alters cerebral blood flow and venous blood oxygenation, and hence modulates the MRI signal. This new technique is based on our finding of a strong correlation in MR signals between the cardiac fluctuation in brain parenchyma and the respiratory fluctuation at the sagittal sinus. Using this new mapping technique, the degeneration of arteriolar vasomotor function associated with aging was observed.
Purpose
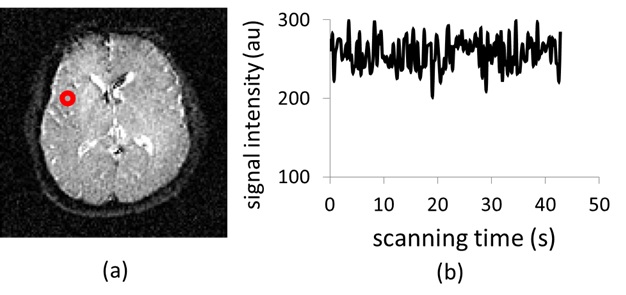
Cerebral arteriolar vasomotor function, i.e. vasodilation and vasoconstriction properties of arteriole, would be a biomarker for early diagnosis of dementia.1,2 At present, there are only invasive techniques available for observing arteriolar vasomotor functions by using vasodilator agents, such as Diamox or CO2 inhalation, which are challenging for patients in clinical practice. On the other hand, the natural fluctuation of CO2 concentration in arterial blood is induced by respiration, and this CO2 fluctuation also changes arteriolar vasomotion that varies cerebral blood flow and venous blood oxygenation which modulate MRI signal (Fig. 1). Focusing on this MR signal modulation in the superior sagittal sinus, which is the largest vein in the brain, we have reported a non-invasive method to obtain the respiratory fluctuation of venous blood oxygenation (ΔY) which represents the averaged arteriolar vasomotor function in the brain.3 In this study, we applied our method to 20’s and 40’s healthy subjects to investigate changes in averaged arteriolar vasomotor function by aging. Then we analyzed the fluctuation in MR signal of brain parenchyma. Using the results of both analyses of MR signal in sagittal sinus and brain parenchyma, the arteriolar vasomotor function was quantitatively mapped in the brain.Materials and Methods
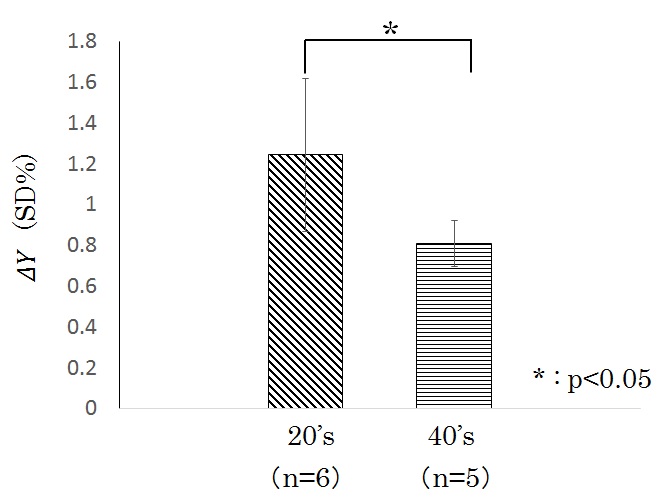
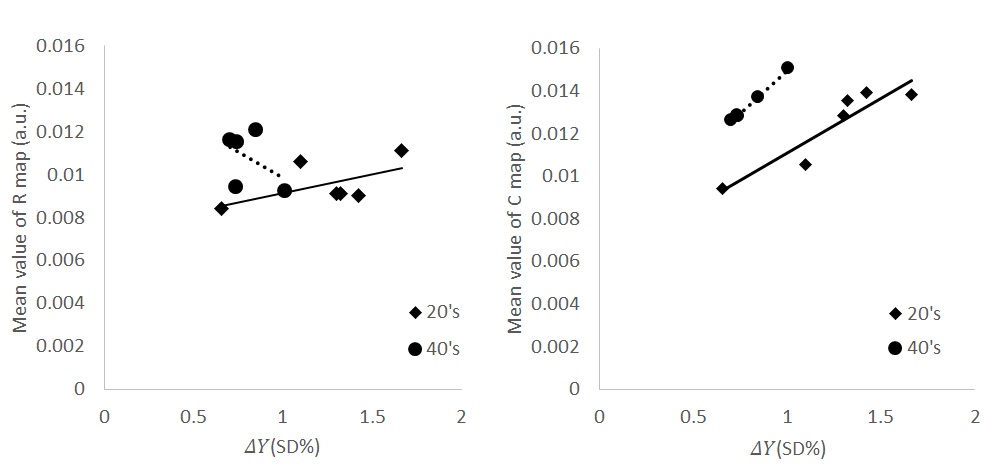
A single slice, perpendicular to the superior sagittal sinus, was imaged every 250 ms for 45 s using spin-echo EPI (TE = 30 ms) with a head coil under a 3-T MRI for 6 healthy 20’s men (23 ± 2 years) and 5 healthy 40’s men (45 ± 3 years). This imaging was performed using varying slice thicknesses (7, 9, 11, 13, 15 mm). The time series of MR signals in the superior sagittal sinus were averaged and Fourier-transformed to obtain the integrated spectral fluctuation intensities (SFI) of the respiratory frequency ranges (R: 0.2–0.5 Hz). The value of ΔY was calculated from the slope of the regression line in the graph of SFI versus average signal intensity.3 A single slice of brain was also successively imaged by the same spin-echo EPI with a 5-mm slice thickness. The time courses of the MR signals of the brain were then Fourier-transformed, pixel by pixel, to map the integrated SFI of R and cardiac (C) frequency ranges. Then the correlation between ΔY obtained from MR signal in the sagittal sinus and the mean value of the integrated SFI in the brain was investigated respectively for R and C frequency range.Results and Discussion
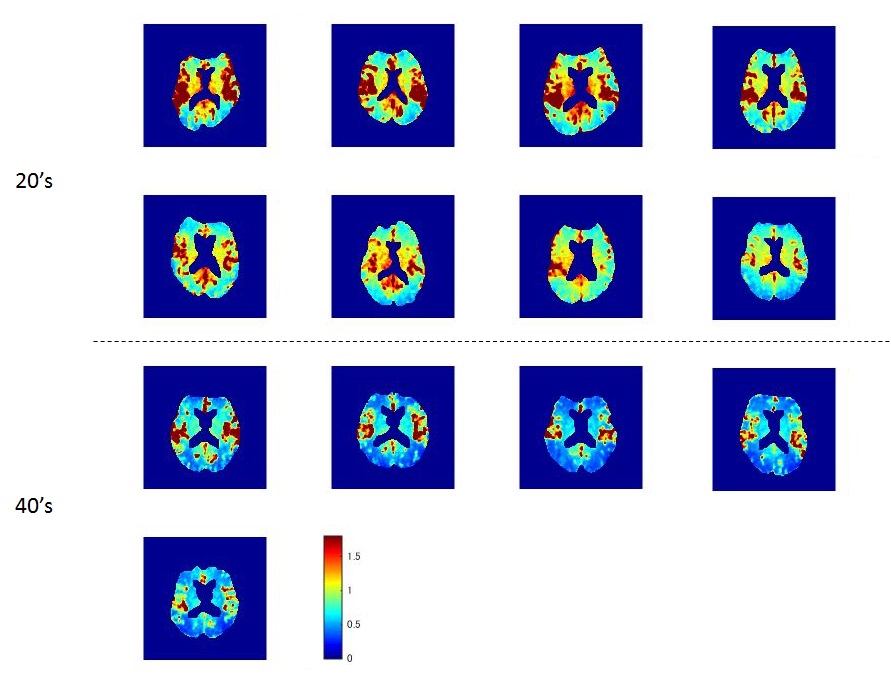
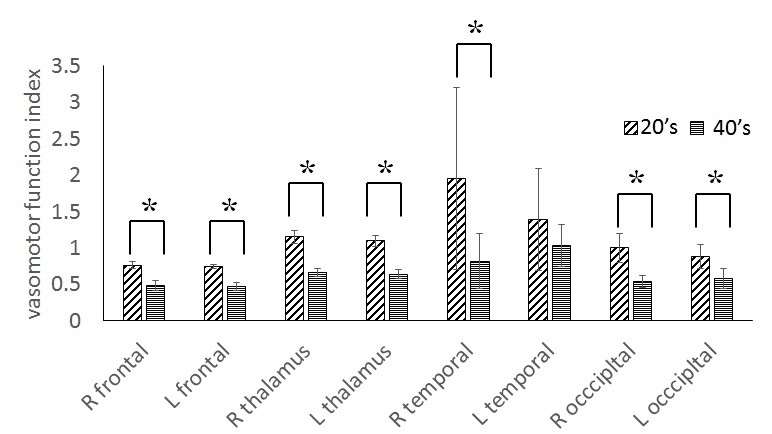
The average value of ΔY of 20’s was obtained as ±1.2% (±SD). This respiratory fluctuation of venous blood oxygenation obtained at 3-T agreed with that obtained at 1.5-T (±1.2%)3, indicating that the magnetic field strength had no influence on the ΔY measurement. The ΔY of 40’s was significantly less than that of 20’s, demonstrating the deterioration of averaged vasomotor function in the brain (Fig. 2). There was no significant correlation between ΔY and the mean value of the R map (20’s: r = 0.57, 40’s: r = 0.45). This may be due to respiratory modulation of the magnetic field inhomogeneity caused by chest motion.4 On the other hand, the mean value of the C map correlated strongly with ΔY (20’s: r = 0.92, 40’s: r = 0.99) (Fig. 3) in spite of the different observation frequencies: cardiac pulsation (C map) and respiration (ΔY ). These results imply that the degree of arteriolar vasomotor function (which appears in ΔY) corresponds to the arterial volume changes (which appears in the C map) caused by the cardiac pulsatile blood pressure. Based on this strong correspondence between the parenchymal mean value of the C map (<C>) and the value of ΔY at the sagittal sinus, the pixel-by-pixel value C(x, y) in the C map was normalized by <C>, and the value of ΔY was multiplied to each pixel-by-pixel normalized value. The mapping of C(x, y)/ <C>×ΔY shows the distribution of the arteriolar vasomotor function quantitatively. Figure 4 shows the arteriolar vasomotor function maps for all subjects. Decreases in arteriolar vasomotor function with aging especially in frontal, occipital lobe and thalamus were clearly observed (Fig. 5). Evidence that cerebral vascular response to inhalation of CO2 in all brain regions decreased with aging5 supports our findings. We showed a new mapping technique for quantitative arteriolar vasomotor function in a single slice with 45-s successive imaging. Multi-slicing could be applied to this imaging technique to obtain complete brain mapping within several minutes.Conclusions
We developed a quantitative mapping technique for cerebral arteriolar vasomotor function free from administration of agents. Using this mapping, the degeneration of arteriolar vasomotor function associated with aging was observed.Acknowledgements
Thanks to Prof. Tamotsu Kamishima and Prof. Rika Yano of faculty of health sciences, Hokkaido university, Prof. Khin Khin Tha of department of radiology and nuclear medicine,Hokkaido university, and Prof. Kohsuke Kodo of department of radiation medicine, Hokkaido university, for providing me valuable suggestions and comments.References
1. Kalaria RN: Vascular basis for brain degeneration: faltering controls and risk factors for dementia. Nutririon Reviews. 2010;68:74-87.
2. Iturria-Medina Y, Sotero RC, Toussaint PJ, et al. Early role of vascular dysregulation on late-onset Alzheimer’s disease based on multifactorial data-driven analysis. Nat Commun 2016; 7: 11934.
3. Tang M, Nishi K, Yamamoto T. Analysis of fluctuation in cerebral venous oxygenation using MR imaging: quantitative evaluation of vasomotor function of arterioles. Magn. Reson. Med. Sci. 2016 (DOI: 10.2463/mrms.mp.2015-0156).
4. Wowk B, McIntyre MC, Saunders JK. k-Space detection and correction of physiological artifacts in fMRI. Magn Reson Med. 1997;38(6):1029-1034.
5. Ito H, Kanno I, Ibaraki M, et al. Effect of aging on cerebral vascular response to PaCO2 changes in humans as measured by positron emission tomography. J Cereb Blood Flow Metab. 2002;22(8):997-1003.
Figures