4256
Enhanced Quality of Myelin Water Fraction Mapping from GRASE Imaging Data of Human Brain using a New Nonlocal Estimation of multi-Spectral Magnitudes (NESMA) Filter1NIA, National Institutes of Health, Baltimore, MD, United States, 2QuaPa, INRA, Clermont-Ferrand, France
Synopsis
Changes in myelin water fraction (MWF) represent a biomarker for central nervous system disease. However, high quality mapping of MWF is challenging, requiring very high signal-to-noise ratio for accurate and stable results. In this work, we demonstrate the potential of a new multispectral filter to permit high quality MWF mapping using in-vivo GRASE brain imaging datasets. Indeed, unlike conventional averaging filters, our filter permits substantial reduction of the random variation in derived MWF estimates while preserving edges and small structures. Finally, our results regarding patterns of MWF as a function of age are consistent with recent literature.
PURPOSE:
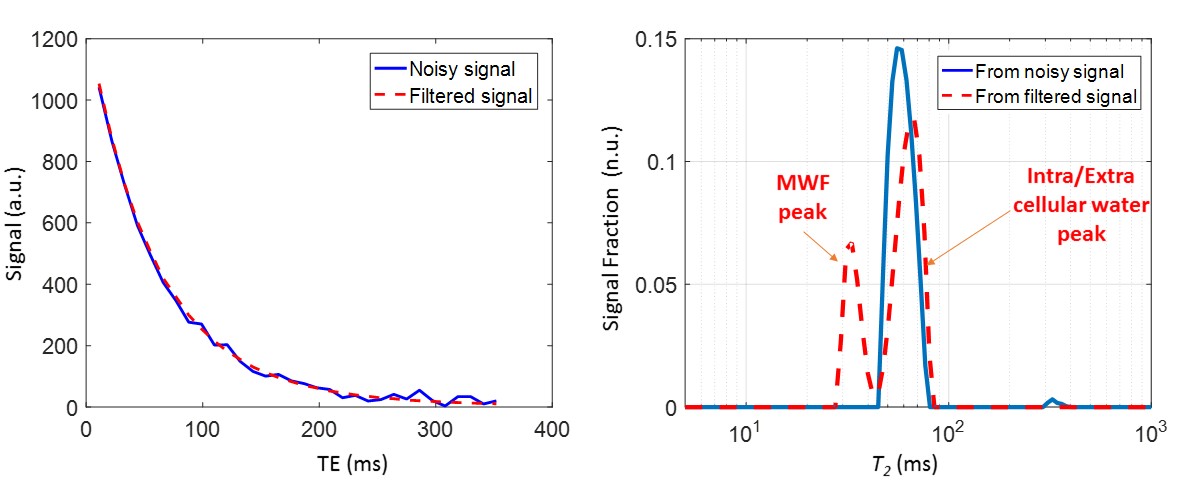
Myelin water fraction (MWF) mapping permits direct visualization of myelination patterns in both the developing brain and in disease.1-4 MWF is conventionally measured through multicomponent T2 analysis of CPMG or GRASE data.1-2,5 Use of the non-negative least-squares algorithm (NNLS) permits analysis without a prior assumption about the number of underlying distinct relaxation components. A well-known drawback of this method is the instability of NNLS with respect to noise, leading to significant inaccuracies in derived MWF estimates (Fig.1).6 To overcome this limitation, noise reduction filters may be applied during post-processing.7 However, conventional filtering can introduce bias and obscure small-scale structures. We have recently developed a new nonlocal multispectral filter that significantly outperforms current filters, including available nonlocal filters, in term of noise reduction and detail preservation in T1 and T2 weighed image sets.8 Here, we evaluated the performance of this filter for MWF determination from multiple echo imaging data, and compared the results to those calculated from unfiltered images and from images filtered using conventional Gaussian averaging (GA) or boxcar averaging (BA) filters.MATERIALS & METHODS:
Image acquisition: 3D GRASE images were acquired from the brains of two healthy subjects (male, 24-years-old; female, 43-years-old) using a 3T Philips Achieva MRI system (Philips, Best, The Netherlands). 32 echoes were acquired with TEn=n*ΔTE, where ΔTE=11ms, TR=1000ms, EPI factor=3, acquisition voxel size=1.5mm x 1.5mm x 3mm and reconstructed voxel size=1mm x 1mm x 3mm. Image filtering: The filter we have recently introduced restores the amplitude of an index voxel using a maximum likelihood estimate (MLE) based on M pre-selected voxels with similar signal decays.8 In the present implementation, to decrease processing time, the MLE is replaced here by the simple average of the amplitudes of those similar voxels. This markedly decreases the computational time while maintaining nearly equivalent filtering performance (data not shown). The number M of similar pixels is conventionally held constant in the construction of nonlocal filters. However, the optimal value may in fact vary among different image regions. We therefore implemented a spatially adaptive selection of M using relative Euclidian distance (RED), defined as the sum over all TEs of the absolute signal differences between the index voxel and a given voxel, divided by the averaged signal value over all TEs of the index voxel. Voxels with RED ≤ 5% were considered similar to the index voxel. We denote this new filter by Nonlocal Estimation of multi-Spectral Magnitudes (NESMA). For comparison, we also implemented 5x5x3 GA and BA filters. MWF mapping: In each voxel, MWF was calculated using a regularized NNLS algorithm. The regularization factor was defined based on the discrepancy principle such that 1.02χ2min≤ χ2 ≤1.025χ2min, where χ2min is the calculated misfit between the data and the model obtained from the nonregularized solution.1,6 Finally, the MWF is calculated as the integral of the T2 distribution between 8 and 40 ms, normalized by the total area under the distribution.1-2,5-7RESULTS & DISCUSSION:
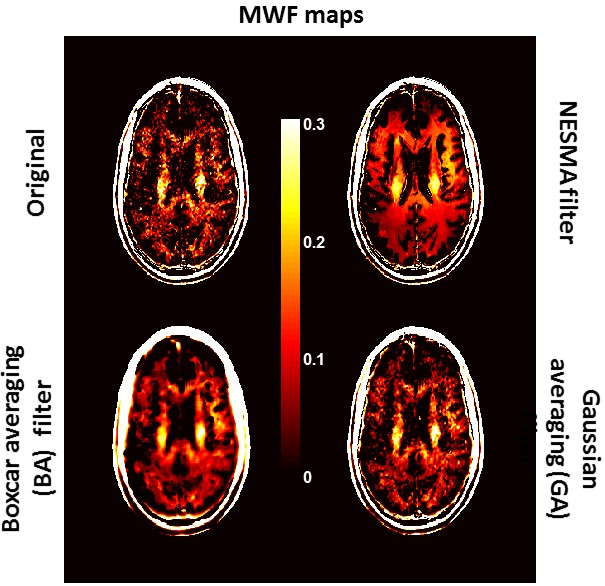
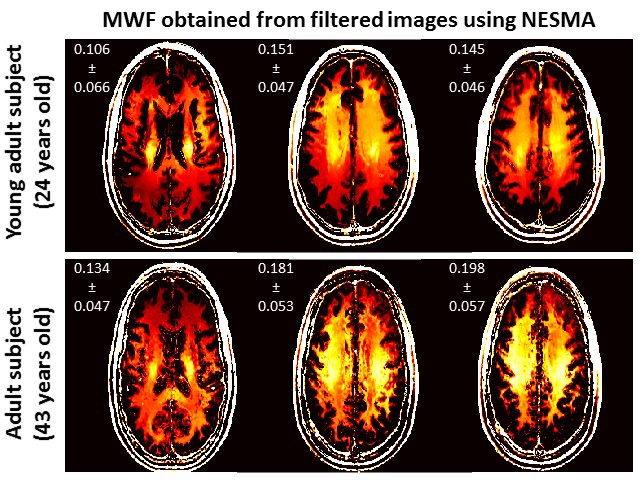
Fig.2 shows examples of MWF maps calculated from unfiltered and filtered images using the NESMA, GA and BA filters. As is readily seen, there is substantial random variation in derived MWF maps from unfiltered images. While the random variation was reduced using the GA or BA filters, this comes at the expense of blurring and loss of image detail. However, MWF maps calculated from images filtered with NESMA exhibited preservation of edges and small structures, as well as greatly reduced random variation compared with unfiltered images. Fig.3 shows a comparison of derived MWF values from the brains of the two subjects. MWF maps calculated from images filtered with NESMA are displayed for three different slices. The results indicate higher MWF values in a middle-aged subject in several image regions as compared to the younger subject, in good agreement with recent literature.9 These preliminary analyses, although only on two subjects, serve to indicate the consistency of our method with previous literature and to demonstrate the sensitivity of the measurement to MWF changes with age.CONCLUSION:
Estimation of MWF in the human brain from GRASE imaging data was markedly improved through use of the NESMA filter. NESMA allows preservation of edges and small structures in derived MWF maps. The use of NESMA may contribute significantly to the goal of high quality MWF mapping in clinically feasible imaging times.Acknowledgements
This work was supported by the Intramural Research Program of the NIH, National Institute on Aging.References
1. Whittall KP, MacKay AL, Graeb DA, et al. In vivo measurement of T2 distributions and water contents in normal human brain. Magn Reson Med. 1997;37(1):34-43.
2. Laule C, Vavasour IM, Moore GR, et al. Water content and myelin water fraction in multiple sclerosis. A T2 relaxation study. J Neurol. 2004;251(3):284-293.
3. Deoni SCL, O'Muircheartaigh J, Elison JT, et al. White matter maturation profiles through early childhood predict general cognitive ability. Brain Struct Funct. 2016;221(2):1189-1203.
4. Bouhrara M, Spencer RG. Improved determination of the myelin water fraction in human brain using magnetic resonance imaging through Bayesian analysis of mcDESPOT. NeuroImage 2016;127:456-471.
5. Prasloski T, Rauscher A, MacKay AL, et al. Rapid whole cerebrum myelin water imaging using a 3D GRASE sequence. NeuroImage 2012;63:533-539.
6. Zhang J, olind SH, Laule C, et al. Comparison of myelin water fraction from multiecho T2 decay curve and steady-state methods. Magn Reson Med 2015;73(1):223-232.
7. Jones CK, hittall KP, MacKay AL. Robust myelin water quantification: averaging vs. spatial filtering. Magn Reson Med 2003;50(1):206-209.
8. Bouhrara M, Bonny JM, Ashinsky BG, et al. Noise estimation and reduction in multispectral magnetic resonance images. IEEE Trans Med Imaging 2016;DOI:10.1109/TMI.2016.2601243.
9. Arshad M, Stanley JA, Raz N, et al. Adult age differences in subcortical myelin content are consistent with protracted myelination and unrelated to diffusion tensor imaging indices. NeuroImage 2016;143:26-39
Figures