4255
Measuring Tumor Boundary Variability to Improve Automated Segmentation of Brain Tumors Using Multimodal MRI.1Department of Radiological Sciences, David Geffen School of Medicine., University of California, Los Angeles, Los Angeles, CA, United States, 2Department of Bioengineering, David Geffen School of Medicine., University of California, Los Angeles, Los Angeles, CA, United States
Synopsis
We present an automated brain tumor segmentation framework to measure the variability associated to the tumor boundary that is observed on multimodal MRI; this is a vital task to accomplish as quantitative and automated tumor measurements and assessment become the standard in neuro-oncology for disease diagnosis, treatment planning, and clinical monitoring.
Purpose
Quantitative measurement and assessment of medical images have an important role in disease diagnosis, treatment planning, and clinical monitoring. Automated segmentation of gliomas using MRI is particularly challenging as the estimation of tumor extent is inherently variable due to the different perceptions clinicians can have with respect to the shape and appearance characteristics of the tumor; as well as the study acquisition parameters (e.g. echo time, repetition time, etc.), strategies (2D vs. 3D), and MR scanner variations (e.g. field strength, gradient performance, etc.). These factors underscore the need for a quantitative approach that can generate consistent and robust measurements of brain tumor variability. We present an automated tumor segmentation method using multimodal MR images that measures the variability associated to the tumor boundary to provide a segmentation error estimate. We evaluated the performance of this approach on a sample of 130 subjects from public and private datasets, obtaining an average Dice coefficient (similarity metric) of 0.811, an improvement from what has been previously reported [1].Methods
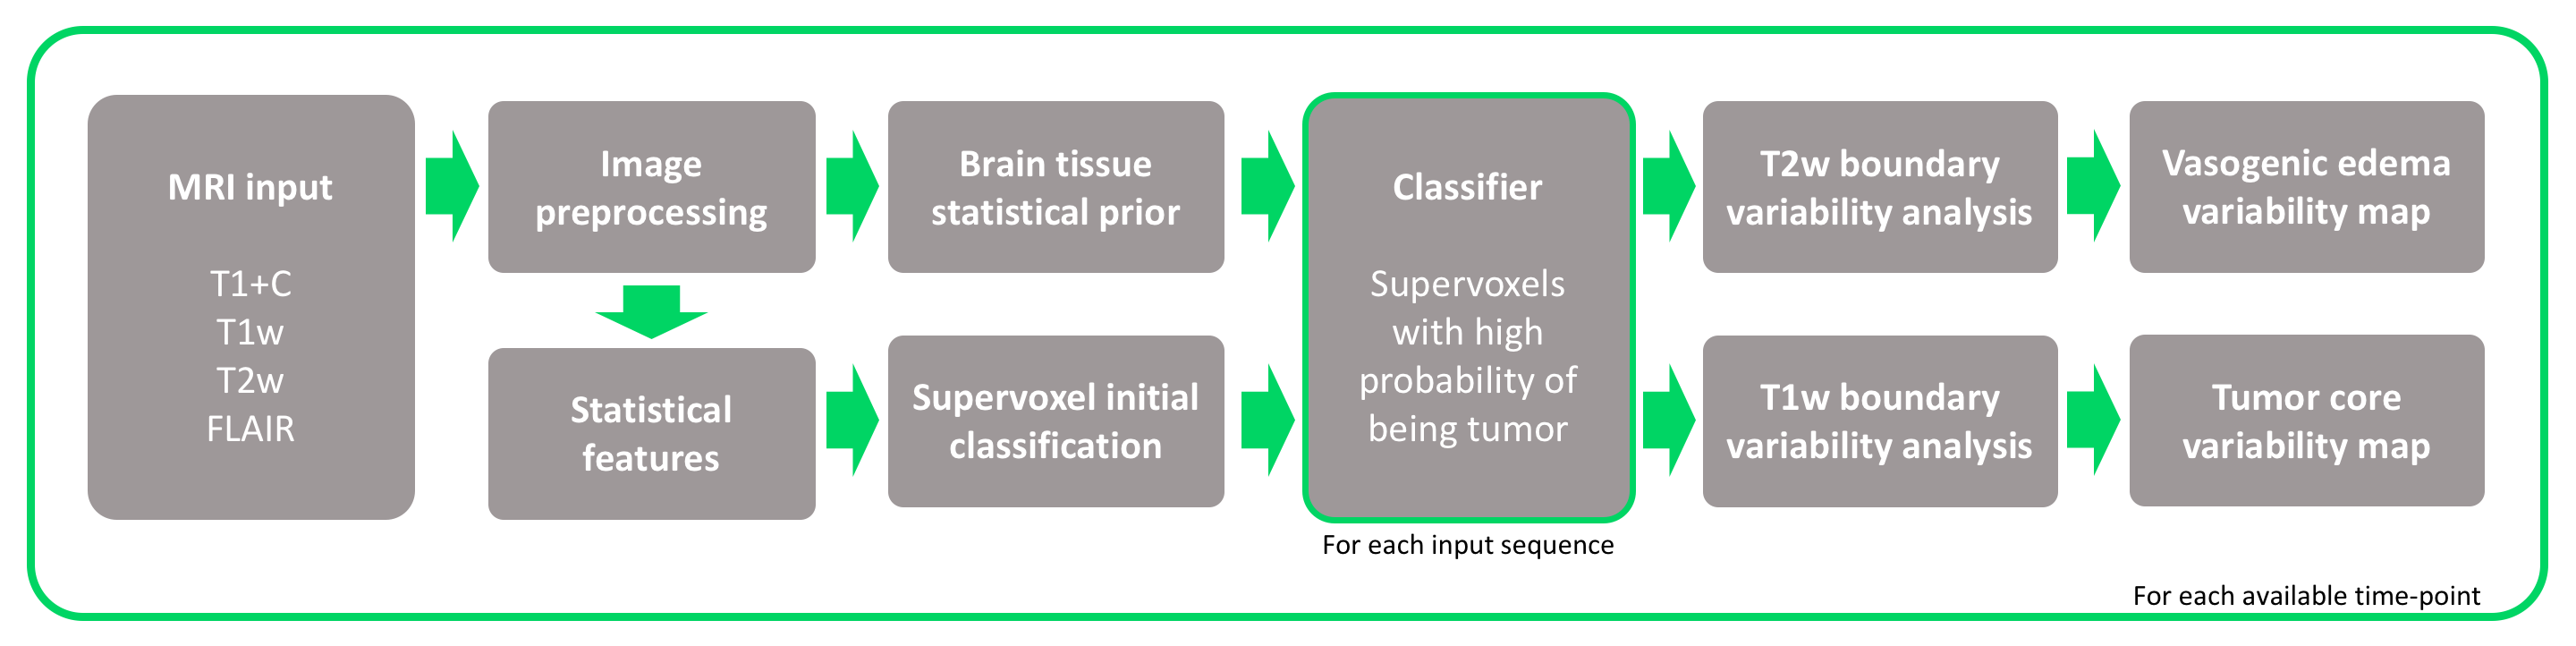
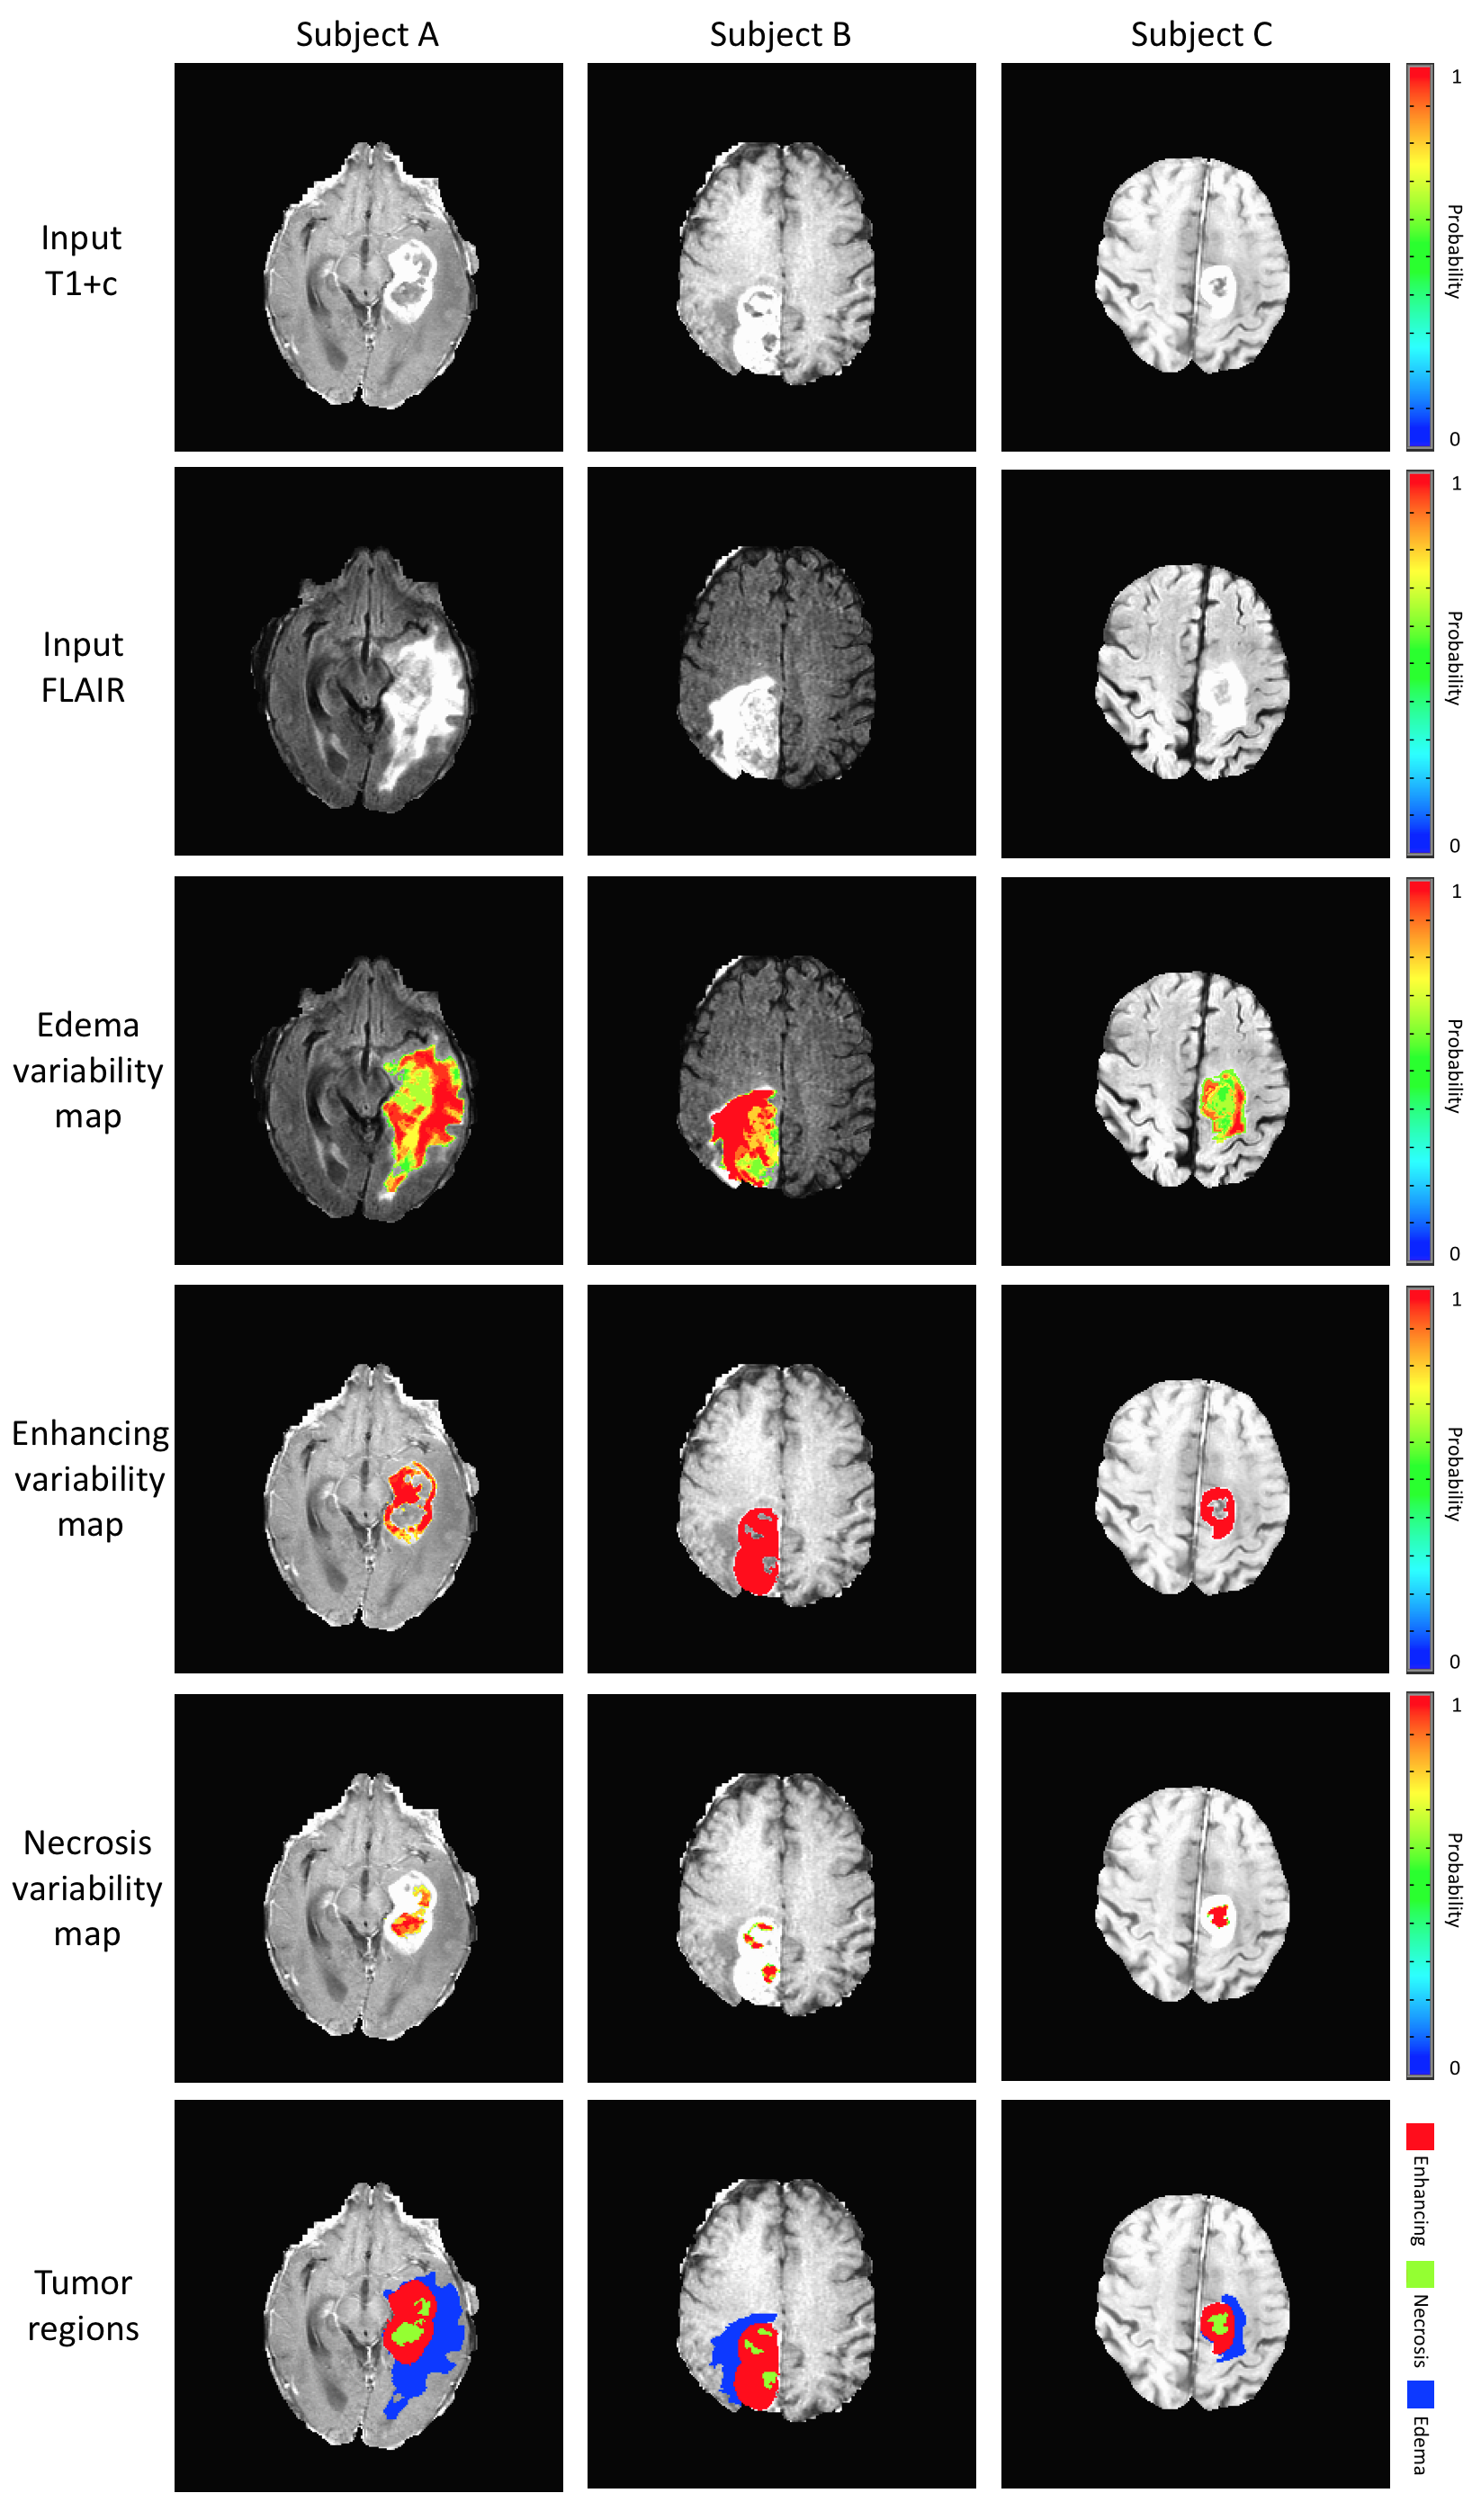
We propose that this inherent tumor variability can be leveraged to provide a more accurate assessment of tumor burden. While multiple automated segmentation techniques have been developed [2], an approach that accounts for the variability in tumor boundaries remains unexplored. For this purpose, we developed an automated method using parametric tissue maps as prior probability distribution [3] and intensity-based statistical features to perform a series of context- and knowledge-based measurements to identify different tumor components (i.e., edema, enhancing, necrosis, non-enhancing tumor) using multimodality MRI. A pipeline of standard image preprocessing techniques is implemented, followed by our approach, establishing a process that automatically generates tumor contours for groups of patients with multiple scans over time (Figure 1). First, the algorithm registers the pre-contrast T1-weighted images, post-contrast T1-weighted images (T1+C), T2-weighted images, and T2-weighted fluid attenuated inversion recovery (FLAIR) images to a standard reference [4]. Second, all images are bias-corrected, skull stripped, denoised, and normalized. Next, a series of tissue probability maps are calculated to provide a prior base about the distribution of tumor and normal tissues (gray matter, white matter, and cerebrospinal fluid (CSF)) using a Bayesian mixture model to calculate the posterior probability of each tissue class and the expectation maximization (EM) algorithm to assign the probability to each pixel for each tissue type. Statistical features (e.g., intensity-based, symmetry, texture-based) and image clusters (supervoxels) are subsequently calculated and combined with the tissue probability maps to locate regions of interest (ROIs) that correspond to the highest probability of being tumor. Finally, different approximations of the tumor boundary can be obtained by analyzing the intensity distribution (histogram) of these regions, originating tumor maps that represent the boundary variability or alternatively a binary mask with a segmentation error estimate (Figure 2). This imaging-based metric of tumor boundary variability emulates the different possible boundaries clinicians can obtain while interpreting imaging studies due to differences in image perception and algorithm parameters.Results and Discussion
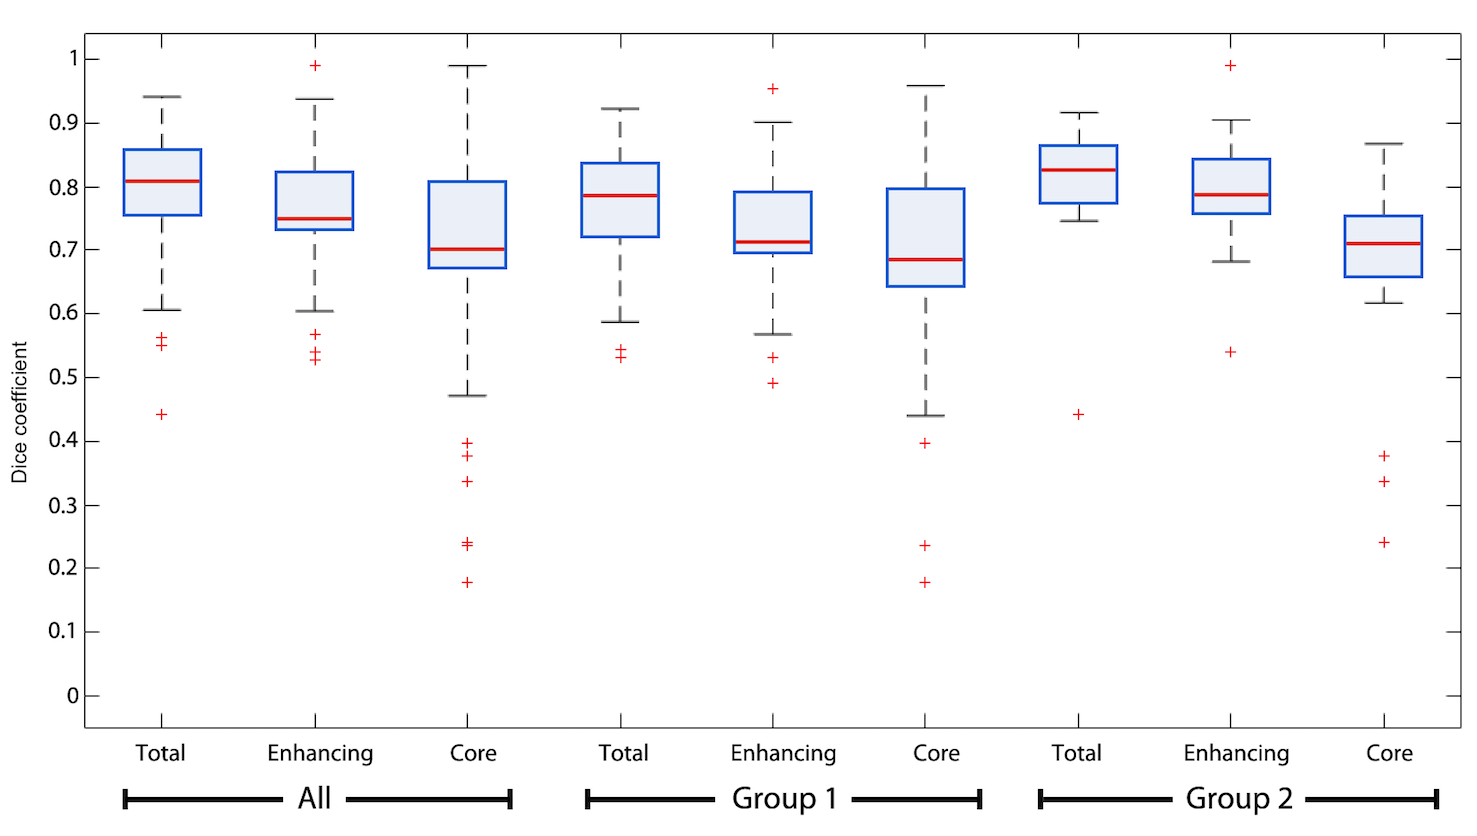
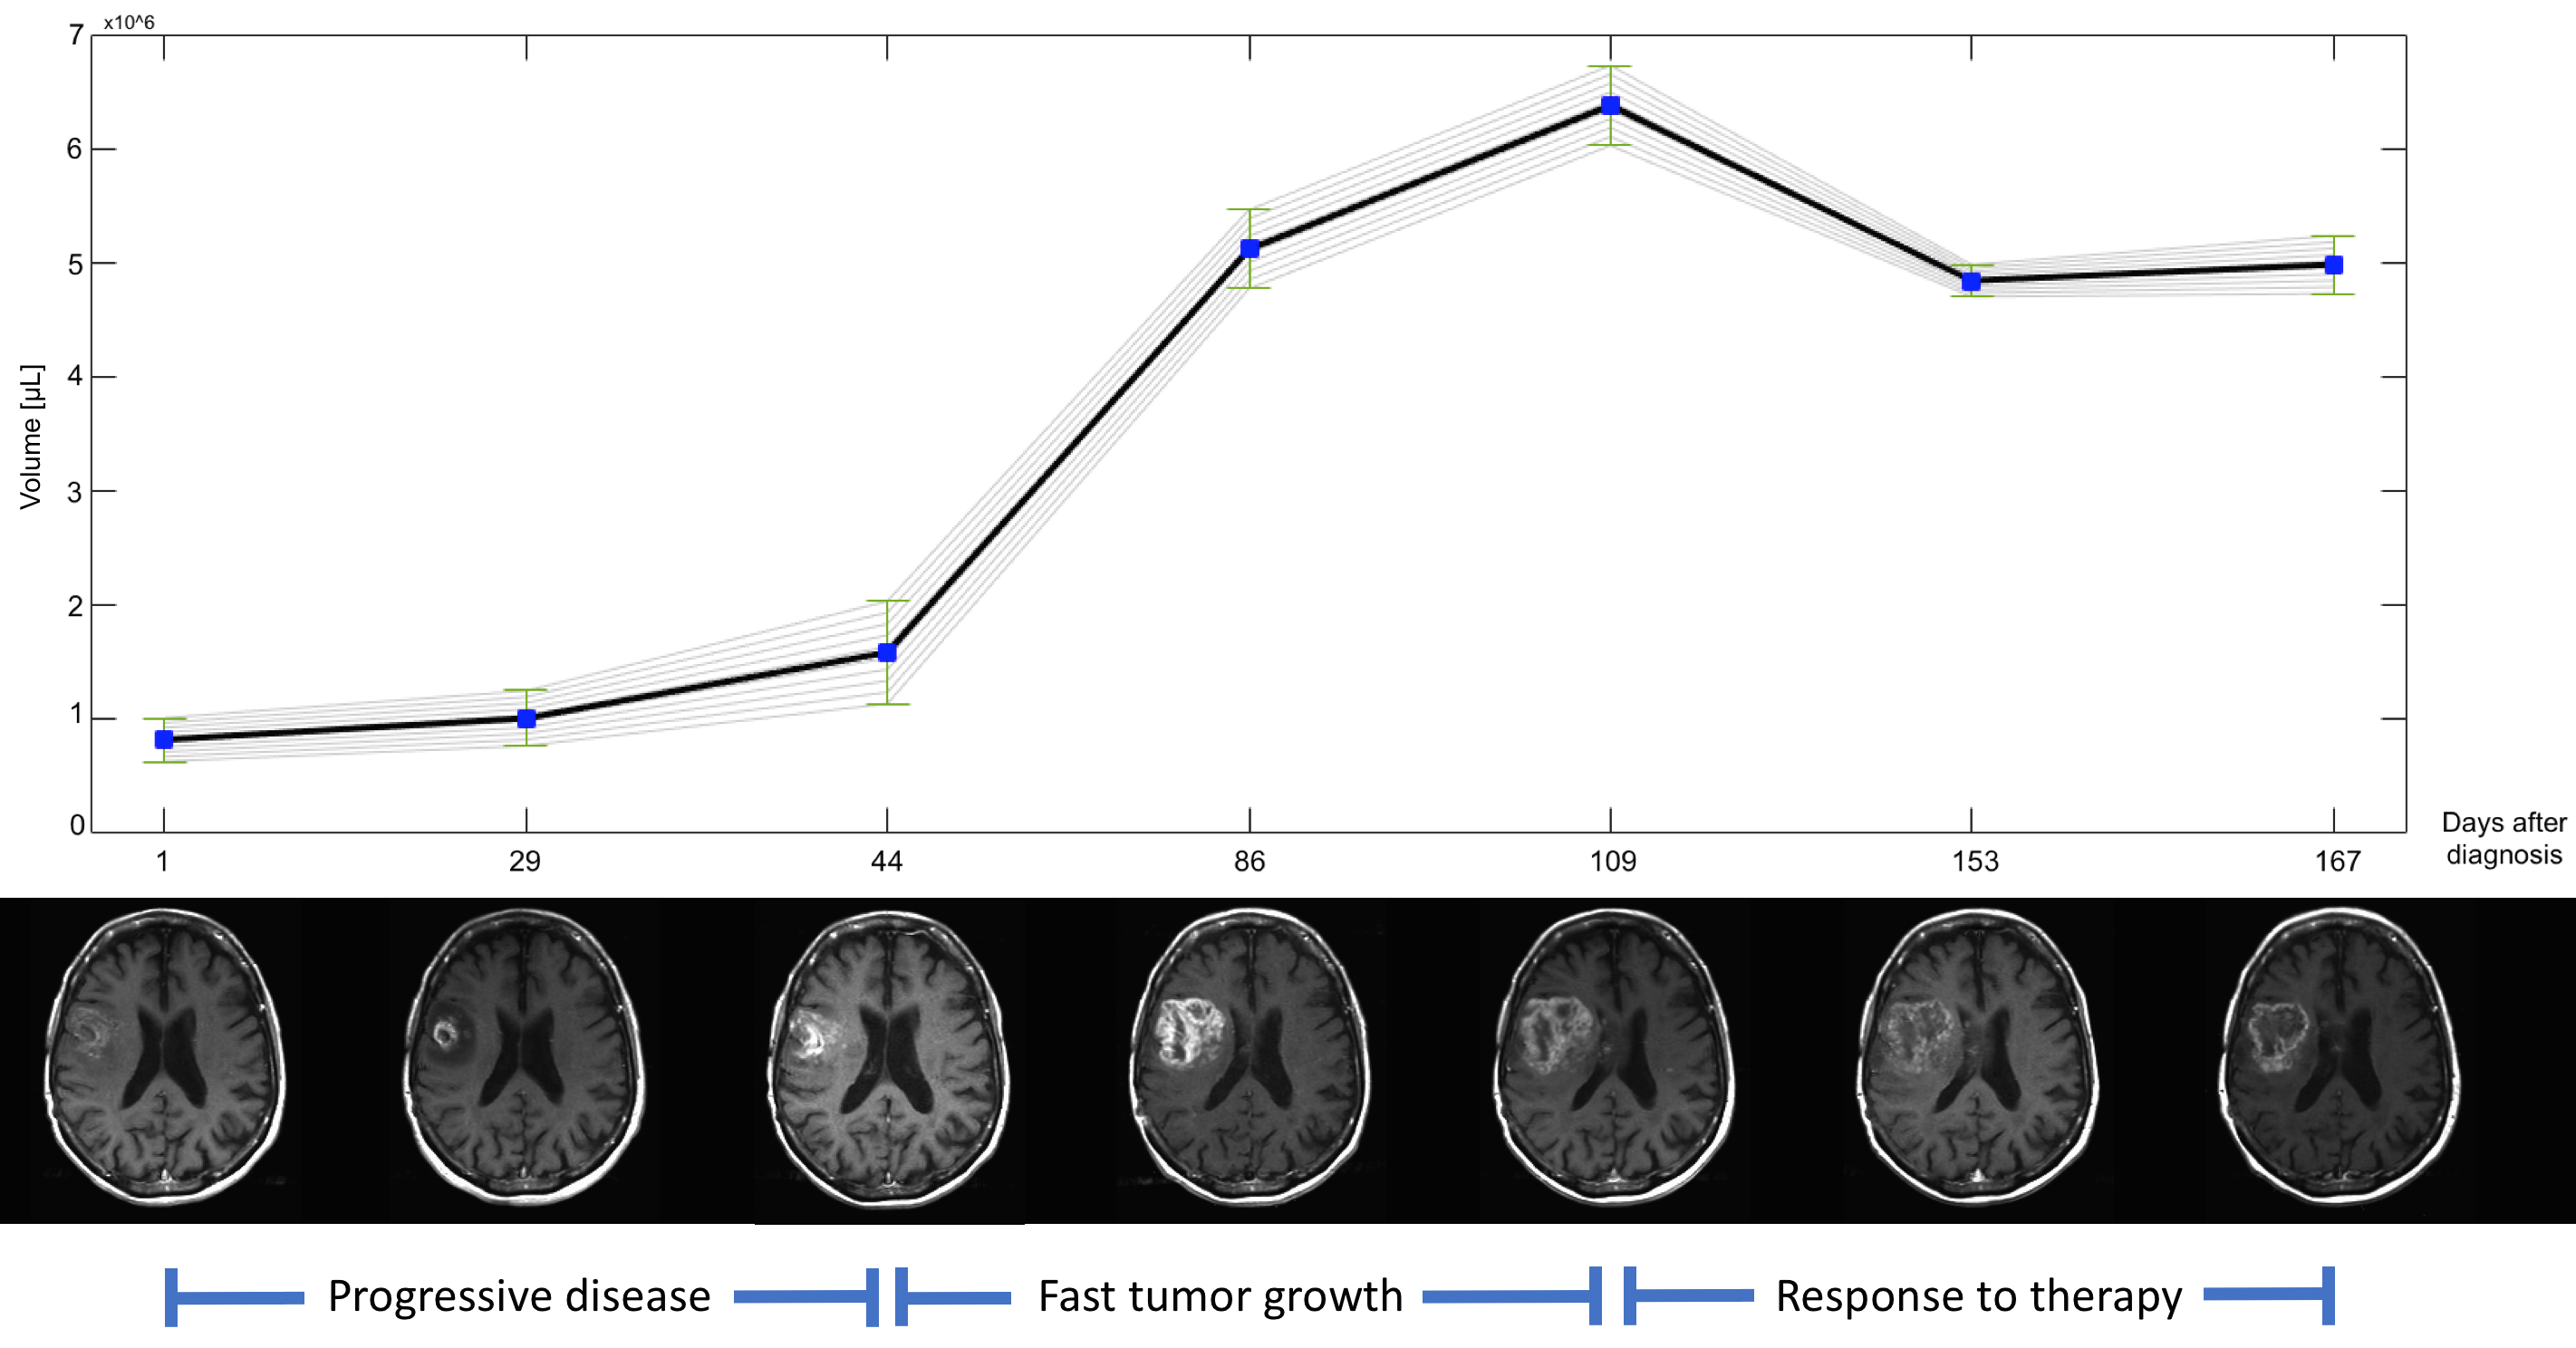
This approach was tested on two datasets, 110 cases from TCGA [5] and 20 cases from our institutional dataset, evaluating its performance with respect to a gold standard generated by an expert neuroradiologist. The average Dice coefficient (Figure 3) was 0.811 (0.798 for the TCGA dataset and 0.825 for the institutional dataset) for total tumor, 0.758 (0.726 and 0.790) for the enhancing component, and 0.702 (0.685 and 0.719) for tumor core (excluding edema). Our results are comparable to other current methods, with the additional improvement of the estimation of segmentation variability (Figure 4). The inclusion of such an error metric to tumor segmentation results could potentially improve critical tasks, such as the evaluation of significant tumor change over time (progressive disease vs positive response to treatment), treatment effectiveness evaluation, and overall accuracy of clinical decisions.Conclusion
A multimodal framework for automatic brain tumor segmentation was developed by determining variability estimates of the tumor boundary. The method works by first preprocessing and conditioning multimodal MR images, obtaining a prior distribution for normal brain tissues, determining a preliminary tumor ROI based on higher-order image features from non-normal tissues, and then analyzing the total variation observed on the local tumor region to determine the possible boundaries for each tumor sub-region. As imaging technology and standards rapidly change and increase in complexity in neuro-oncology, the addition of an accurate and robust method that identifies the tumor boundaries with an estimate of error can improve upon the manual measurements currently employed for assessment.Acknowledgements
Research supported by the National Cancer Institute of the National Institutes of Health under award number R01CA1575533References
1. Menze, Bjoern, Mauricio Reyes, and Koen Van Leemput. "The Multimodal Brain TumorImage Segmentation Benchmark (BRATS)." (2015).
2. Bauer Stefan, et al. "A survey of MRI-based medical image analysis for brain tumor studies." Physics in medicine and biology 58.13 (2013): R97.
3. Lorio, Sara, et al. "New tissue priors for improved automated classification of subcortical brain structures on MRI." NeuroImage 130 (2016): 157-166.
4. M. Jenkinson, P.R. Bannister, J.M. Brady, and S.M. Smith. Improved optimization for the robust and accurate linear registration and motion correction of brain images. NeuroImage, 17(2):825-841, 2002.
5. The Cancer Genome Atlas. TCGA Research Network: http://cancergenome.nih.gov/
Figures