4252
Textural Analysis Tool for Grading of Astrocytoma on Quantitative Susceptibility MappingYihao Yao1, Ilhami Kovanlikaya2, Ramin Jafari3, Yi Wang2,4, and Wenzhen Zhu1
1Department of Radiology, Tongji Hospital, Tongji Medical College, Huazhong University of Science & Technology, Wuhan, People's Republic of China, 2Department of Radiology, Weill Cornell Medical College, New York, NY, United States, 3Department of Biomedical Engineering, Cornell University, Ithaca, NY, United States, 4Biomedical Engineering, Cornell University, Ithaca, NY, United States
Synopsis
The accuracy of grading astrocytic brain tumors using texture analysis (TA) on quantitative susceptibility mapping (QSM) was studied. For texture analysis training data set, most discriminant factor (MDF1) values were significantly different for low grade and high grade astrocytomas (p<0.01), as well as Grade II and III, Grade II and IV, Grade III and IV (p<0.01). For texture analysis test data set, 19/20 cases in differentiating low grade from high grade astrocytomas, 16/20 cases in Grade II, III and IV differentiation were correctly classified. TA promises to be a useful tool for grading astrocytoma on QSM.
Objective
The objective was to determine whether textural analysis (TA) could grade astrocytic brain tumors accurately by using quantitative susceptibility mapping (QSM).Background
It is important to grade the astrocytoma prior to making an appropriate choice of the therapeutic intervention, because prognosis and reaction to therapy vary according to tumor grade1. Angiogenesis plays an important role in tumor malignancy. Its associated micro and macro hemorrhages can be measured by Quantitative Susceptibility Mapping (QSM), which is highly sensitive to paramagnetic iron in blood degradation products2. Texture analysis describes a variety of image-analysis techniques that enable quantification of the gray-level patterns, pixel interrelationships, and the spectral properties of an image, including some that are imperceptible to the human visual system3.Methods
In this study, forty two patients with first diagnosed astrocytoma were recruited from two institutions (n=14 for grade II, n=7 for grade III and n=21 for grade IV). The 42 patients were randomly divided into training group (n=22) and test group (n=20). Multi-echo gradient echo (GRE) imaging plus standard T1, T2 weighted imaging were acquired. QSM was generated from GRE data using a morphology enabled dipole inversion method. Regions of interest (ROI) were defined consisting each slice from entire tumor volume on post contrast T1 or T2 weighted images if there isn’t any contrast enhancement. Mean relative susceptibility was compared between different grades using independent-samples t test and ANOVA. ROIs were loaded into MaZda package4 to perform texture analysis using linear discriminant analysis (LDA) and obtain the most discriminant factor (MDF1) values. Receiver operating characteristic (ROC) curves were constructed to determine the diagnostic accuracy.Results
Hyperintense intratumoral susceptibility based signals were found to increase with increasing tumor grade (Fig.1). Over the entire tumor volume, low grade (grade II) and high grade (grade III and grade IV) astrocytomas could be separated by mean susceptibility value (p=0.0018). Grade II from grade IV (p=0.004), Grade III from grade IV (p=0.048) could also be differentiated by mean susceptibility value (Fig. 2). For texture analysis training data set, MDF1 values were significantly different for low grade and high grade astrocytomas (p<0.01) with a cutoff value of 0.004485. Grade II and III, Grade II and IV, Grade III and IV astrocytomas could also be separated with MDF1 (p<0.01) with cutoff values of 0.0184, 0.001835, -0.00954 (Fig. 3). For texture analysis test data set, the LDA model correctly classified 19/20 (95%) cases in differentiating low grade from high grade astrocytomas using cutoff value of 0.004485. In addition, LDA model successfully classified 16/20 (80%) patients, differentiating grades II, III, and IV in the test set using cutoff values of 0.0184 and -0.00954 (Fig.4).Discussion and conclusions
It is reported that TA on T1WI and T2WI could distinguish malignant/benign brain tumors, edema, normal white matter and grey matter, but cannot differentiate different types of tumors5. And findings in another study show that certain co-occurrence features could help differentiate brain malignancies on post-contrast T1WI6. QSM could provide more information related to the pathological changes in brain tumors without using contrast enhanced agent, and has higher resolution than conventional T1WI and T2WI. TA promises to be a useful tool for grading astrocytoma on multi-institutional QSM data sets. This method requires further validation in a larger cohort study.Acknowledgements
We are acknowledged support from grants: R01NS072370, R01NS090464, R01NS095562.References
1. Norden AD, Wen PY. Glioma therapy in adults. The neurologist 2006;12:279-292 2. Chen W, Zhu W, Kovanlikaya I, et al. Intracranial calcifications and hemorrhages: characterization with quantitative susceptibility mapping. Radiology 2014;270:496-505 3. Kassner A, Thornhill RE. Texture analysis: a review of neurologic MR imaging applications. AJNR American journal of neuroradiology 2010;31:809-816 4. Szczypinski P M, Strzelecki M, Materka A, et al. MaZda--a software package for image texture analysis. Comput Methods Programs Biomed 2009; 1: 66-76 5. Herlidou-Meme S, Constans JM, Carsin B, et al. MRI texture analysis on texture test objects, normal brain and intracranial tumors. Magn Reson Imaging 2003;21:989-993 6. Eliat PA, Olivie D, Saikali S, et al. Can dynamic contrast-enhanced magnetic resonance imaging combined with texture analysis differentiate malignant glioneuronal tumors from other glioblastoma? Neurology research international 2012;2012:195176Figures
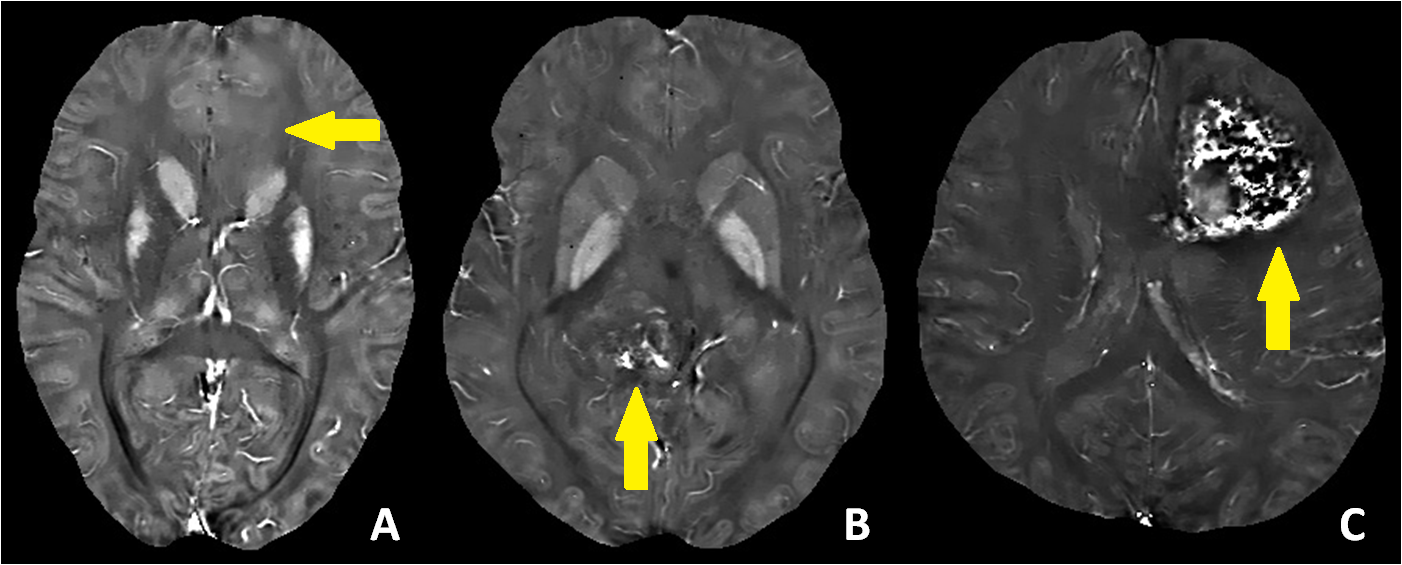
Fig.1 A, B
and C are Quantitative Susceptibility Mappings correspond to three cases with
astrocytoma grade II, III and IV. The locations of the lesions are shown with
the arrows. Hyperintense intratumoral susceptibility signal were found
increased with increasing tumor grade.
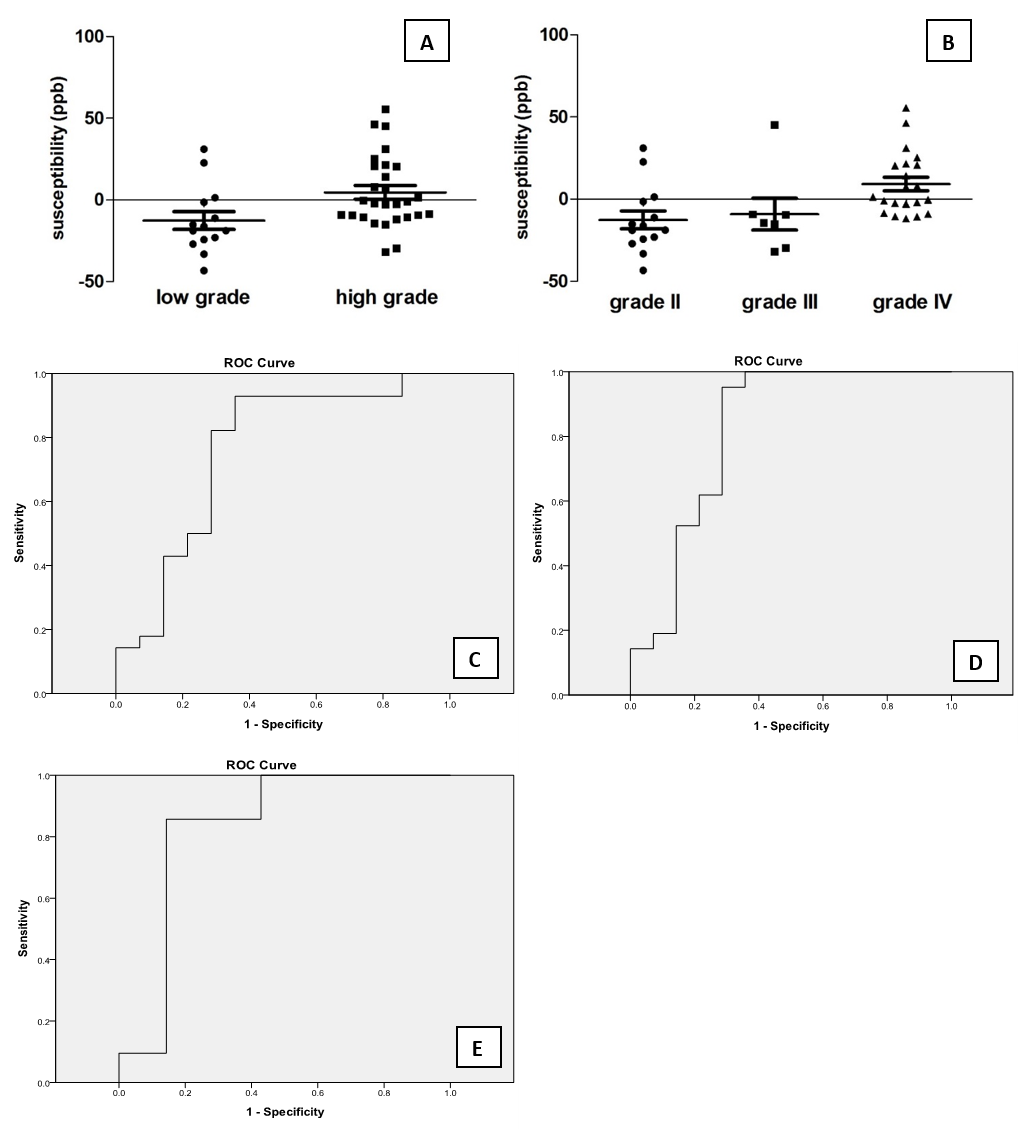
Fig.
2 A and B are the mean relative susceptibility values
of different grades astrocytomas for QSM. C, D and E are the ROC
curve for performance of mean relative susceptibility to distinguish different
grades of astrocytomas (low grade vs high grade, AUC=0.755, Sensitivity=0.929,
Specificity=0.643; grade II vs grade IV, AUC=0.816,
Sensitivity=0.952, Specificity=0.714; grade III vs grade IV, AUC=0.83,
Sensitivity=0.857, Specificity=0.857).
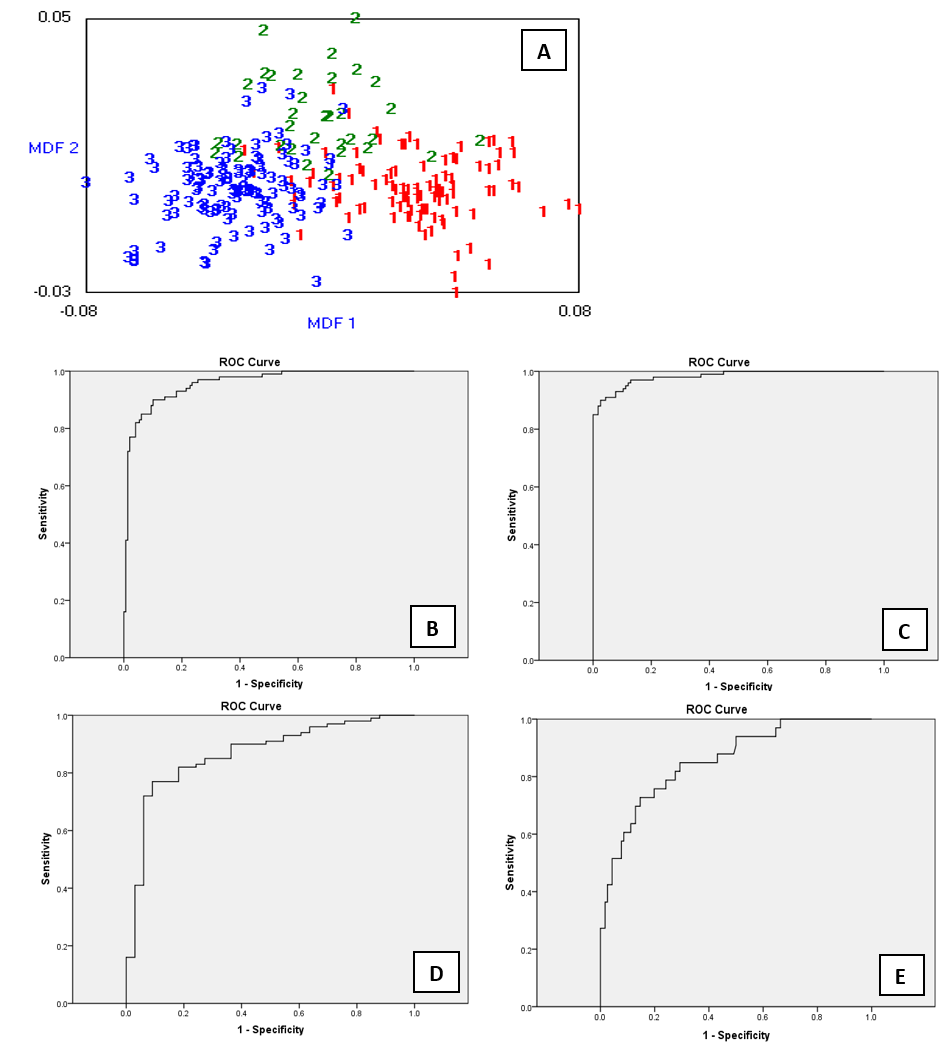
Fig.3 (A) Output from b11 for the LDA classification
MDF1 and MDF2 values for all 249 slices of the training set. MDF1 is the most discriminant factor and the values are shown for Grade II
(1red), III (2green) and IV (3blue). (B,
C, D, E) ROC curves for performance of MDF1 to distinguish different grades of
astrocytomas in training data set (low
grade vs high grade, AUC=0.957, Sensitivity=0.9, Specificity=0.899; grade
II vs grade IV, AUC=0.982, Sensitivity=0.91, Specificity=0.957; grade II vs
grade III, AUC=0.868, Sensitivity=0.77, Specificity=0.909; grade III vs grade
IV, AUC=0.856, Sensitivity=0.727, Specificity=0.853).
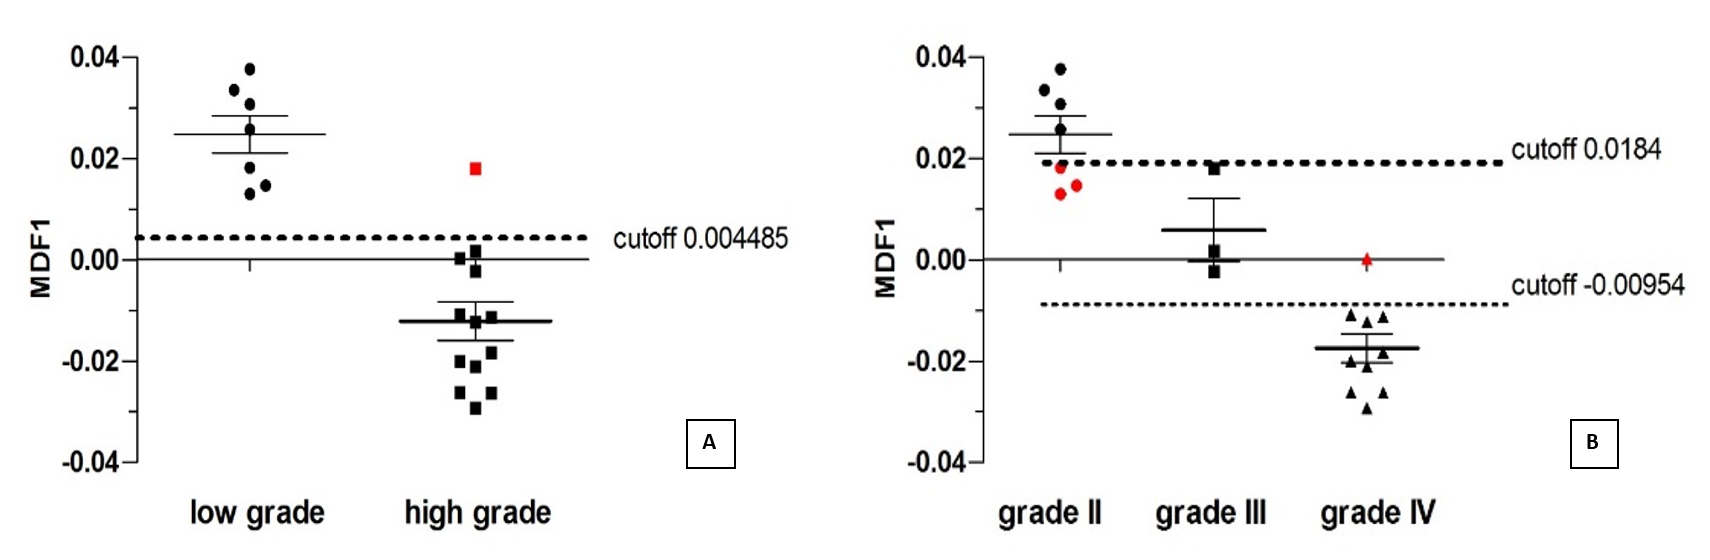
Fig. 4 (A) One of the 20 cases was misclassified using
the same training set cutoff value of 0.004485 for differentiation of low grade
and high grade astrocytomas. (B) Sixteen of 20 cases were classified correctly
using the same training set cutoff value of -0.00954 and 0.0184 for
differentiation of grade II, III and IV astrocytomas. The misclassified cases
were shown in red.