4251
Radiogenomic analysis of distinct tumor sub-compartments on T2 and FLAIR predict distinct molecular subtypes in Lower Grade Gliomas1Biomedical Engineering, Case Western Reserve University, Cleveland, OH, United States, 2Radiology, University Hospitals, Cleveland, OH, United States
Synopsis
The recent categorization of low-grade Glioma (LGG) has been modified based on the molecular aberrations associated with IDH mutations (IDHmut or IDH-WT) and 1p19q co-deletions (codel or non-codel). We explored the utility of radiogenomic analysis to identify radiomics signatures (computer extracted features from MRI) that distinguish IDHmut codel, IDHmut noncodel, and IDH-WT LGG tumors on T2 and FLAIR sequences. Initial results indicate that radiomic features from non-enhancing regions on T2 and infiltrative edges on FLAIR can segregate the 3 subgroups. A non-invasive means of discerning molecular subtypes on MRI may allow clinicians to determine prognosis, and inform treatment strategy.
Purpose:
The 2016 WHO classification of diffuse gliomas [1] was recently restructured based on mutations and chromosomal alterations that define three subtypes with distinct clinical outcomes: Isocitrate dehydrogenase (IDH) mutant &1p/19q co-deletion (IDHmut-codel); IDH mutant without 1p/19q co-deletion (IDHmut-noncodel); and those without IDH mutation (IDH-WT). Gliomas with a combination of 1p19q co-deletion and IDH mutation ((IDHmut-codel) are known to have a more favorable prognosis, as well positive response to chemotherapy and radiotherapy as compared to gliomas with IDH-WT [2]. Unfortunately, mutation status for IDH and 1p19q co-deletions are assayed on surgically resected specimens or biopsy samples. This requires invasive intervention, as well as being prone to sampling errors (as gene profiling is assayed only on a small portion of tissue). Additionally, genetic analysis is not a part of routine clinical work up in majority of hospitals & clinics. Pre-operative MRI is the routine standard-of-care for screening and treatment planning for Gliomas. In this work, we sought to explore the feasibility of directional gradients (Gabor) and local intensity statistics (Haralick, Laws) texture features obtained from different tumor-specific sub-compartments (enhancing, non-enhancing, infiltrating edges, and necrotic regions) on T2 and FLAIR sequences in capturing the molecular variations across IDHmut-codel, IDHmut-noncodel, and IDH-WT subtypes in patients with low grade gliomas (LGG).Methods
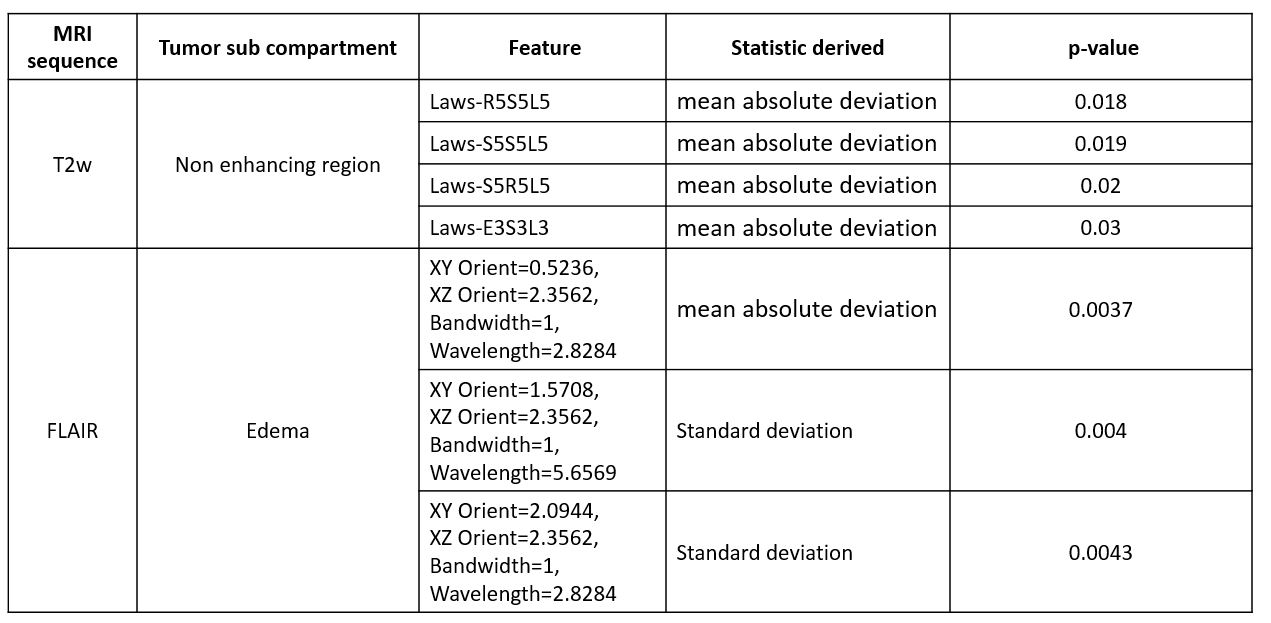
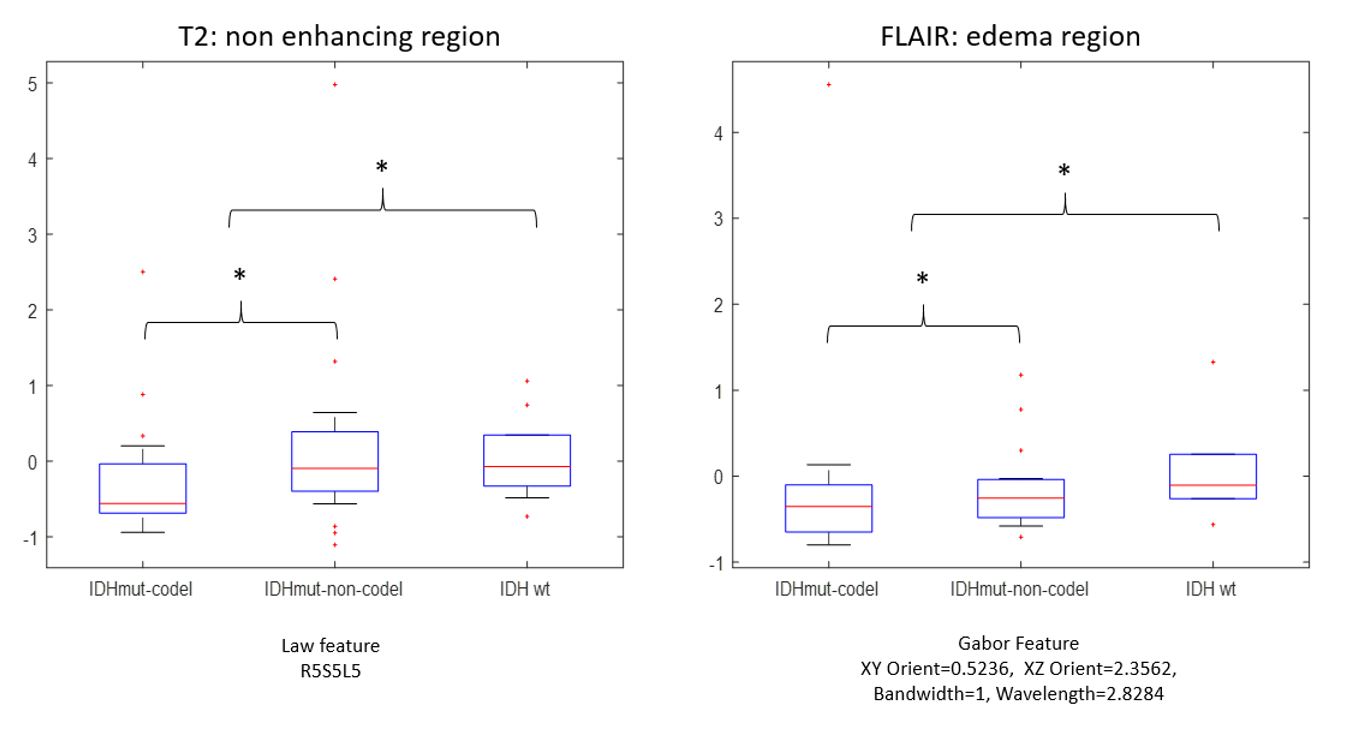
We performed retrospective analysis on 83 T1-weighted, 60 T2-weighted and 60 FLAIR pre-operative MRI sequences (including both 1.5T/3T scans) acquired from 83 patients diagnosed with LGG in the TCIA consortium [3]. Corresponding IDH mutation and 1p/19q co-deletion status was also obtained from TCGA database [4]. For preprocessing, T2w and FLAIR images of a subject were registered to its respective T1w image using nonlinear deformable (BSpline) registration [5]. The images were then normalized using histogram matching (bins=255, points=64) [5] to match the intensities of a normal T1w MNI (Montreal Neurological Institute) atlas. Then subject’s brain was skull-stripped by non-rigidly aligning T1w MNI atlas to each of the subject T1w images. Images were also corrected for intensity inhomogeneities induced by bias of the magnetic head coil using N4 bias-correction method [6]. The tumor-specific regions on each patient study were annotated by an experienced radiologist into four sub compartments: enhancing tumor, non-enhancing tumor, infiltrating edges & necrosis. A total of 313 3D radiomic voxel-wise features were extracted from each sub compartment. The features included Haralick (local gray level statistical occurrence), Gabor (multi-oriented, multi-scale filters), and Laws (multi-pattern filters) features. These features were quantified via descriptive statistics (skewness, kurtosis, mean/median absolute deviation) within the annotated region-of-interest (ROI). Nonparametric Wilcoxon rank-sum testing with false discovery rate (FDR) < 10% was calculated for each sub compartment to identify and rank radiomics features based on showing statistically significant differences first between IDHmut, and IDH-WT sub-groups, and then between IDHmut-1p/19q codel and IDHmut-noncodel sub-groups (p<0.03)Results and Discussion
The most statistically significantly radiomic features (p < 0.001, false discovery rate = 8%) across IDHmut-codel, IDHmut-noncodel & IDH-WT subgroups were found to be standard deviation measurements of Laws features that capture ripple, wave & spot appearances from the non-enhancing region on T2-w MRI sequences. We similarly identified consistent patterns of Gabor orientation features (wavelength = 2.82, XZ orientation = 2.3) from infiltrating edges on FLAIR sequence (edema) to be statistically significantly different across the 3 sub-groups (p<0.01, False Discovery Rate =3%). No significant differences were obtained from contrast-enhanced T1w MRI scans. IDH WT lower grade gliomas are known to be aggressive phenotypes & more likely to demonstrate an infiltrative pattern on T2w &FLAIR sequences compared to IDHmut (codel or noncodel). Quantitative measurements obtained from the radiomic features from specific tumor sub-compartments (including non-enhancing & infiltrative edges) may perhaps be capturing these morphological variations across the LGGs subtypes as reflected on different MRI sequences.Conclusion
Our results demonstrate feasibility of radiogenomic analysis to profile the three distinct molecular subtypes of MRI on pre-operative routine MRI scans. Prospective validation in larger cohort may provide prognostic implications for LGG patients. Non-invasive genotype profiling of LGGs could enable personalized therapy in LGG patients in accordance with the new WHO classification.Acknowledgements
Research reported in this publication was supported by Coulter Translational Award, National Cancer Institute of the National Institutes of Health under award numbers R01CA136535-01, R01CA140772-01 & R21CA167811-01; the National Institute of Biomedical Imaging and Bioengineering of the National Institutes of Health under award number R43EB015199-01; the National Science Foundation under award number IIP-1248316; the Clinical and Translational Science Collaborative (CTSC) Award UL1TR 000439, Ohio Third Frontier, NSF@Icorps, and the SOURCE Summer Research Program and Case Western Alumni Association. Content is solely the responsibility of authors and does not necessarily represent the official views of the NIHReferences
[1] The 2016 World Health Organization Classification of Tumors of the Central Nervous System: a summary. David N. Louis et al., Acta Neuropathological. June 2016
[2] Comprehensive, Integrative Genomic Analysis of Diffuse Lower-Grade Gliomas. The Cancer Genome Atlas Research Network. The New England Journal of Medicine, 2015.
[3] Clark K, Vendt B, Smith K, Freymann J, Kirby J, Koppel P, Moore S, Phillips S, Maffitt D, Pringle M, Tarbox L, Prior F. The Cancer Imaging Archive (TCIA): Maintaining and Operating a Public Information Repository, Journal of Digital Imaging, Volume 26, Number 6, December, 2013, pp 1045-1057.
[4] The Cancer Genome Atlas Pan-Cancer analysis project. The Cancer Genome Atlas Research Network, John N Weinstein, Eric A Collisson, Gordon B Mills, Kenna R Mills Shaw, Brad A Ozenberger, Kyle Ellrott, Ilya Shmulevich, Chris Sander & Joshua M Stuart
[5] Avants BB, Epstein CL, Grossman M, Gee JC. Symmetric diffeomorphic image registration with cross-correlation: Evaluating automated labeling of elderly and neurodegenerative brain. Med Image Anal. 2008 Feb;12(1):26–41.
[6] N4ITK: Improved N3 Bias Correction. Nicholas J. Tustison,corresponding author Brian B. Avants, Philip A. Cook, Yuanjie Zheng, Alexander Egan, Paul A. Yushkevich, and James C. Gee
Figures