4249
Texture analysis of quantitative ADC maps to differentiate low from high grade glioma1First Affiliated Hospital of Dalian Medical University, Dalian, People's Republic of China, 2GE Healthcare,Lifescience,China
Synopsis
The objective of this study, was to differentiate low from high grade glioma using texture analysis of quantitative ADC maps, and further aimed at revealing the microscopic changes of glioma in the evolution of low grade to high grade.Conclusion that texture analysis of ADC signal value based on entire tumor could provide more information in differentiation of low and high grade glioma. Through logistic regression analysis we obtain skewness, entropy,long run emphasis are the independent influence factors, and joint application of them showed superior diagnostic value.
Introduction
The therapeutic approaches and prognosis for gliomas differ considerably for different tumor grades, it is hence important to accurately assess glioma grade for treatment planning.Although a number of studies have focused on using ADC values to differentiate low from high grade glioma[1,2] ,no study has been conducted to examine the overall variations in ADC maps texture parameters of low and high grade glioma based on entire region of tumor. The objective of this study, therefore, was to differentiate low from high grade glioma using texture analysis of quantitative ADC maps, and further aimed at revealing the microscopic changes of glioma in the evolution of low grade to high grade.Method
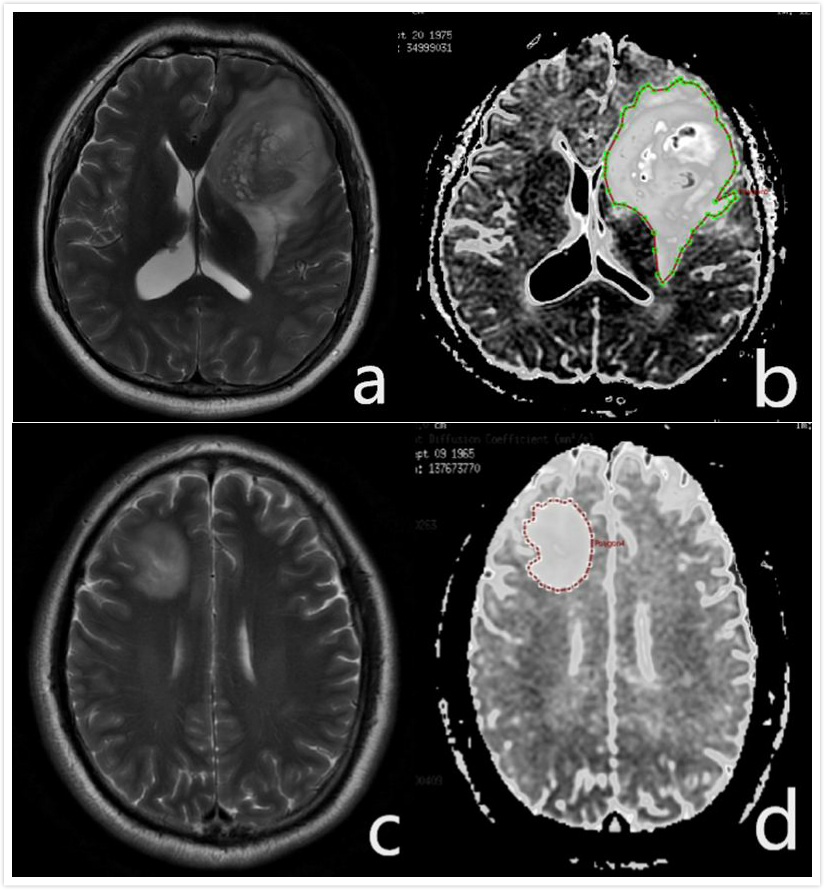
Fourteen patients with low grade glioma and 47 patients with high grade glioma were enrolled in this retrospective study in which tumor grades were pathologically confirmed. All the participants underwent DWI on a 3.0T whole body scanner. ROIs that contained entire tumor and peripheral edema were drawn in each slice of the ADC maps. Then texture voxel wise measurements of the entire tumor volume were obtained. Texture parameters including the following were recorded. 1. First-order and histogram parameters include min intensity, max intensity, mean value, median intensity, the 10th,25th,50th,75th and 90th percentiles,range, voxel number, std deviation,variance,relative deviation,mean deviation, skewness,kurtosis and uniformity. 2.Gray-level co-occurrence matrix parameters consist of energy,entropy,inertia,correlation,inverse difference moment. 3.Gray-level run length maxia parameters contains long run emphasis,short run emphasis ,grey-level nonuniformity,run length nonuniformity. The obtained parameters were compared between groups through the SPSS 18.0.Using logistic regression analysis the independent influence factors and joint variable were, receiver operating characteristic curve (ROC) was used to assess the ability of independent influence factors and joint variable between low and high grade glioma. All statistical results were P<0.05 as statistically significant.Results
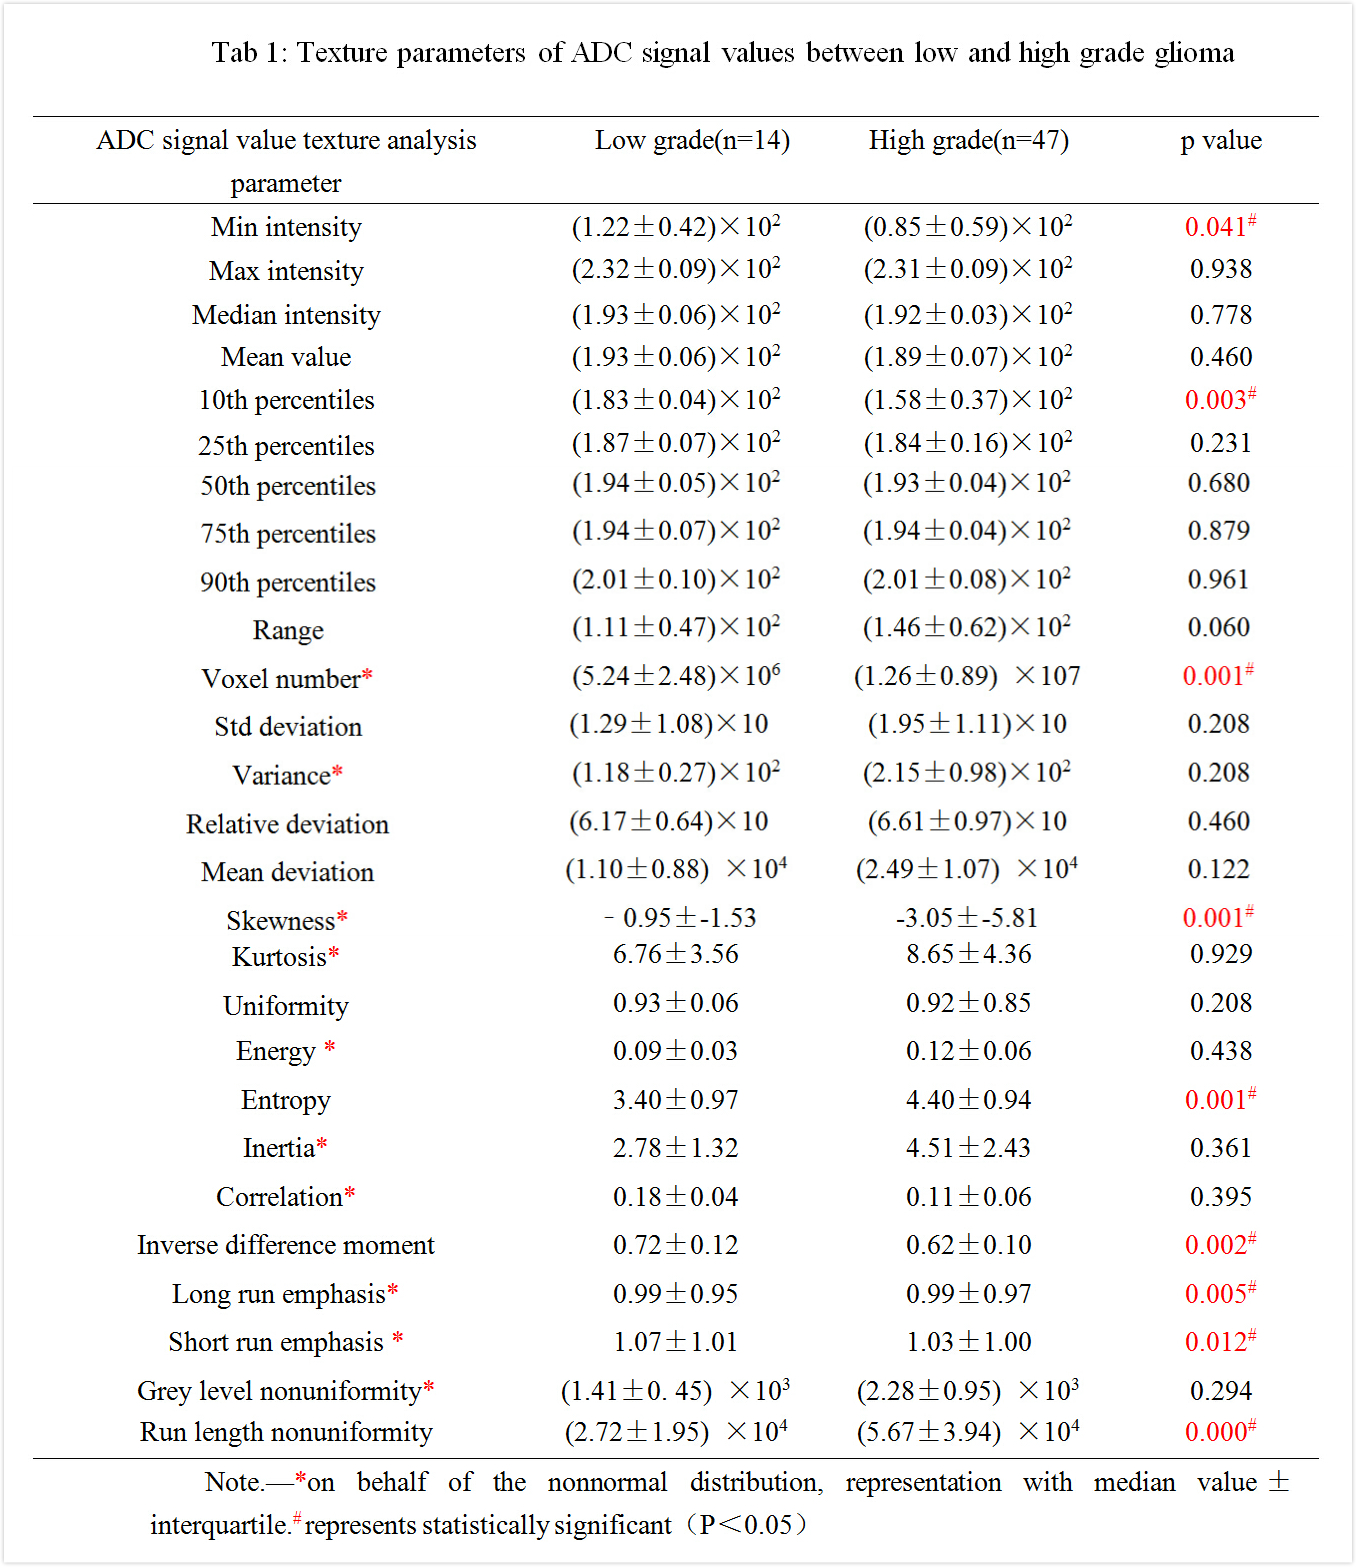
From Table 1,it can be seen that min intensity,max intensity,median intensity,mean value,the 10th,25th,50th, 75th,90th percentiles,skewness,uniformity,correlation,inverse difference moment,short run emphasis are decreased in high grade than low grade. On the contrary,range, voxel number,std deviation,variance,relative deviation,mean deviation, kurtosis,energy,entropy,inertia,long run emphasis,grey level nonuniformity,run length nonuniformity are just increased. Among all, min intensity(p=0.041), 10th percentiles(p=0.003), voxel number(p=0.0001),skewness(p=0.001), entropy(p=0.001),inverse difference moment(p=0.002),long run emphasis(p=0.005),short run emphasis(p=0.012),run length nonuniformity(p=0.000) showed significant difference between two groups.
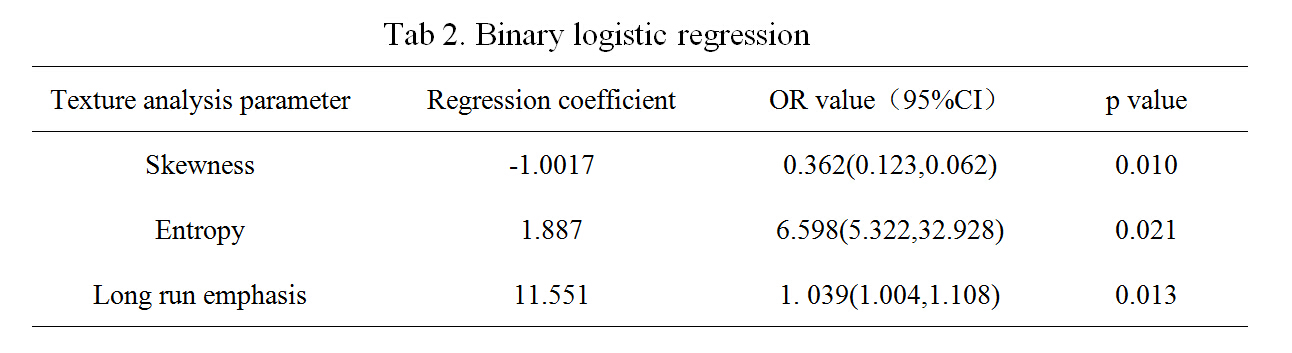
Entering all significant different texture parameters into logistic regression analysis, skewness, entropy and long run emphasis are taken as the independent influence factors using step-by-step regression method, and the precidition accuracy of logisitic regression model is 86.9%,as shown in Table 2.
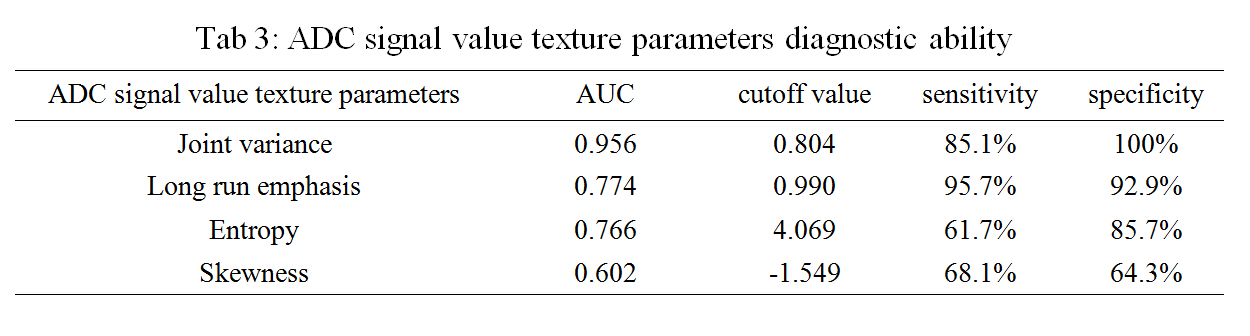
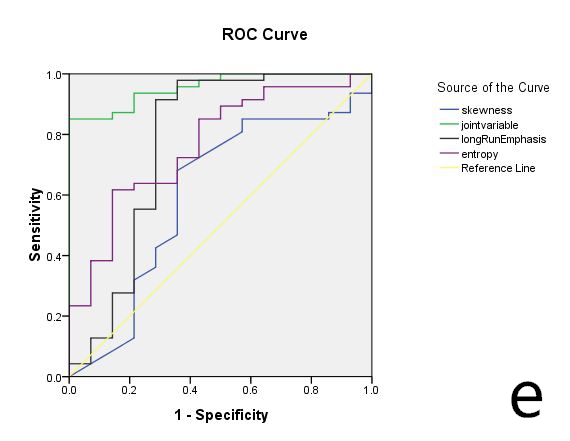
On combining all independent influence factors into a joint variable, the ROC showed there are significant abilities for skewness, entropy,long run emphasis and joint variable to differiate two groups. (Fig.e) The joint variable is the best parameter with cutoff value of 0.804 and AUC of 0.956(Table 3).
Discussion and conclusion
Texture analysis is a new image post-processing technique which reflect intrinsic properties including gray level statistical information,space and structure information,besides, and contain the contact with surrounding environment of a given voxel[3]. Different grade glioma has different signal on ADC maps due to tumor parenchyma or cystic,necrotic and hemorrhagic area ,resulting in different texture. In this study, min intensity and 10th percentiles showed significant difference between low and high grade glioma, suggesting that ADC value in low zone is more meaningful,in other words, the lower range of ADC better reflects the progress of higher cellularity. The difference of voxel number between two groups reflects the faster growth rate and more invasion range of high grade. Standard deviation shows the level of data dispersion,in fact, higher standard deviation of ADC indicates larger regions of cystic,necrosis or haemorrhage. Skewness describes the symmetry of the curve distribution. Compared with low grade, the ADC value of high grade concentrate on low zone, the center of the histogram curve was shifted to left. Entropy and inverse difference moment reflect gray level uniformity of image, which illustrate that high grade glioma is more nonuniformity than low grade. Run emphasis reflect direction,distance and variability of texton quantitative, the long run emphasis increase and short run emphasis decrease significantly in high grade glioma compare with low grade,illustrate that high grade contains more long run factors and less short run factors, low grade glioma contains less long run factors and more short run factors, run length nonuniformity of high grade glioma is higher too. Overall, it is seen that texture analysis of ADC signal value based on entire tumor could provide more information in differentiation of low and high grade glioma. Through logistic regression analysis we obtain skewness, entropy,long run emphasis are the independent influence factors, and joint application of them showed superior diagnostic value.Acknowledgements
No acknowledgement found.References
[1]Yusuhn Kang,Seung Hong Choi,Young-Jae Kim,et al.Gliomas:Histogram Analysis of Apparent Diffusion Coef?cient Maps with Standard- or High-b-Value Diffusion-weighted MR Imaging Correlation with Tumor Grade[J].Radiology,2011,261(3):883-884.
[2]Lelande S.Hu,Shu luo Ning,Jennifer VM,et al.Muliti-Parametric MRIand Texture Analysis to Visualize Spatial Histologic Heterogeneity and Tumor Extent in Glioblastoma[J].PLOS ONE,2015,DOI:10.1371:2-9.
[3]Bastidas-Rodriguez MX,Prieto-Ortiz FA,Espejo E.Fractographic classification in metallic materials by using computer vision[J].Eng Fail Anal,2016,59:237-252.
Figures