4248
Optimizing Statistical Texture Model to Improve the Classification Accuracy of Tumor Grade in Glioma Patients with Machine Learning Based on Multimodality MR Images1Tangdu Hospital, Fourth Military Medical University, Xi'an, People's Republic of China
Synopsis
Texture analysis is a powerful image analysis method to assess the heterogeneous distribution of tumor quantitatively. Different statistical models have been applied in texture analysis to classify glioma grade and level. It has not been evaluated that which model is the most efficient. The aim of this study is to compare four texture models in glioma grading. Texture features were extracted from multimodality MR images in 3D ROIs. After machine learning and leave-one-out cross validation, the gray-level run-length matrix was found as the best model while gray-level was set as 256.
INTRODUCTION
Glioma the most common primary malignant brain tumor and leads to more years of life lost than other tumors.1 High grade glioma (HGG, WHO grade III and IV) and low grade glioma (LGG, WHO grade I and II) have different treatment method and life expectancy.2-4 However, histopathology, which is the gold standard for differentiating glioma nowadays, has sample error and falls behind the timeline for treatment design due to tumor heterogeneity.5 Thus, it is critically important to make a correct classification of the grade and level of glioma preoperatively.
Texture analysis is a powerful image analysis method to assess the heterogeneous distribution quantitatively. Different statistical models have been applied in texture analysis so far.6-8 However, as far as we know, it has not been evaluated that which model is the most efficient to classify the level and grade of glioma preoperatively. In this study, our overarching goal is to compare the frequently used texture models and to find the best one for glioma classification.
METHOD
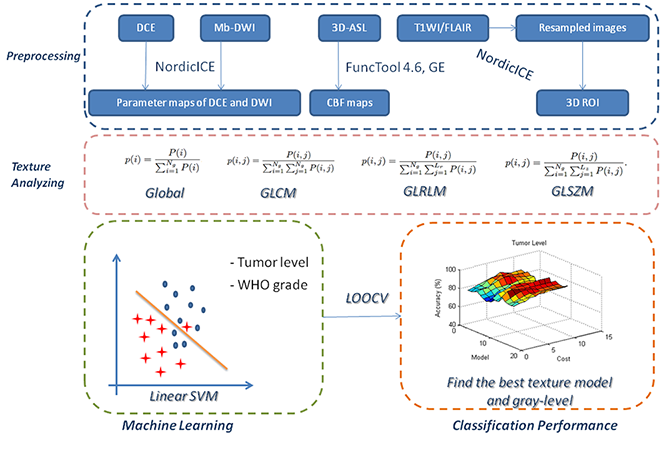
Thirty parametric maps were generated from multimodality images (DCE, 3D-ASL and DWI). ROI segmentation was done according to structural images. As for texture analysis, four statistical texture models including first-order global texture model, gray-level co-occurrence matrix (GLCM), gray-level run-length matrix (GLRLM) and gray-level size-zone matrix (GLSZM) were applied. Gray-level was set as 32, 64, 128, and 256, respectively. After extracting texture contributes within the ROI from all the parametric maps by applying different texture models and gray-levels, machine learning approach and leave-one-out cross validation (LOOCV) were employed to classify tumor level and grade at individual level. Finally, the texture model and gray-level which had a best classification performance can be found. The overall flow chart is shown in Fig.1.RESULT
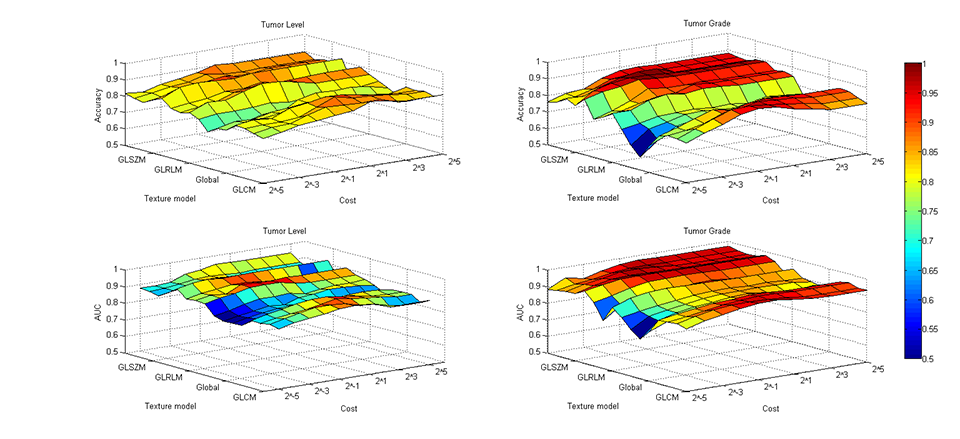
The results of two-way ANOVA showed the significant effect of texture model and gray-level on the classification performance of tumor grade (P < 0.001). Two-by-two comparison of the gray level groups with a post hoc Tukey test showed no significant differences. The comparison of texture model groups showed significant differences between GLCM and global groups (P < 0.001), GLSZM and global groups (P < 0.001), and GLRLM and global groups (P < 0.001). A relatively weak significant difference could be found between GLCM and GLSZM (P<0.05). As for level classification, the two-by-two comparison showed the almost same results as grade classification. The weak significant difference was found between GLCM and GLRLM. In a conclusion, the first-order global texture model had the worst performance. Fig.2 shows the overall classification accuracy and AUC.
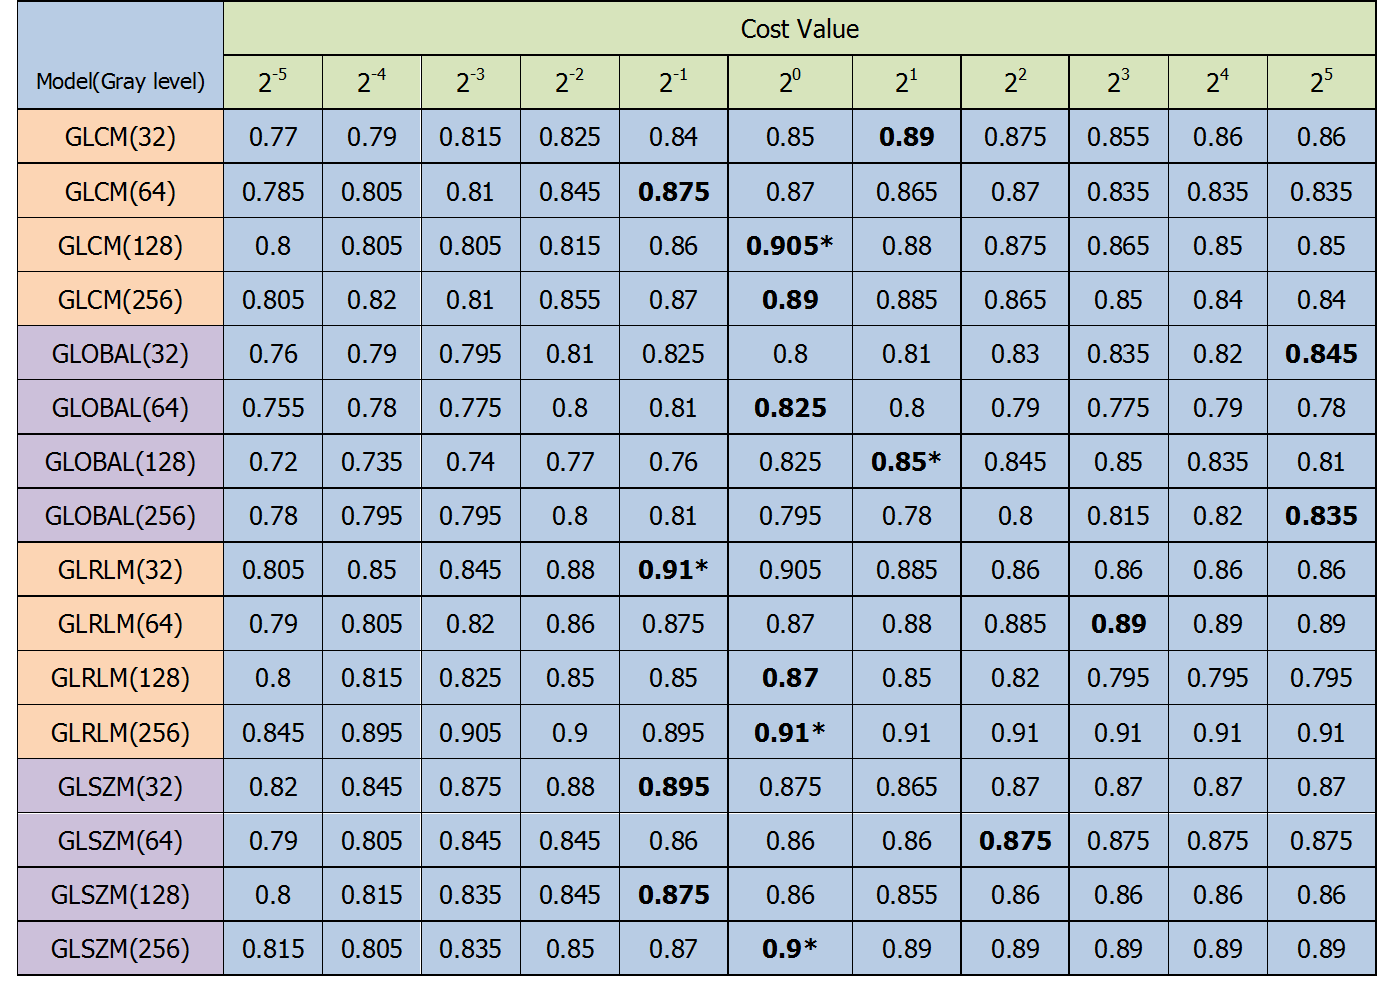
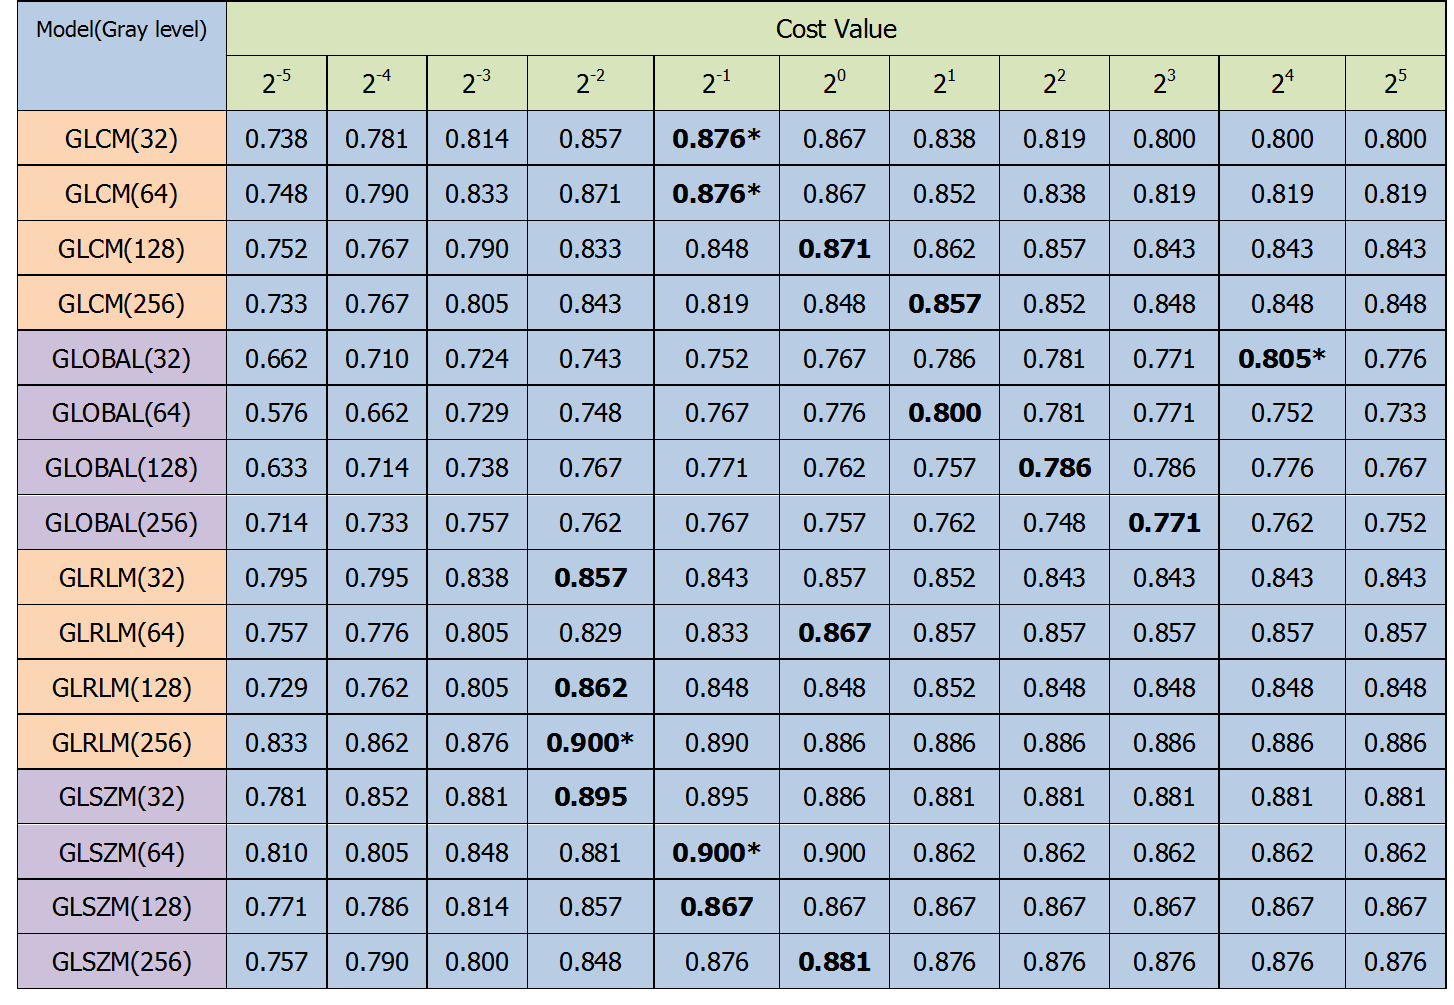
For tumor level classification, GLRLM showed the highest accuracy (0.91) at gray-level 256. (Fig.3 in detail) For glioma grading, GLRLM and GLSZM showed the same highest accuracy (0.90) at gray-level 256 and 64, separately. (Fig.4 in detail) Thus, for the comparison between four texture models, GLRLM with 256 gray-level performed best both in level and grade classification while the cost value in SVM was set around 1.
DISCUSSION AND CONCLUSION
The primary purpose for this study is to find the best texture model for gliomas classification. As far as we know, this is the first study which compares the commonly used texture models. By using support vector machine and leave-one-out cross validation, the classification performance at individual level can be get. After comparing the classification accuracy, we found that GLRLM model has manifests best. It provides an evidence for further study.
Although the results have relatively satisfactory classification accuracy, there are some limitations about the experimental data. Firstly, the choosing of MRI sequences is subjective. A comparable test needs to be done. Maybe other combination performs better. Secondly, we only chose four commonly used texture models from plenty models, which could lead to relative partial results. Thirdly, the testing data involved in this study is from one center. Further study should gather data from multi-center and multi-type device to further examine the results.
Acknowledgements
No acknowledgement found.References
1. Schwartzbaum JA, Fisher JL, Aldape KD, Wrensch M: Epidemiology and molecular pathology of glioma. Nat Clin Pract Neurol 2006, 2(9):494-503; quiz 491 p following 516.
2. Gerard CS, Straus D, Byrne RW: Surgical management of low-grade gliomas. Semin Oncol 2014, 41(4):458-467.
3. Helseth R, Helseth E, Johannesen TB, Langberg CW, Lote K, Ronning P, Scheie D, Vik A, Meling TR: Overall survival, prognostic factors, and repeated surgery in a consecutive series of 516 patients with glioblastoma multiforme. Acta neurologica Scandinavica 2010, 122(3):159-167.
4. Khasraw M, Lassman AB: Advances in the treatment of malignant gliomas. Current oncology reports 2010, 12(1):26-33.
5. Hoshide R, Jandial R: 2016 World Health Organization Classification of Central Nervous System Tumors: An Era of Molecular Biology. World neurosurgery 2016, 94:561-562.
6. Lee HS, Oh JS, Park YS, Jang SJ, Choi IS, Ryu JS: Differentiating the grades of thymic epithelial tumor malignancy using textural features of intratumoral heterogeneity via (18)F-FDG PET/CT. Annals of nuclear medicine 2016, 30(4):309-319.
7. Molina D, Perez-Beteta J, Martinez-Gonzalez A, Martino J, Velasquez C, Arana E, Perez-Garcia VM: Influence of gray level and space discretization on brain tumor heterogeneity measures obtained from magnetic resonance images. Computers in biology and medicine 2016, 78:49-57.
8. Davnall F, Yip CS, Ljungqvist G, Selmi M, Ng F, Sanghera B, Ganeshan B, Miles KA, Cook GJ, Goh V: Assessment of tumor heterogeneity: an emerging imaging tool for clinical practice? Insights into imaging 2012, 3(6):573-589.
Figures