4245
High resolution 7 T magnetic resonance spectroscopic imaging of glioma in the brainGilbert Hangel1, Eva Heckova1, Bernhard Strasser1, Michal Považan1,2, Stephan Gruber1, Elisabeth Springer1, Georg Widhalm3, Matthias Preusser4, Siegfried Trattnig1,2, and Wolfgang Bogner1,2
1High Field MR Centre, Medical University of Vienna, Vienna, Austria, 2Christian Doppler Laboratory for Clinical Molecular MR Imaging, Vienna, Austria, 3Department of Neurosurgery, Medical University of Vienna, 4Department of Medicine I, Division of Oncology, Medical University of Vienna
Synopsis
We present the application of single-slice high-resolution FID-MRSI with short acquisition delay at 7T that provides whole-slice metabolite maps in eight patients with different types of glioma. With six minutes measurement time, it could be easily integrated into a standard imaging protocol. The results show that it is possible to resolve metabolic deviations in an extended number of biochemical compounds in tumors with unprecedented spatial details, thereby offering deeper insight into the neurochemical profiles of different glioma types. This suggests that the demonstrated method has a high potential for the research of glioma.
Purpose
In the recent years, MRSI sequences using free induction decay (FID-)acquisition1,2 were shown to allow fast and high-resolution MRSI of the brain at 7 T. This approach offers a better point-spread function, better local B0-homogeneity and reduced partial volume effects, allows short TRs as well as the possibility to acquire the whole slice and not just a selection box. So far, the application of 7T MRSI to the study of brain glioma has been limited3,4,5. In this work, we want to demonstrate the benefits of FID-MRSI at 7 T for the characterization of glioma and discuss the findings observed in the metabolic maps of eight tumour patients.Methods
Eight glioma patients (5 male, 3 female, 43±5 years) were measured on a Siemens 7 T Magnetom scanner using a 32-channel head coil. Written informed consent and institutional review board approval were obtained. The glioma were histologically specified to be two WHO grade II oligodendroglioma (ODG) with IDH1 mutation, one WHO grade II-III ODG with IDH1, one WHO grade II ODG without IDH1, one WHO grade III ODG without IDH1, one WHO grade II diffuse astrocytoma (DAC) with IDH1, one resected WHO grade III ODG with suspicion of recurrence, and one WHO grade III oligoastrocytoma (OAC) with recurrence. The measurement protocol consisted of anatomical imaging with MPRAGE (8 min) and SWI (10 min, TE 15 ms) and the acquisition of a B1+ map prior to MRSI. The single slice FID-MRSI sequence had an acquisition delay of 1.3ms and a TR of 600ms, an elliptically weighted 64×64 matrix with an FOV of 220×220×8mm³ and used CAIPIRINHA2 with an effective acceleration factor of 5 resulting in a measurement time of 6 min. It further used 1024 readout points with 6000 Hz readout bandwidth, a delta frequency of -2.1 ppm, and WET water suppression. GRE prescans used for MUSICAL6 coil combination and parallel imaging reconstruction were directly integrated into the MRSI sequence. Data processing utilised a MATLAB-based in-house routine7 including a spatial Hamming filter and lipid signal removal by L2-regularisation8. No apodisation or zero filling was applied. The spectra were fitted using LCModel in the range of 1.8 to 4.2 ppm. The spectra were further evaluated for SNR, FWHM and CRLBs for NAA. SNR values were calculated via an adapted pseudo-replica method. The resulting metabolite and metabolite ratio maps were interpolated to double resolution.Results
With average NAA SNR>20 in all patients, reliable spectral quantification could be achieved. The major metabolites (tNAA, tCho, tCr, Glu, Ins) could be well quantified in all cases, while measures of macromolecules, taurine and glutamine were less reliable. Fig. 1-5 show examples of the metabolite alterations that were found. In all patients, tNAA was reduced in glioma. tCho was increased in all ODGs, but not in the DAC, while in the resected ODG and the OAC, an area of reduced tCho was surrounded by one with increased tCho (Fig. 5). tCr was reduced in all glioma except one of the grade II ODGs with IDH1 mutation, where it remained unchanged and the grade II ODGs without IDH1, where it was increased. Glu decreased in all glioma except an increased region in the grade III ODG with suspicion of recurrence (Fig. 5). Gln increased in the grade II ODGs with IDH1, the resected ODG, and the OAC, while in the grade III ODG, there was only a partial increase and a reduction in the rest of the glioma (Fig. 2). An increase of Ins could be found in all glioma but the grade III ODG (Fig.2), the resected ODG, and the OAC (fig. 5). Reduced MM signal appeared in the grade II-III ODG with IDH1 (Fig. 1), the resected ODG, and the OAC (Fig. 5) while it was increased in one of the grade II ODGs with IDH1 (Fig. 4). A decrease in Tau was found in one of the grade II ODGs with IDH1 (Fig. 4).Discussion
This study has successfully shown the application of fast full-slice high-resolution FID-MRSI at 7 T to different types of glioma. Our findings are in agreement with previous studies5. Our current method was limited to the regions above the ventricles, which could be remedied by improved B0-shimming/correction. More patients with different types of glioma and in comparison with established methods are needed to judge the diagnostic benefits of this sequence, which has the potential to be a powerful tool for neurological studies in general. Adapting this sequence to 3 T will allow a more widespread use, but would reduce the amount of quantifiable metabolites.Acknowledgements
This study was supported by the Austrian Science Fund (FWF): KLI-61 and the FFG Bridge Early Stage Grant #846505.References
[1] Bogner et al., NMR Biomed 2012; 25(6):873-82[2] Strasser et al., MRM 2016, doi: 10.1002/mrm.26386
[3] Hangel et al., ISMRM 23 (2015):0766
[4] Chadzynski et al., ISMRM 23 (2015): 0763
[5] Li et al., JMRI 2015; 41(5):1332-41
[6] Strasser et al.; NMR in Biomed 2013; 26(12): 1796-805
[7] Považan et al., Proc. Intl. Soc. MRM 23 (2015): 1973
[8] Bilgic et al., JMRI 2014; 40(1):181-191
Figures
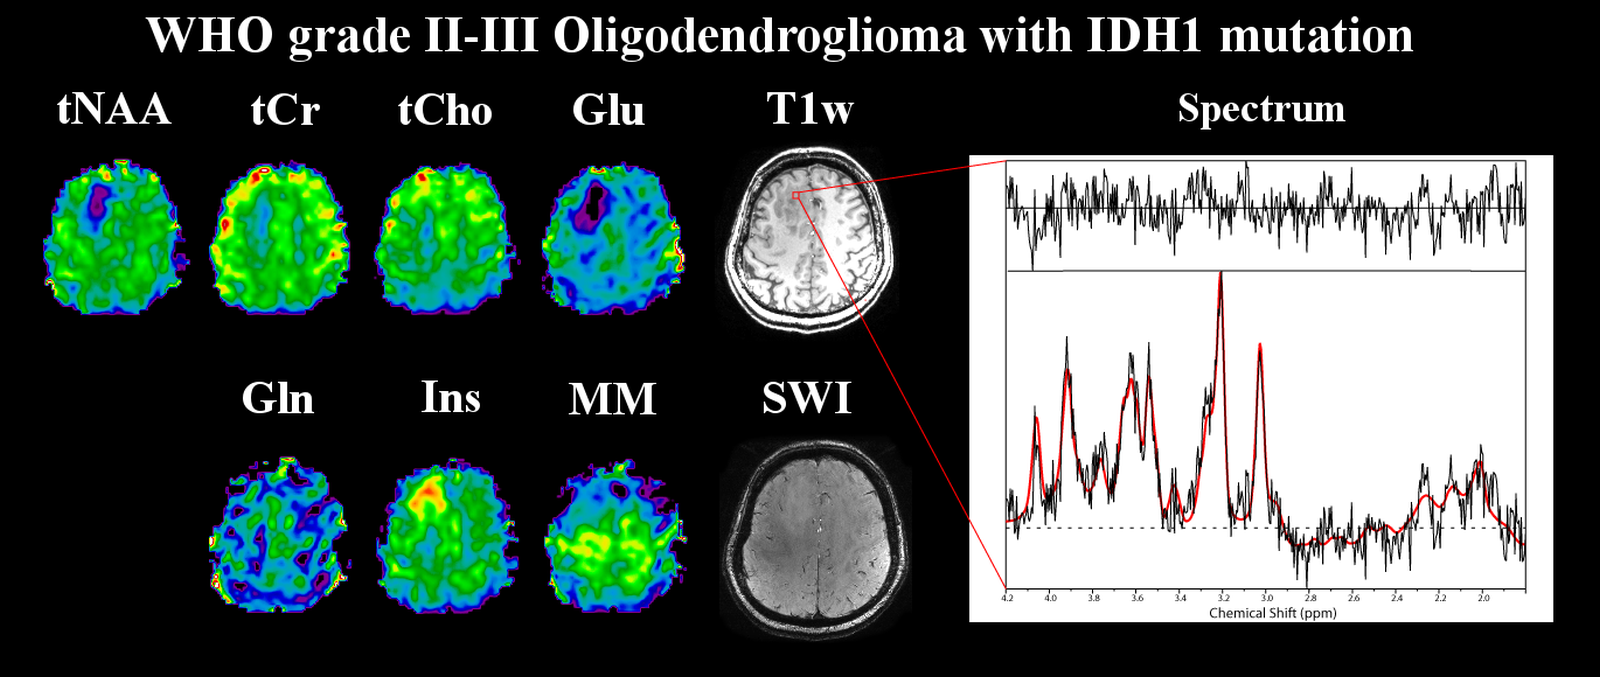
Figure 1: Metabolite maps of a WHO grade II-III
oligodendroglioma with IDH1 mutation, as well as an exemplary spectrum from
inside the tumour. Shown are tNAA (N-acetyl-aspartate
+ N-acetyl-aspartyl glutamate), tCr (creatine + phosphocreatine), tCho (choline-containing
compounds), Glu (glutamate), Gln (glutamine), Ins (inositol), MM (macromolecule)
maps as well as a T1-weighted and an SWI (susceptibility-weighted
imaging) images. Most pronounced are the increase of Ins and the drop of tNAA
and Glu in the glioma.
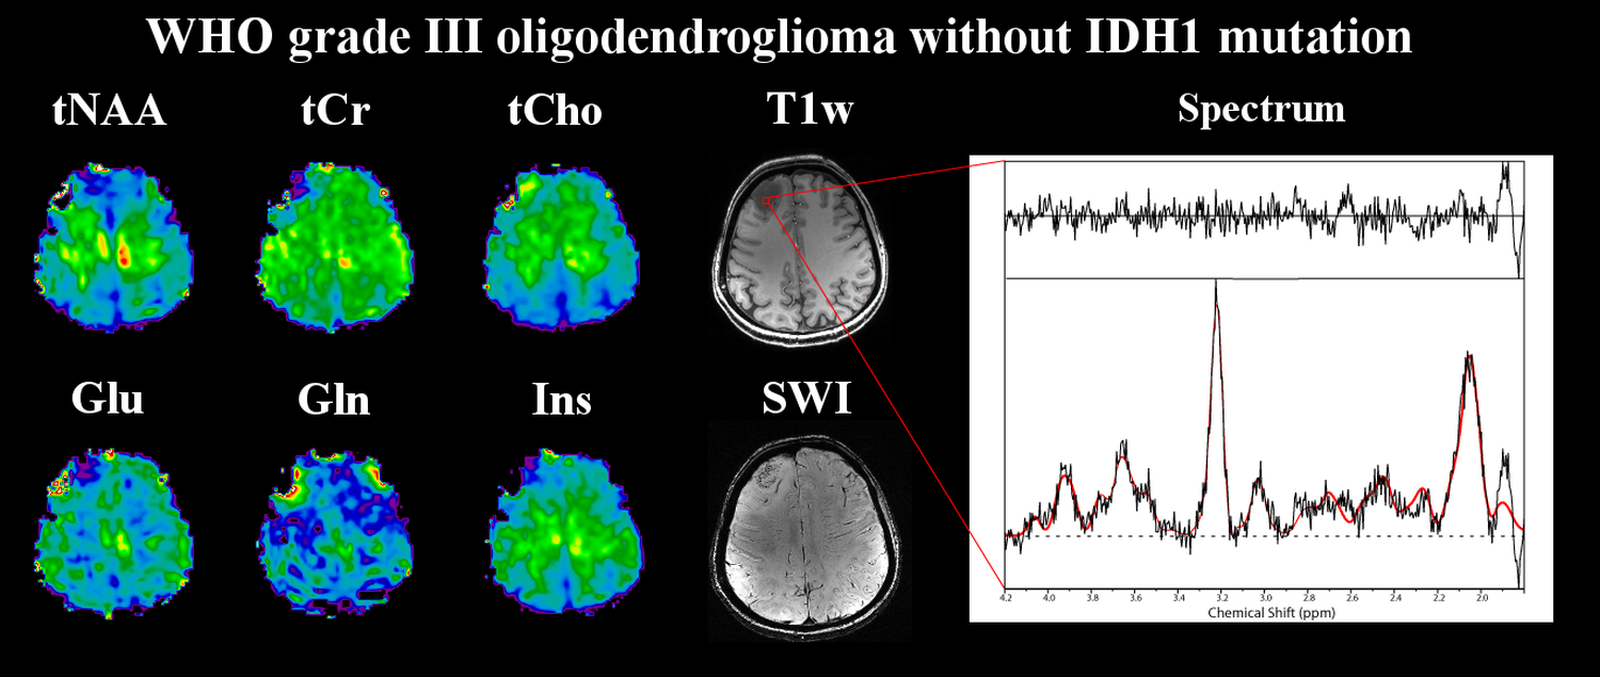
Figure 2: Metabolite maps of a WHO grade III
oligodendroglioma without IDH1 mutation, as well as an exemplary spectrum from
inside the tumour. Shown are tNAA (N-acetyl-aspartate
+ N-acetyl-aspartyl glutamate), tCr (creatine + phosphocreatine), tCho
(choline-containing compounds), Glu (glutamate), Gln (glutamine), Ins
(inositol) maps as well as a T1-weighted and an SWI
(susceptibility-weighted imaging) images. Notable changes are drops in tNAA,
tCr, Glu and Ins, an increase of tCho and regions of both for Gln.
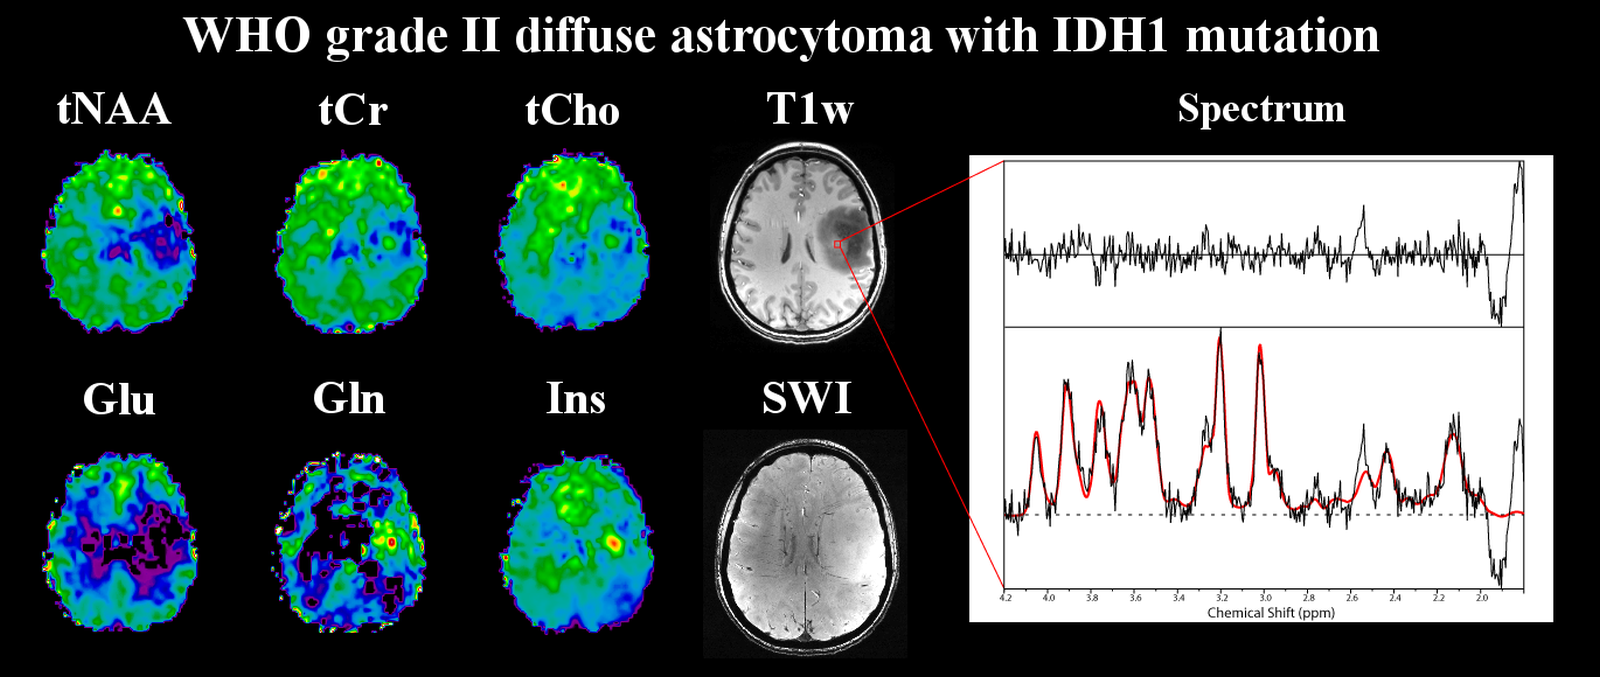
Figure 3: Metabolite maps of a WHO grade II diffuse
astrocytoma with IDH1 mutation, as well as an exemplary spectrum from inside
the tumour. Shown are tNAA (N-acetyl-aspartate
+ N-acetyl-aspartyl glutamate), tCr (creatine + phosphocreatine), tCho
(choline-containing compounds), Glu (glutamate), Gln (glutamine), Ins
(inositol) maps as well as a T1-weighted and an SWI
(susceptibility-weighted imaging) images. The hyper-intense region of the
glioma on the T1-weighted image correlates well with hotspot on the metabolite
maps, such as Ins and Gln.
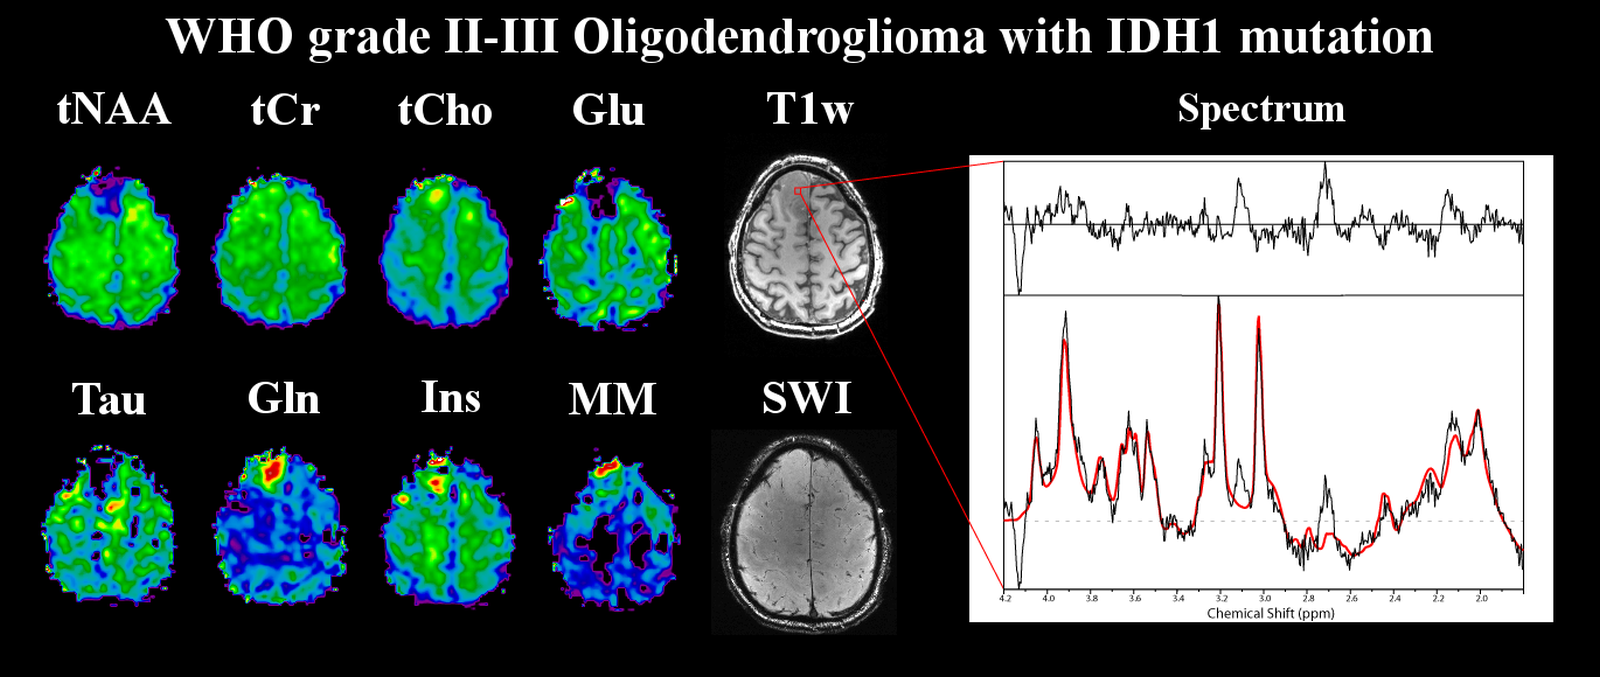
Figure 4: Metabolite maps of a WHO grade II
oligodendroglioma with IDH1 mutation, as well as an exemplary spectrum from
inside the tumour. Shown are tNAA (N-acetyl-aspartate
+ N-acetyl-aspartyl glutamate), tCr (creatine + phosphocreatine), tCho
(choline-containing compounds), Glu (glutamate), Gln (glutamine), Ins
(inositol), MM (macromolecule), Tau (taurine) maps as well as a T1-weighted
and an SWI (susceptibility-weighted imaging) images. Increases of tCho, Gln,
Ins and MM are notable while tNAA, Glu and Tau are substantially decreased.
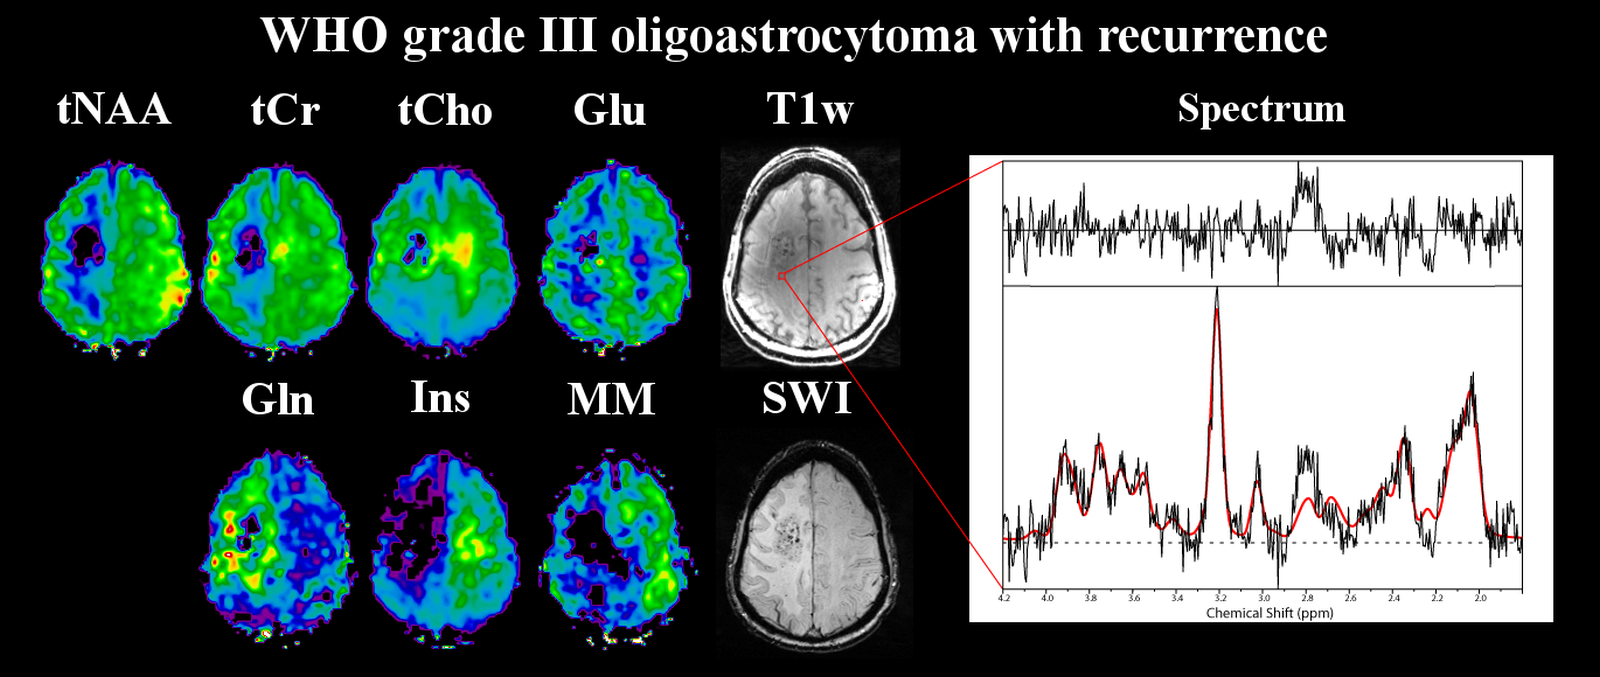
Figure 5: Metabolite maps of a WHO grade III
oligoastrocytoma with recurrence, as well as an exemplary spectrum from inside
the tumour. Shown are tNAA (N-acetyl-aspartate
+ N-acetyl-aspartyl glutamate), tCr (creatine + phosphocreatine), tCho
(choline-containing compounds), Glu (glutamate), Gln (glutamine), Ins
(inositol) maps as well as a T1-weighted and an SWI
(susceptibility-weighted imaging) images. Here, a region with decreases for all
metabolites is surrounded by increased tCho and Gln concentrations.