4244
Differentiation of Radiation Necrosis from Tumour Progression Using Chemical Exchange Saturation Transfer (CEST)1Radiology and Biomedical Imaging, University of California, San Francisco, San Francisco, CA, United States, 2Physical Sciences, Sunnybrook Research Institute, Toronto, ON, Canada, 3Radiation Oncology, Sunnybrook Research Institute, Toronto, ON, Canada
Synopsis
Radiation necrosis is the most common side-effect of stereotactic radiosurgery (SRS) and has similar characteristics to tumor progression on standard anatomical MRI. Differentiating these two conditions is a major long standing clinical challenge. In this study the potential of chemical exchange saturation transfer (CEST) in differentiating the two conditions in patient with brain metastases is investigated. The results showed that the magnetization transfer ratio (MTR) of amide and NOE peaks provided the best separation of radiation necrosis cases from tumor progression cases. However, the commonly used amide proton transfer (APT) was unable to differentiate the two conditions.
Introduction
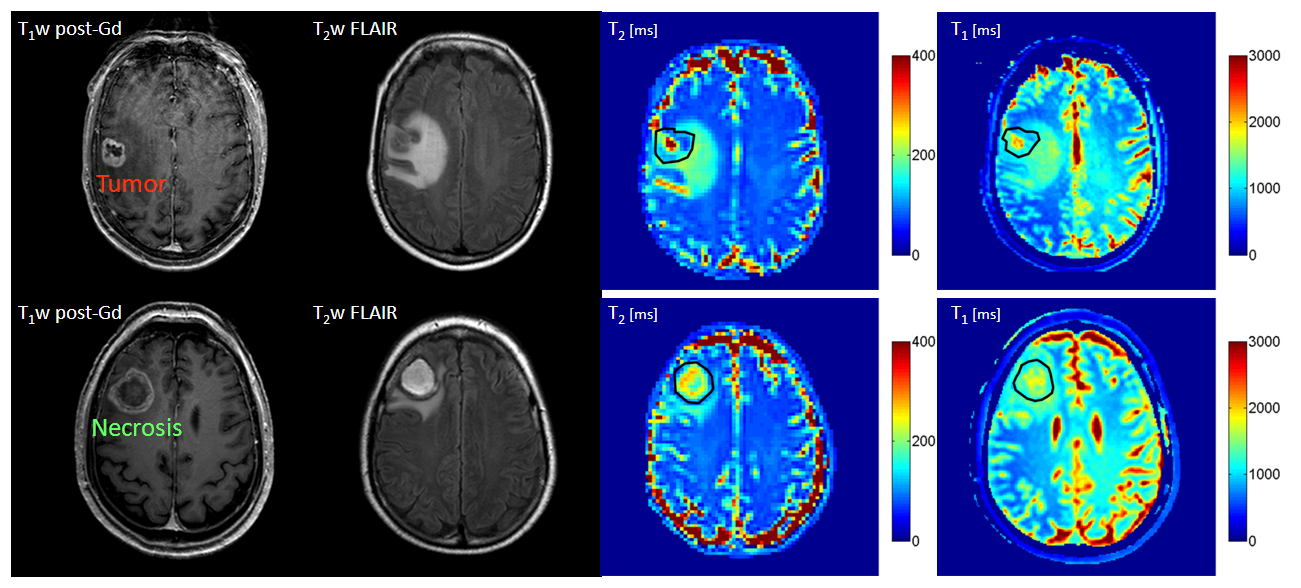
Brain metastases occur in 20-40% of all cancer patients and impact their quality of life and survival1. Stereotactic radiosurgery (SRS) is the preferred treatment option for these patients and is associated with a survival benefit for patients with limited number of metastases2. However, the high radiation dose in SRS (18-20Gy) increases the likelihood of developing necrosis in treated regions. It is often impossible to differentiate these radiation-induced changes from tumor progression using conventional MRI3. Both radiation necrosis and tumor progression present with an enlarging enhancing mass on post-Gd T1-weighted MRI and increased vasogenic edema in T2-weighted FLAIR4. Chemical exchange saturation transfer (CEST) which probes the concentration and exchange of mobile proteins and peptides is a promising candidate to differentiate these two conditions5-7. The objective of this study is assessing the potential of CEST in performing such differentiation and guiding therapy.Materials and Methods
CEST Metrics: The following metrics were evaluated:
1. CEST spectrum was decomposed into a constant MT effect and four lorentzian line-shapes corresponding to Amide (3.5ppm), Nuclear overhauser effect, NOE (-3.5ppm), Amine (2ppm) and bulk water (0ppm) as follows:
$$S(\Delta) = 1-(MT+\sum_{i=1}^4\frac{A_{i}}{1+(\frac{\Delta-\Delta_{0i}}{0.5\omega_{i}})^{2}})$$
area under the curve (AUC) of CEST peaks corresponding to NOE and Amide peaks (AmideAUC & NOEAUC) were then calculated.
2. The conventional Amide Proton Transfer (APT):$$APT = \frac{S(-3.5ppm)-S(3.5ppm)}{S(ref)}$$
3. Amide magnetization transfer ratio (AmideMTR):$$Amide_{MTR} = \frac{S(ref)-S(3.5ppm)}{S(ref)}$$
4. NOE magnetization transfer ratio (NOEMTR):$$NOE_{MTR} = \frac{S(ref)-S(-3.5ppm)}{S(ref)}$$
5. Direct effect defined as:$$Direct Effect = \sqrt{\frac{T_{1}}{T_{2}}}$$
which is proportional to full width at half maximum of water peak.
Patients: Eleven patients were recruited under REB approved protocols. All patients had been treated with SRS and had developed an enlarging enhancing lesion (suspected of necrosis or progression) . Six lesions were resected after CEST and histopathological assessment was performed. The remaining five lesions were monitored over time and the diagnosis of radiation necrosis or tumor was rendered clinically (Figure 1 shows representative images of each condition).
CEST: Imaging was performed on a 3T Philips Achieva scanner (with 8-channel SENSE head coil). An axial slice passing through the lesion was imaged with single-shot EPI (TR/TE=1971/29ms, Matrix=80x80. FOV=20x20cm, slice thickness=3mm). CEST spectrum included offset frequencies between -5.9ppm and 5.9ppm with 0.2ppm increments and reference images at ~1500ppm. RF saturation involved 4 block-shaped pulses of 242.5ms (970ms total), B1=0.52µT. The CEST sequence was repeated 4 times (total duration 8.75min). B0 correction was performed by fitting a Lorentzian line-shape to the spectrum and shifting minimum to 0Hz. Drift correction was performed using the reference images at both ends of the spectrum (assuming linear drift).
Results
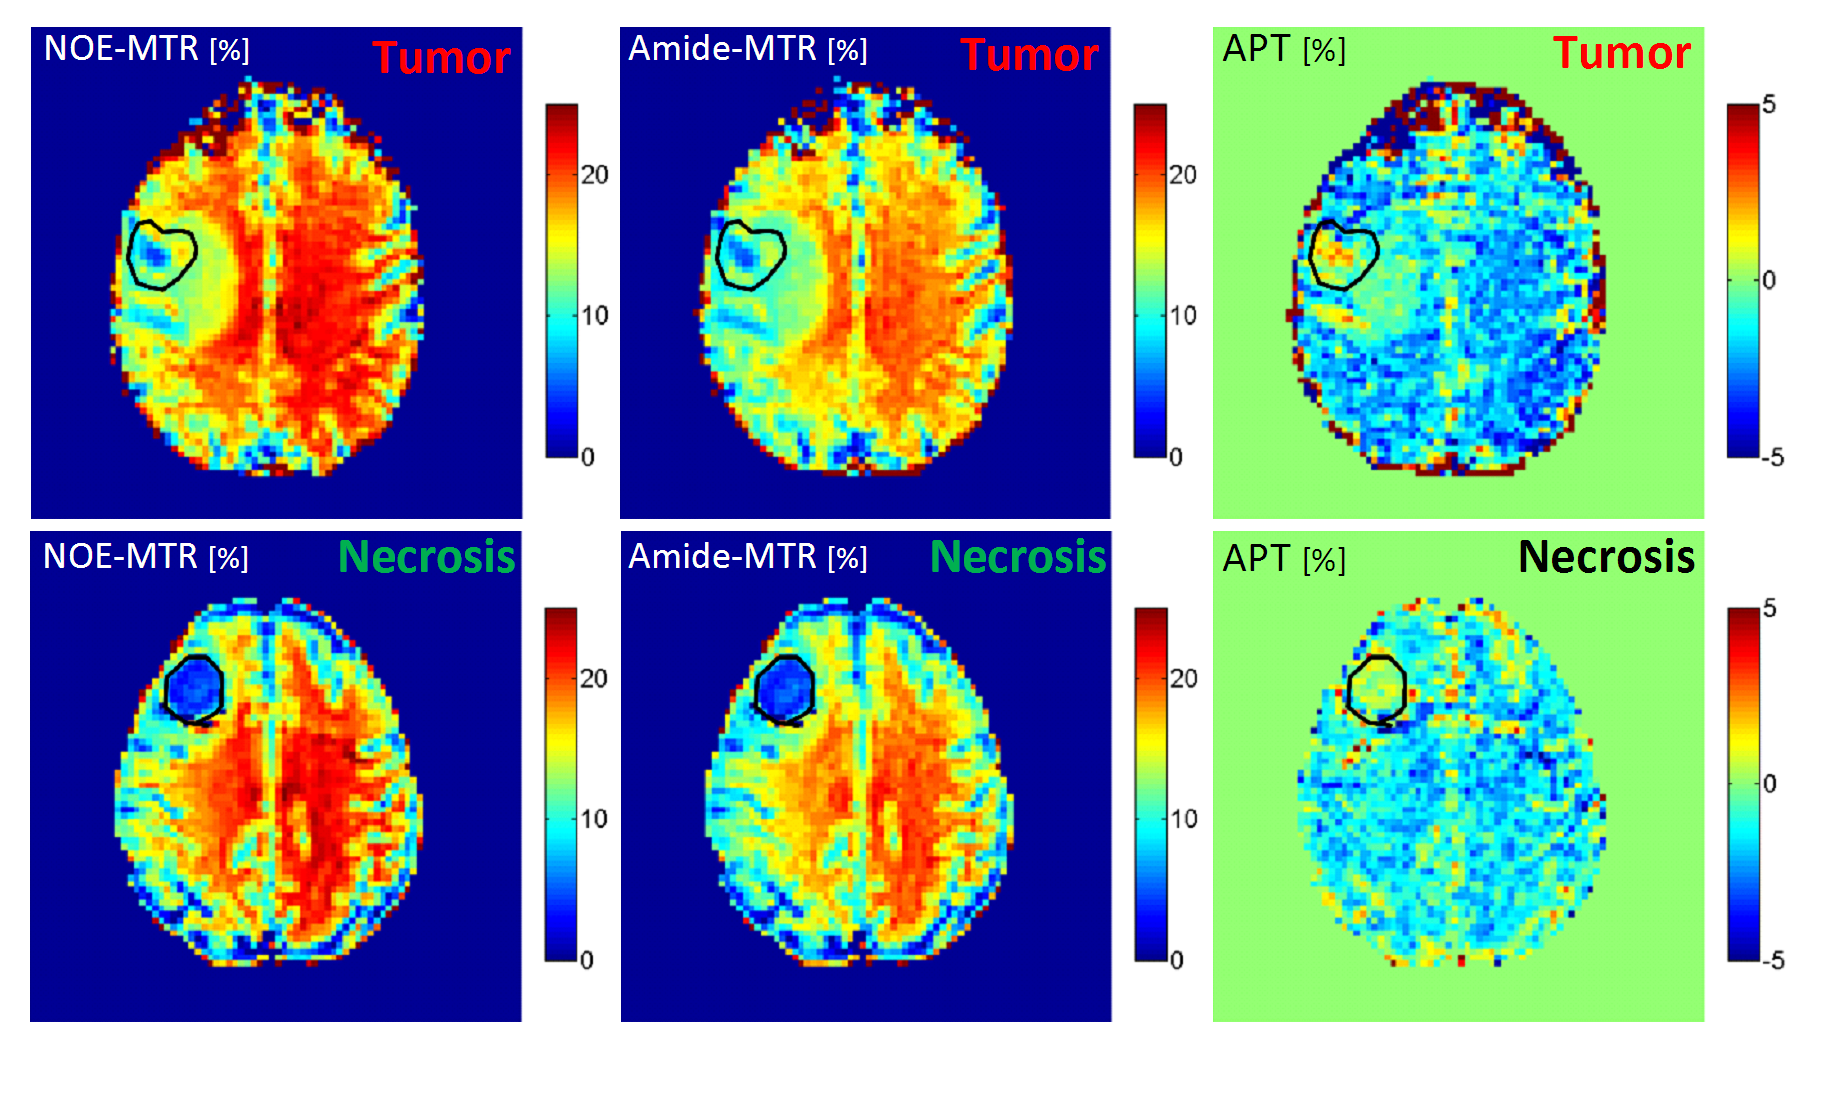
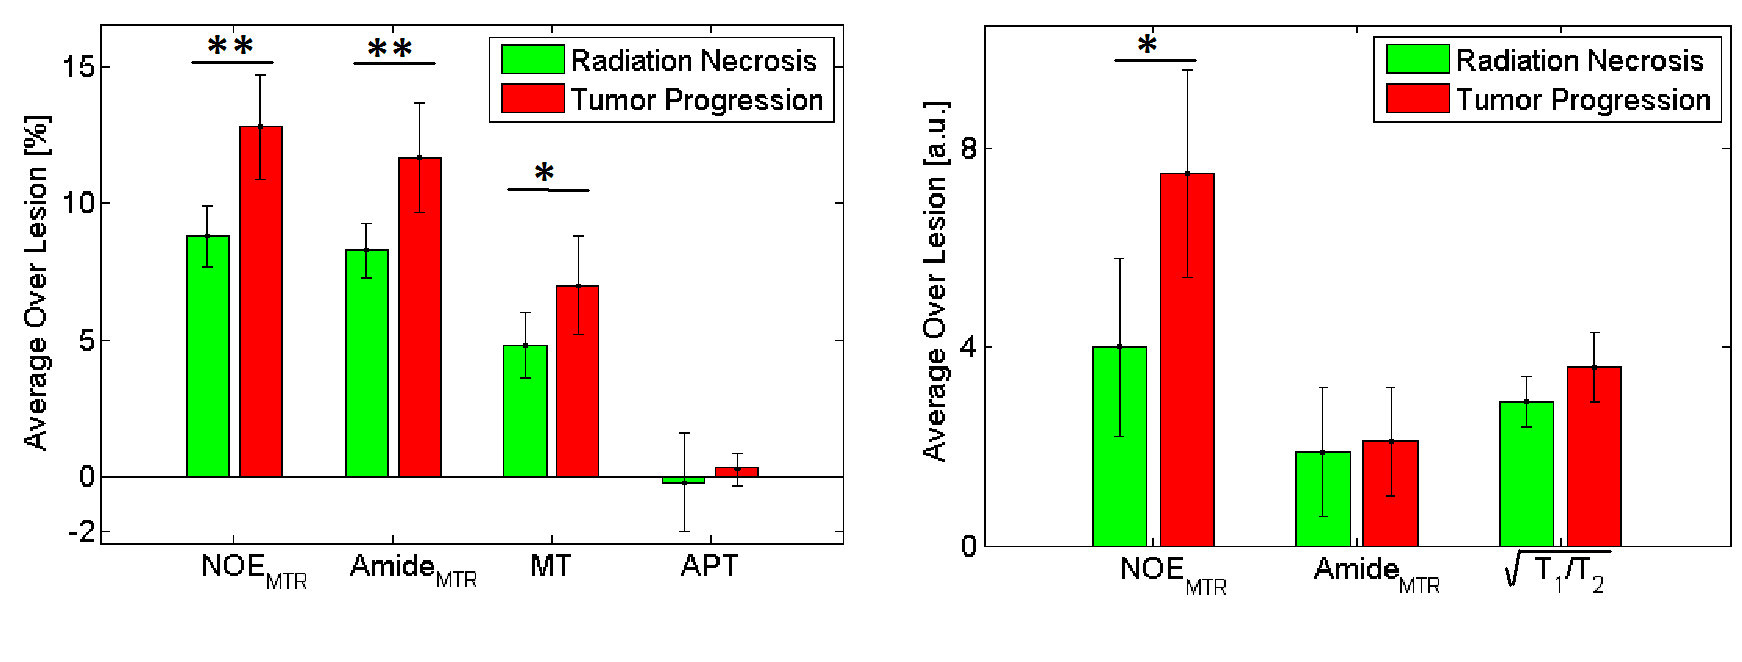
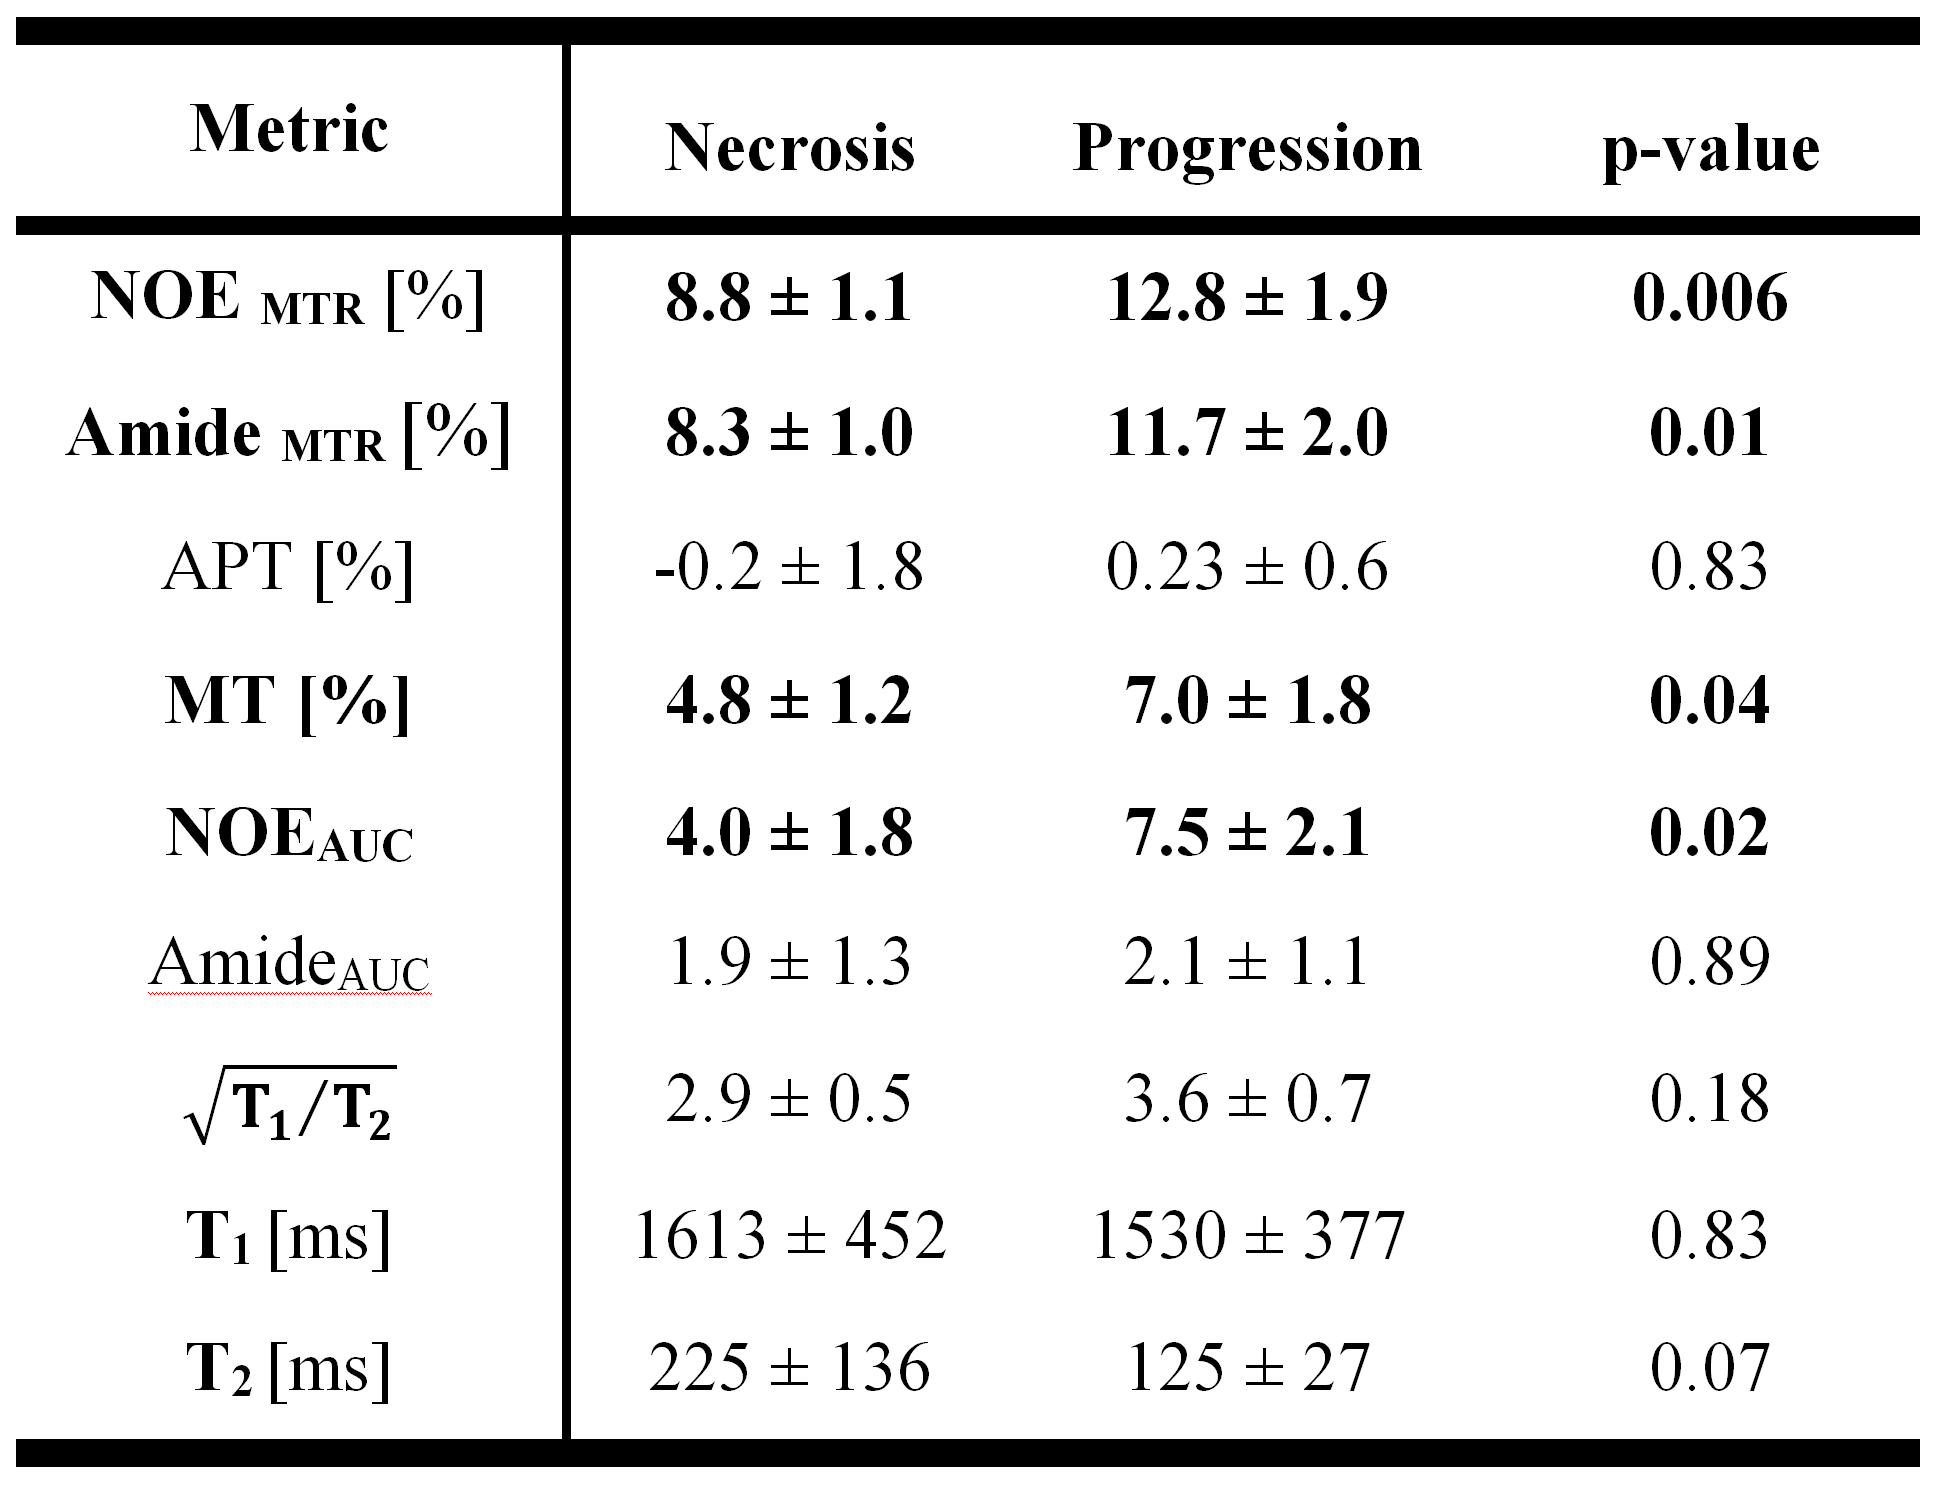
Four lesions were classified as progressing tumor and seven as radiation necrosis. CEST metrics were calculated voxel-by-voxel and then averaged over the lesion ROI for all 11 cases. Figure 2 shows the NOEMTR, AmideMTR and APT maps for the representative necrosis and progression cases, and Figure 3 shows the distribution of all CEST metrics. As reported in Table 1 and shown in Figure 3, the best separation was obtained by NOEMTR (NOEMTR,necrosis=8.8±1.1, NOEMTR,progression=12.8±1.9, p=0.006) and AmideMTR (AmideMTR,necrosis=8.3±1.0, AmideMTR,progression=11.7±2.0, p=0.01). MT (MTnecrosis=4.8±1.2, MTprogression=7.0±1.8, p=0.04) and NOEAUC (NOEAUC,necrosis=4.0±1.8, NOEAUC,progression=7.5±2.1, p=0.02) provided statistically significant separation but with higher p-values. Other metrics did not provide a statistically significant separation of the two conditions.Discussions
There were decreased NOEMTR and AmideMTR signals in the lesions (necrosis or progression) compared to normal brain tissue. However, the signal drop was significantly higher in necrosis cases. The APT maps showed an elevated APT signal (compared to normal brain tissue) for the lesion regions for both necrosis and progression cases. However, the difference between the two cohorts was not as pronounced as the MTR signals.
All metrics showed a higher value for the progression cases compared to necrosis cases and these differences were statistically significant for NOEMTR (p=0.006), AmideMTR (p=0.01), MT (p=0.04) and NOEAUC(p=0.02). The best separation was observed in MTR metrics which represents the combination of MT, CEST and direct effect, and the biggest contributor to the differences in MTR values was the MT component (figure 3).
The CEST effects at NOE and Amide peaks were very similar which might be the reason that APT (which represents the difference between these two CEST effects) did not result in statistically significant differences (p=0.83) and could not differentiate radiation necrosis from tumor progression.
Conclusions
CEST was capable of differentiating radiation necrosis from tumor progression in brain metastases treated with SRS. Both NOEMTR and AmideMTR provided statistically significant separation of the two cohorts. However, APT was unable to differentiate the two groups since the difference between their APT values was not statistically significant.Acknowledgements
This study wa funded by Terry Fox Research Institute (TFRI project 1034) and Canadian Cancer Society Research Institute (CCSRI 701640).References
1. Aoyama H, Shirato H, Tago M, et al. Stereotactic radiosurgery plus whole-brain radiation therapy vs stereotactic radiosurgery alone for treatment of brain metastases: A randomized controlled trial. J. Am. Med. Assoc. 2006;295:2483–2491.
2. Patchell RA, Tibbs PA, Regine WF, et al. Postoperative radiotherapy in the treatment of single metastases to the brain: A randomized trial. J. Am. Med. Assoc. 1998;280:1485–1489.
3. Greene-Schloesser D, Robbins ME, Peiffer AM, et al. Radiation-induced brain injury: A review. Front. Oncol. 2012;2:73.
4. Hoefnagels FW, Lagerwaard FJ, Sanchez E, et al. Radiological progression of cerebral metastases after radiosurgery: Assessment of perfusion MRI for differentiating between necrosis and recurrence. J. Neurol. 2009;256:878–887.
5. Zhou J, Tryggestad E, Wen Z, et al. Differentiation between glioma and radiation necrosis using molecular magnetic resonance imaging of endogenous proteins and peptides. Nat. Med. 2011;17:130–134.
6. Desmond KL, Moosvi F, Stanisz GJ. Mapping of amide, amine, and aliphatic peaks in the CEST spectra of murine xenografts at 7 T. Magn. Reson. Med. 2014;71:1841–1853.
7. Desmond KL, Mehrabian H, Chavez S, et al. Chemical exchange saturation transfer for predicting response to stereotactic radiosurgery in human brain metastasis. Magn. Reson. Med. 2016, In Press.
Figures