4242
CEST and binding water MT separation in brain tumor by multi pool model CEST Peak Extraction methodMitsuharu Miyoshi1, Masafumi Harada2, Yuki Kanazawa2, and Hiroyuki Kabasawa1
1Global MR Applications & Workflow, GE Healthcare Japan, Hino, Tokyo, Japan, 2Graduate School of Biomedical Sciences, Tokushima University, Tokushima, Japan
Synopsis
Although MTR asymmetry is often used as a CEST parameter, it is not quantitative. In this study, CEST Peak Extraction (CPE) method was used to separate CEST and MT parameters. CEST peaks in brain tumor could be fitted with Lorentzian function on CPE spectrum. Each fitted parameter had a quantitative meaning in multi pool model, which includes CEST pool, binding water MT pool and free water pool.
PURPOSE
MTR asymmetry is often used as a CEST parameter. However, MTR asymmetry is not quantitative. CEST (Amide Proton Transfer (APT) and NOE), Binding water MT and free water parameters were calculated by using multi pool model.METHOD
CEST Peak Extraction (CPE) spectrum: Investigational version Phase Cycle preparation RF pulse $$$^{ref1}$$$ was used in this study (Fig.1). Approximation solution of CPE-spectrum in multi pool model (A: Free water pool, B: Binding water MT pool, $$$c_n$$$: n-th CEST pool, n=1 and 2 for APT and NOE, respectively) was given in Eq.1.1 and 1.2 $$$^{ref2,3,4}$$$, $$ CPE{(\Delta\varphi)}=\left(\frac{1}{Z(\Delta\varphi)}-1\right)F_{even}(\Delta\varphi)\approx a_{const}+a_{even}F_{even}(\Delta\varphi)+\sum_n\left(\frac{a_{1,n}}{a_{2,n}+F_{even}(\Delta\varphi-a_{3,n})}\right). (Eq.1.1) $$ $$ a_{const}\approx R_{2A}\frac{\omega_1^{2}}{R_{1A}},\ a_{even}\approx\frac{f_B}{R_{2B}} \frac{\omega_1^{2}}{R_{1A}},\ F_{even}(\Delta\varphi)=\frac{2\left(1-\cos(\Delta\varphi)\right)}{{T_{iter}}^2}, $$ $$ a_{1,n}\approx f_{C_n}k_{C_n}\frac{\omega_1^{2}}{R_{1A}}F_{even}(\Delta\varphi_{C_n}),\ a_{2,n}\approx k_{C_n}^2+\omega_1^{2},\ a_{3,n}\approx \Delta\varphi_{C_n}.\ (Eq.1.2) $$ CEST peaks have Lorentzian function shape in CPE-spectrum. CEST peak area was calculated in Eq.1.3. $$ area_{C_n}=\frac{a_{1,n}}{\sqrt{a_{2,n}-\omega_1^{2}}}\approx f_{C_n}\frac{\omega_1^{2}}{R_{1a}}F_{even}(\Delta\varphi_{C_n}). (Eq.1.3) $$ where Z is a Z-spectrum, $$$R_{1\ or\ 2,\ A\ or B}$$$ are $$$T_1$$$ or $$$T_2$$$ relaxation rate of pool A or B, $$$k_{C_n}$$$ is chemical exchange transfer rate from pool $$$C_n$$$ to pool A, $$$f_{B\ or\ C_n}$$$ is magnetization ratio of pool B or $$$C_n$$$ to pool A, $$$\Delta\varphi$$$ is RF phase, $$$\Delta\varphi_{C_n}$$$ is RF phase that corresponds to the offset frequency of n-th CEST pool, $$$\omega_1$$$ is mean B1 of RF pulse, and $$$T_{iter}$$$ is the repetition time of Phase Cycle preparation RF pulse. The parameters $$$area_{C_n}$$$ or $$$a_{even}$$$ includes $$$f_{C_n}$$$ or $$$f_B$$$, respectively. CEST, Binding water MT and Free water related quantitative parameters were calculated in Eq.2.1, 2.2 and 2.3. $$ \frac{f _{C_n}}{R_{2A}}\approx\frac{area_{C_n}}{a_{const}F_{even}(\Delta\varphi_{C_n})}\ (Eq.2.1),\ \frac{f_B}{R_{1A}R_{2B}}\approx\frac{a_{even}}{\omega_1^2}\ (Eq.2.2),\ \frac{R_{1A}}{R_{2A}}\approx\frac{\omega_1^{2}}{a_{const}}\ (Eq.2.3). $$ Patient study: Seven brain tumor patients were scanned under IRB approval and written informed consent. EPI was used for data acquisition. RF phase $$$\Delta\varphi$$$ of Phase Cycle preparation pulse was between ±$$$\pi$$$ in 32 phases, which is equivalent to ±7 ppm in 0.4375ppm steps in conventional pulsed RF method. Mean B1 of preparation RF pulse was 2$$$\mu$$$T. Total RF irradiation time to achieve steady state was 3.5sec. Levenberg-Marquardt algorism was used for non-linear Lorentzian fitting. Three parameters in Eq.2 were calculated for each pixel. The parameter in Eq.2.1 at +3.5ppm peak was visualized as an APT map. The parameters in Eq.2.2 and Eq.2.3 were visualized as Binding water MT and Free water maps, respectively. MTR asymmetry map at ±3.5ppm was calculated as a reference. Matlab was used for calculation. Field strength was 3T (MR750, GE Healthcare).RESULTS
Both measured and fitted results of Z- and CPE-spectrums at brain tumor are shown in Fig.2. CEST Lorentzian peak was extracted from CPE-spectrum. Three maps of Eq.2 and MTR asymmetry map are shown in Fig.3. Tumor, white matter or CSF had high signal in APT map, MT map or Free water map, respectively. Although APT map was like the MTR asymmetry map, APT map has quantitative meaning and additional MT map could be calculated.DISCUSSION
CEST pools were extracted from Free water pool and Binding water MT pool. Although APT peak was broad in Z-spectrum and MTR asymmetry, APT (+3.5ppm) peak was observed in CPE-spectrum (Fig.2 right). Because the number of clinical data was only seven, statistical analysis was difficult. However, trend of the signal intensity was like in Table 1. Parameters in Eq.2 have quantitative meanings. $$$R_{1A}$$$ and $$$R_{2A}$$$ can be measured in different scan. Although $$$R_{2B}$$$ is not easy to be measured, it could be assumed to be constant in brain. From Eq.1.2, transfer rate can be calculated by $$$k_{C_n}=\sqrt{a_{2,n}-\omega_1^{2}}$$$. Calculated $$$k_{C_n}$$$ was 1286Hz in Fig.1 but the transfer rate of APT was around 30Hz in literatures $$$^{ref5}$$$. In the case that +3.5ppm peak overlapped NH$$$_2$$$ peak (+2.0ppm, transfer rate around 1000Hz), peak width might be broadened and $$$k_{C_n}$$$ might be overestimated. This is a limitation of this study.CONCLUSION
CEST peaks in CPE-spectrum were fitted with Lorentzian function in multi pool model. APT, MT and Free water parameters were separated. Calculated parameters had quantitative meanings and tumor had high APT parameter.Acknowledgements
No acknowledgement found.References
(1) Miyoshi M. et al., proceedings of ISMRM 2014, #3299, (2) Zaiss M, Bachert P. Exchange-dependent relaxation in the rotating frame for slow and intermediate exchange — modeling off-resonant spin-lock and chemical exchange saturation transfer. NMR Biomed 2013;26:507–18. (3) Trott O, Palmer AG. R1ρ relaxation outside of the fast-exchange limit. J Magn Reson 2002;154:157–60. (4) Miyoshi M. et al., proceedings of ISMRM 2015, #3346, (5) Zaiss M. et al, Chemical exchange saturation transfer (CEST) MR Z-spectrocscopy in vivo: a review of theoretical approaches and methods, Phys. Med. Biol. 58 (2013) R211-R269.Figures
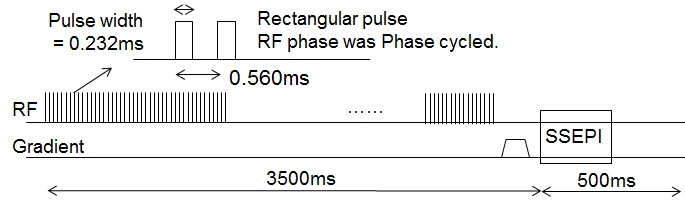
Fig.1: Pulse sequence chart of Phase
Cycle CEST preparation pulse
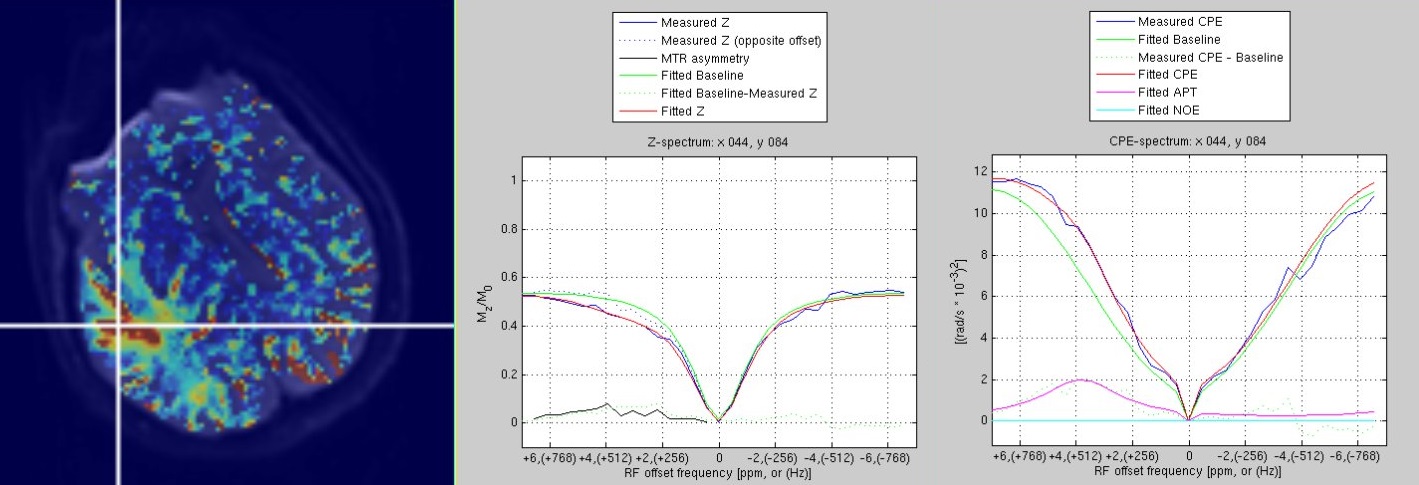
Fig.2: Z- and CPE- spectrums. (Left)
Pixel position on APT + Proton density fusion image,
(Mid) Z-spectrum, (Right)
CPE-spectrum. Baseline (green line) is a fitted spectrum of Free water and MT
pool. APT peak was extracted from Baseline.
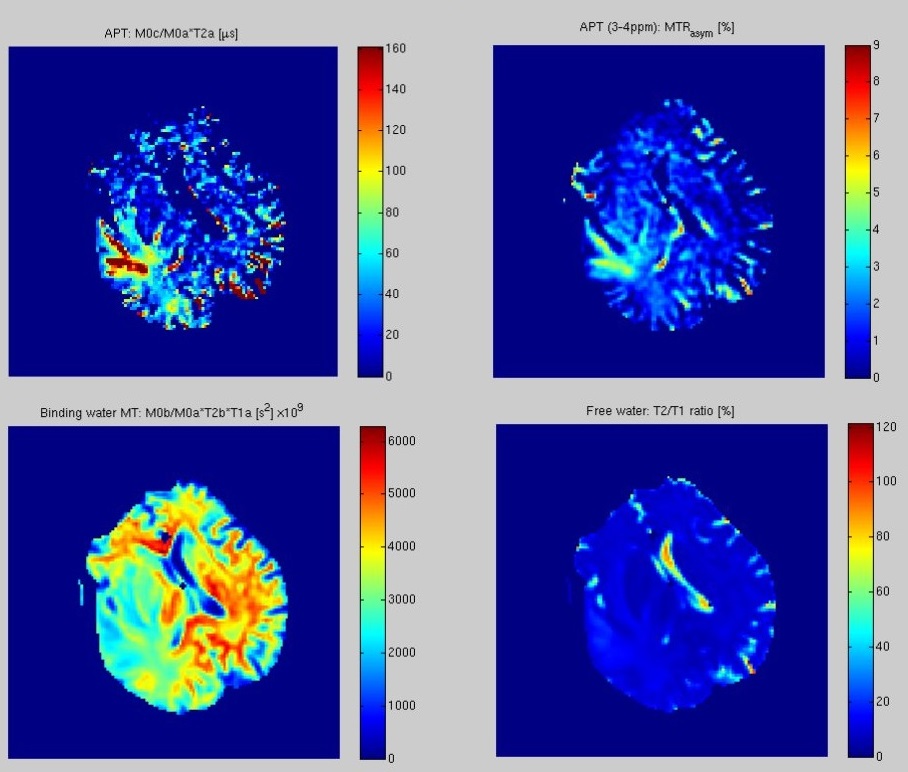
Fig.3: Parameter maps. (From left to
right, top to bottom) APT parameter, MTR$$$_{asym}$$$, MT parameter, Free water
parameter. APT, MT and Free water parameters were calculated in Eq.2.
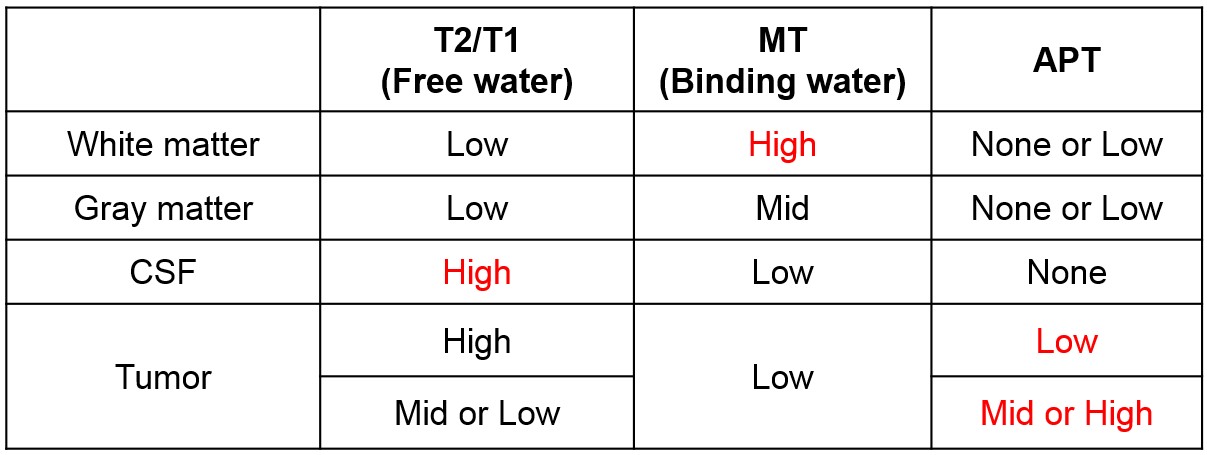
Table 1: Trend of the fitted
parameters. In Tumor, MT was low and APT was inhomogeneous.