4241
23Na-MRI demonstrates a sodium gradient within gliomas as a biomarker of tumor heterogeneity1Department of Radiology, University of Cambridge, Cambridge, United Kingdom, 2Cancer Research UK Cambridge Institute, University of Cambridge, Cambridge, United Kingdom, 3GE Global Research, Munich, Germany, 4Neurosurgery Unit, Department of Clinical Neurosciences, University of Cambridge, Cambridge, United Kingdom
Synopsis
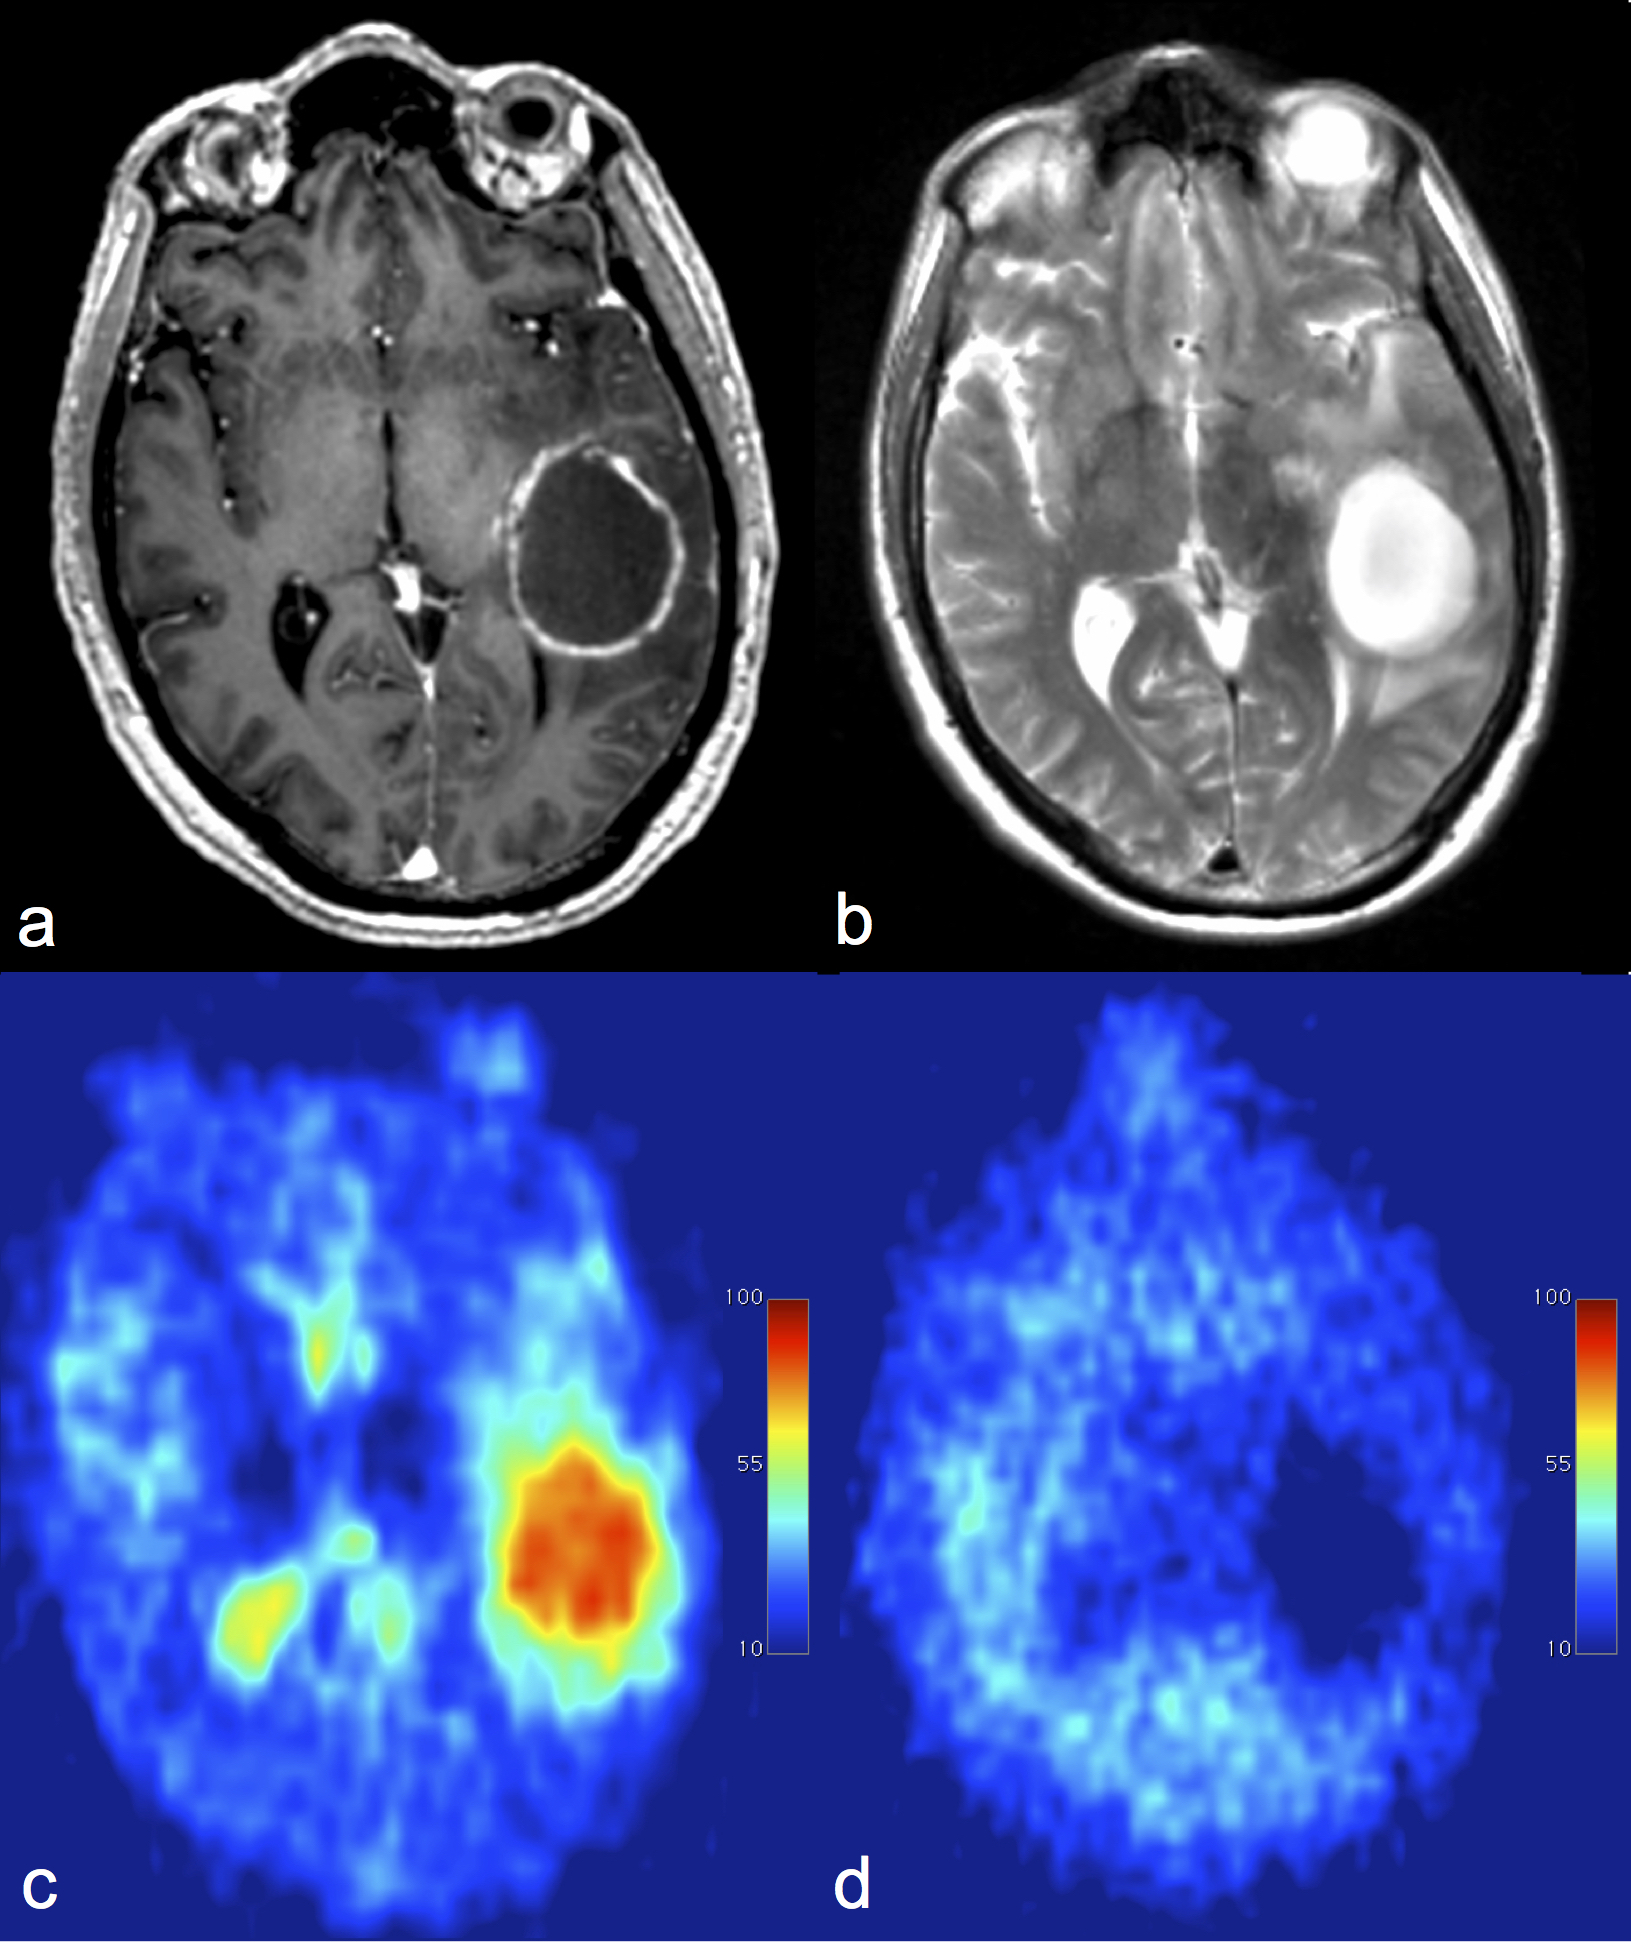
Glioma grade and the extent of local infiltration are important factors for guiding management. Imaging tumor heterogeneity may also improve diagnosis and therapy planning. 23Na-MRI has been used here to demonstrate a gradient in sodium concentration across gliomas: necrosis greater than viable tissue greater than edema. This gradient was evident in all 17 tumors analyzed and is consistent with the expected underlying histopathology; concentration is increasing throughout the evolution from edema, dominated by the extracellular compartment, to the necrotic core, dominated by dead cells and broken sodium pumps. 23Na-MRI may therefore represent an imaging biomarker of tumor heterogeneity in glioma.
Introduction
Gliomas are extremely heterogeneous, both structurally and biologically, which contributes to a very poor prognosis. The increase in mitotic activity within the tumor is associated with a decrease changes in Na+/K+-ATPase activity due to ATP consumption and, therefore, gain in concentration of these ions. 23Na-MRI has the potential to quantify sodium concentration and therefore is an imaging probe of cell morphology and membrane function within the tumor microenvironment, as well as heterogeneity.1–3 The purpose of this study was to evaluate sodium distribution within glioma and in the surrounding tissue.Methods
19 patients were imaged on a 3T clinical scanner (GE Discovery MR750; GE Healthcare, Waukesha, WI) using a Rapid Biomedical (Rimpar, Germany) dual-tuned 23Na/1H birdcage head coil. Sodium imaging was performed using an UTE sequence with 3D-Cones readout (nominal isotropic resolution = 3mm; TR/TE 100/0.5ms; scan time = 12 minutes).4 Intracellular-weighted sodium imaging was obtained using fluid suppression by inversion recovery (adiabatic inversion, TI = 30ms). Phantoms containing a known concentration of NaCl in 4% agar solution were used as calibrants to calculate tissue sodium maps as previously described.5
T2WI (TR/TE 4854/82 ms; 1 average; slice thickness 6 mm; acquisition matrix 512x384; FOV 240x240 mm) and post-gadolinium 3D T1W (1.5mm isotropic resolution reconstructed to 1mm isotropic; TR/TE 8.16/3.18ms; 1 average; slice thickness 1.5 mm; matrix 256x256; FOV 240x240 mm; Gadobutrol 1.0 mmol/mL) sequences were used for image registration (SPM8, University College London, London, UK). A neuroradiologist drew the regions-of-interest (ROIs) on the T2WI and the 3D-T1WI post-Gd sequences using OsiriX (Pixmeo Sarl). Differences between tumor, basal ganglia and white matter in total sodium concentration (TSC) and intracellular sodium concentration (IW-SC) were tested using the paired samples t-test. P-values were considered statistically significant if <0.05.
Results
17 patients completed the examination (age 61.9±12.8; 9 males). Pathology diagnosis was GBM in 11 cases, gliosarcoma in 3 cases, and oligodendroglioma, metastasis and undefined glioma in 1 case each. TSC in the lesion was 57.1±18.2mM in the High Grade Glioma (HGG), 75.74 mM in the Low Grade Glioma (LGG) and 52 mM in the metastasis. The intracellular sodium concentration (IW-SC) was 27±21.2 mM in the HGGs; 19.1 mM in the LGG and 9.4 mM in the metastasis.
TSC in the basal ganglia was consistent across the entire group (36.3 mM in the LGG, 36.9±14.9 mM in HGGs and 36.1 mM in the metastasis). In the white matter, TSC was 36.8±19.7 mM in the HGGs, 46.1 mM in the LGG and 29.8 mM in the metastasis.
TSC was significantly higher in tumors when compared to Normal Appearing Grey Matter (NAGM; p=0.0001) and Normal Appearing White Matter (NAWM; p=0.0001). The tumor IW-SC was not statistically significantly different as compared to NAGM (p=0.063) or NAWM (p=0.870).
Discussion
In all cases, TSC was higher in the entire lesion and in the enhancing tumor compared to the basal ganglia and NAWM. In the majority of cases, the result for IW-SC was reversed, but this trend was not statistically significant; this may represent the fact that most of the sodium in the lesion is contained in the extracellular space which has been suppressed in the IW-SC.
HGGs showed lower TSC and higher IW-SC compared to the single LGG which may reflect the presence of extracellular edema within in the LGG as opposed to the higher cell density of the HGG. The IR sequence suppresses the extracellular compartment and is weighted towards the intracellular sodium concentration. Only a single metastasis was recruited which showed an almost complete signal drop, with barely identifiable sodium, in the edema around the metastasis on the IW-SC images consistent with a sharp demarcation in vasogenic nature around the lesion.
Conclusion
In conclusion, we have demonstrated a sodium concentration gradient across gliomas: necrosis > viable tissue > edema. This gradient is evident in all the tumors analyzed and it is consistent with the expected underlying histopathology. Indeed, sodium concentration is increasing troughout the malignant transformation process with an initial increase in the edema dominated by the extracellular compartment, followed by a greater increase in the viable tissue due to increase in the intracellular component and, eventually, a larger concentration in the necrosis due to cells death and sodium pumps break down. Sodium imaging successfully highlighted regional heterogeneity within the lesions and between the different type of brain tumors which may have both prognostic and therapeutic value.Acknowledgements
This study was supported by the CRUK-EPSRC Cancer Imaging Centre in Cambridge and Manchester, the NIHR Cambridge Biomedical Research Centre and the Cambridge Experimental Cancer Medicine Centre (ECMC).References
1. Thulborn KR, Lu A, Atkinson IC, Damen F, John V. Quantitative Sodium MR Imaging and Sodium Bioscales for the Management of Brain Tumors. Neuroimaging Clin N Am. 2009;19(4):615–24.
2. Ouwerkerk R, Bleich K, Gillen J. Tissue sodium concentration in human brain tumors as measured with 23 Na MR imaging. Radiology. 2003;23(10):529–37.
3. Zaaraoui W, Konstandin S, Audoin B, Nagel a. M, Rico a., Malikova I, et al. Distribution of Brain Sodium Accumulation Correlates with Disability in Multiple Sclerosis: A Cross-sectional 23Na MR Imaging Study. Radiology. 2012;264(3):859–67.
4. Riemer F, Solanky BS, Stehning C, Clemence M, Wheeler-Kingshott CAM, Golay X. Sodium (23Na) ultra-short echo time imaging in the human brain using a 3D-Cones trajectory. Magn Reson Mater Physics, Biol Med. 2014;27(1):35–46.
5. Inglese M, Madelin G, Oesingmann N, Babb JS, Wu W, Stoeckel B, et al. Brain tissue sodium concentration in multiple sclerosis: a sodium imaging study at 3 tesla. Brain. 2010 Mar;133(Pt 3):847–57.
Figures