4238
Prediction of IDH Mutation Status of Diffuse-Gliomas Based on Short-Echo Time Magnetic Resonance Spectroscopy at 3T1Institute of Biomedical Engineering, Bogazici University, Istanbul, Turkey, 2Department of Neurosurgery, Acibadem University, Istanbul, Turkey, 3Neuroradiology Research Center, Acibadem University, Istanbul, Turkey, 4Department of Medical Engineering, Acibadem University, Istanbul, Turkey, 5Department of Molecular Biology and Genetics, Acibadem University, Istanbul, Turkey, 6Department of Radiology, Acibadem University, Istanbul, Turkey
Synopsis
The tumor biology of diffuse-gliomas is best reflected by their molecular profile. Isocitrate dehydrogenase (IDH) mutation status has the strongest correlation to treatment response and patient survival among all molecular markers. The aim of this study is to predict IDH mutation status of gliomas based on short-echo time MR spectroscopic (MRS) biomarkers by using machine learning algorithms at 3T. Our results indicated that MRS based biomarkers were able to discriminate between IDH-mutant and IDH-wild type patients with up to 91% sensitivity, %78 specificity, and 86.9% accuracy by using an ensemble of bootstrap-aggregated decision trees classification with a three-fold cross validation.
PURPOSE
Overall survival of gliomas has been reported to be highly associated with the presence or absence of isocitrate dehydrogenase (IDH) mutations, telomerase reverse transcriptase (TERT) promoter mutations, and 1p/19q codeletion1. IDH mutant (IDH-MUT) gliomas have a better natural history, better treatment response and longer survival than IDH-wild type (IDH-WT) tumors. Magnetic resonance spectroscopy (MRS) provides noninvasive markers of tumor metabolism. IDH-mutant patients have been reported to have higher 2-hydroxyglutarate (2HG)2,3, and lower glutamate (Glu)4 and glutathione (GSH)5 than IDH-wild type patients. The aim of this study is to predict the IDH mutation status of diffuse gliomas based on magnetic resonance spectroscopic biomarkers at 3T.METHODS
107 patients diagnosed with a diffuse-glioma (32 glioblastoma multiforme (GBM), 24 grade III astrocytoma, 7 grade III oligodendroglioma, 5 grade III oligoastrocytoma, 17 grade II astrocytoma, 18 grade II oligodendroglioma, 4 grade II oligoastrocytoma, 33F/74M, WHO 2007 or 2016) were scanned at a Siemens Tim Trio clinical 3T scanner (Erlangen, Germany) by using a 32-channel head coil. Magnetic resonance spectroscopy data were acquired from the solid tumor region excluding gross hemorrhage, edema and necrosis by using a short echo time (TE) Point Resolved Spectroscopy (PRESS) sequence (repetition time (TR)=2000 ms, TE=30ms, 1024 points, 1200 Hz, voxel size= 10x10x10 mm3, number of signal averages= 192, acquisition time=6.5 min). The data were processed by using LCModel6. Twenty-five MR spectroscopic peak concentrations (mmol per kg wet weight) were quantified for each spectrum. For each patient, any metabolite with a Cramer-Rao lower bound of more than 30 was excluded from the analysis. IDH-mutation status was determined by sequencing of the IDH1/2-mutational hotspots in operative tumor samples. A Mann-Whitney ranksum test was used to identify statistically significant MR spectroscopic differences between IDH-MUT and IDH-WT patients. Machine-learning methods, including linear and medium Gaussian support vector machine (SVM), linear discriminant analysis (LDA), quadratic discriminant analysis (QDA), cosine k-nearest neighbor (KNN), logistic regression, ensemble of bootstrap-aggregated (bagged) trees, and ensemble of subspace KNN, were applied to classify IDH status of diffuse-gliomas based on MR spectroscopic biomarkers in MATLAB. The feature sets included either metabolite concentrations or metabolite to (phosphocreatine+creatine) concentration ratios (metabolite/PCr+Cr). The classification algorithms were run twice for all the metabolites and a subset of nine metabolites (glutamate (Glu), glutamine (Gln), glycine (Gly), 2-hydroxyglutarate (2HG), glutathione (GSH), myo-inositol (Ins), lactate (Lac), total choline (GPC+PCh), and total NAA (NAA+NAAG)) that had a statistically significant difference of metabolite concentration or metabolite/PCr+Cr between IDH-MUT and IDH-WT patients. Three-fold cross validation was employed during training, and the sensitivity, specificity and accuracy of the classification algorithms were compared.RESULTS
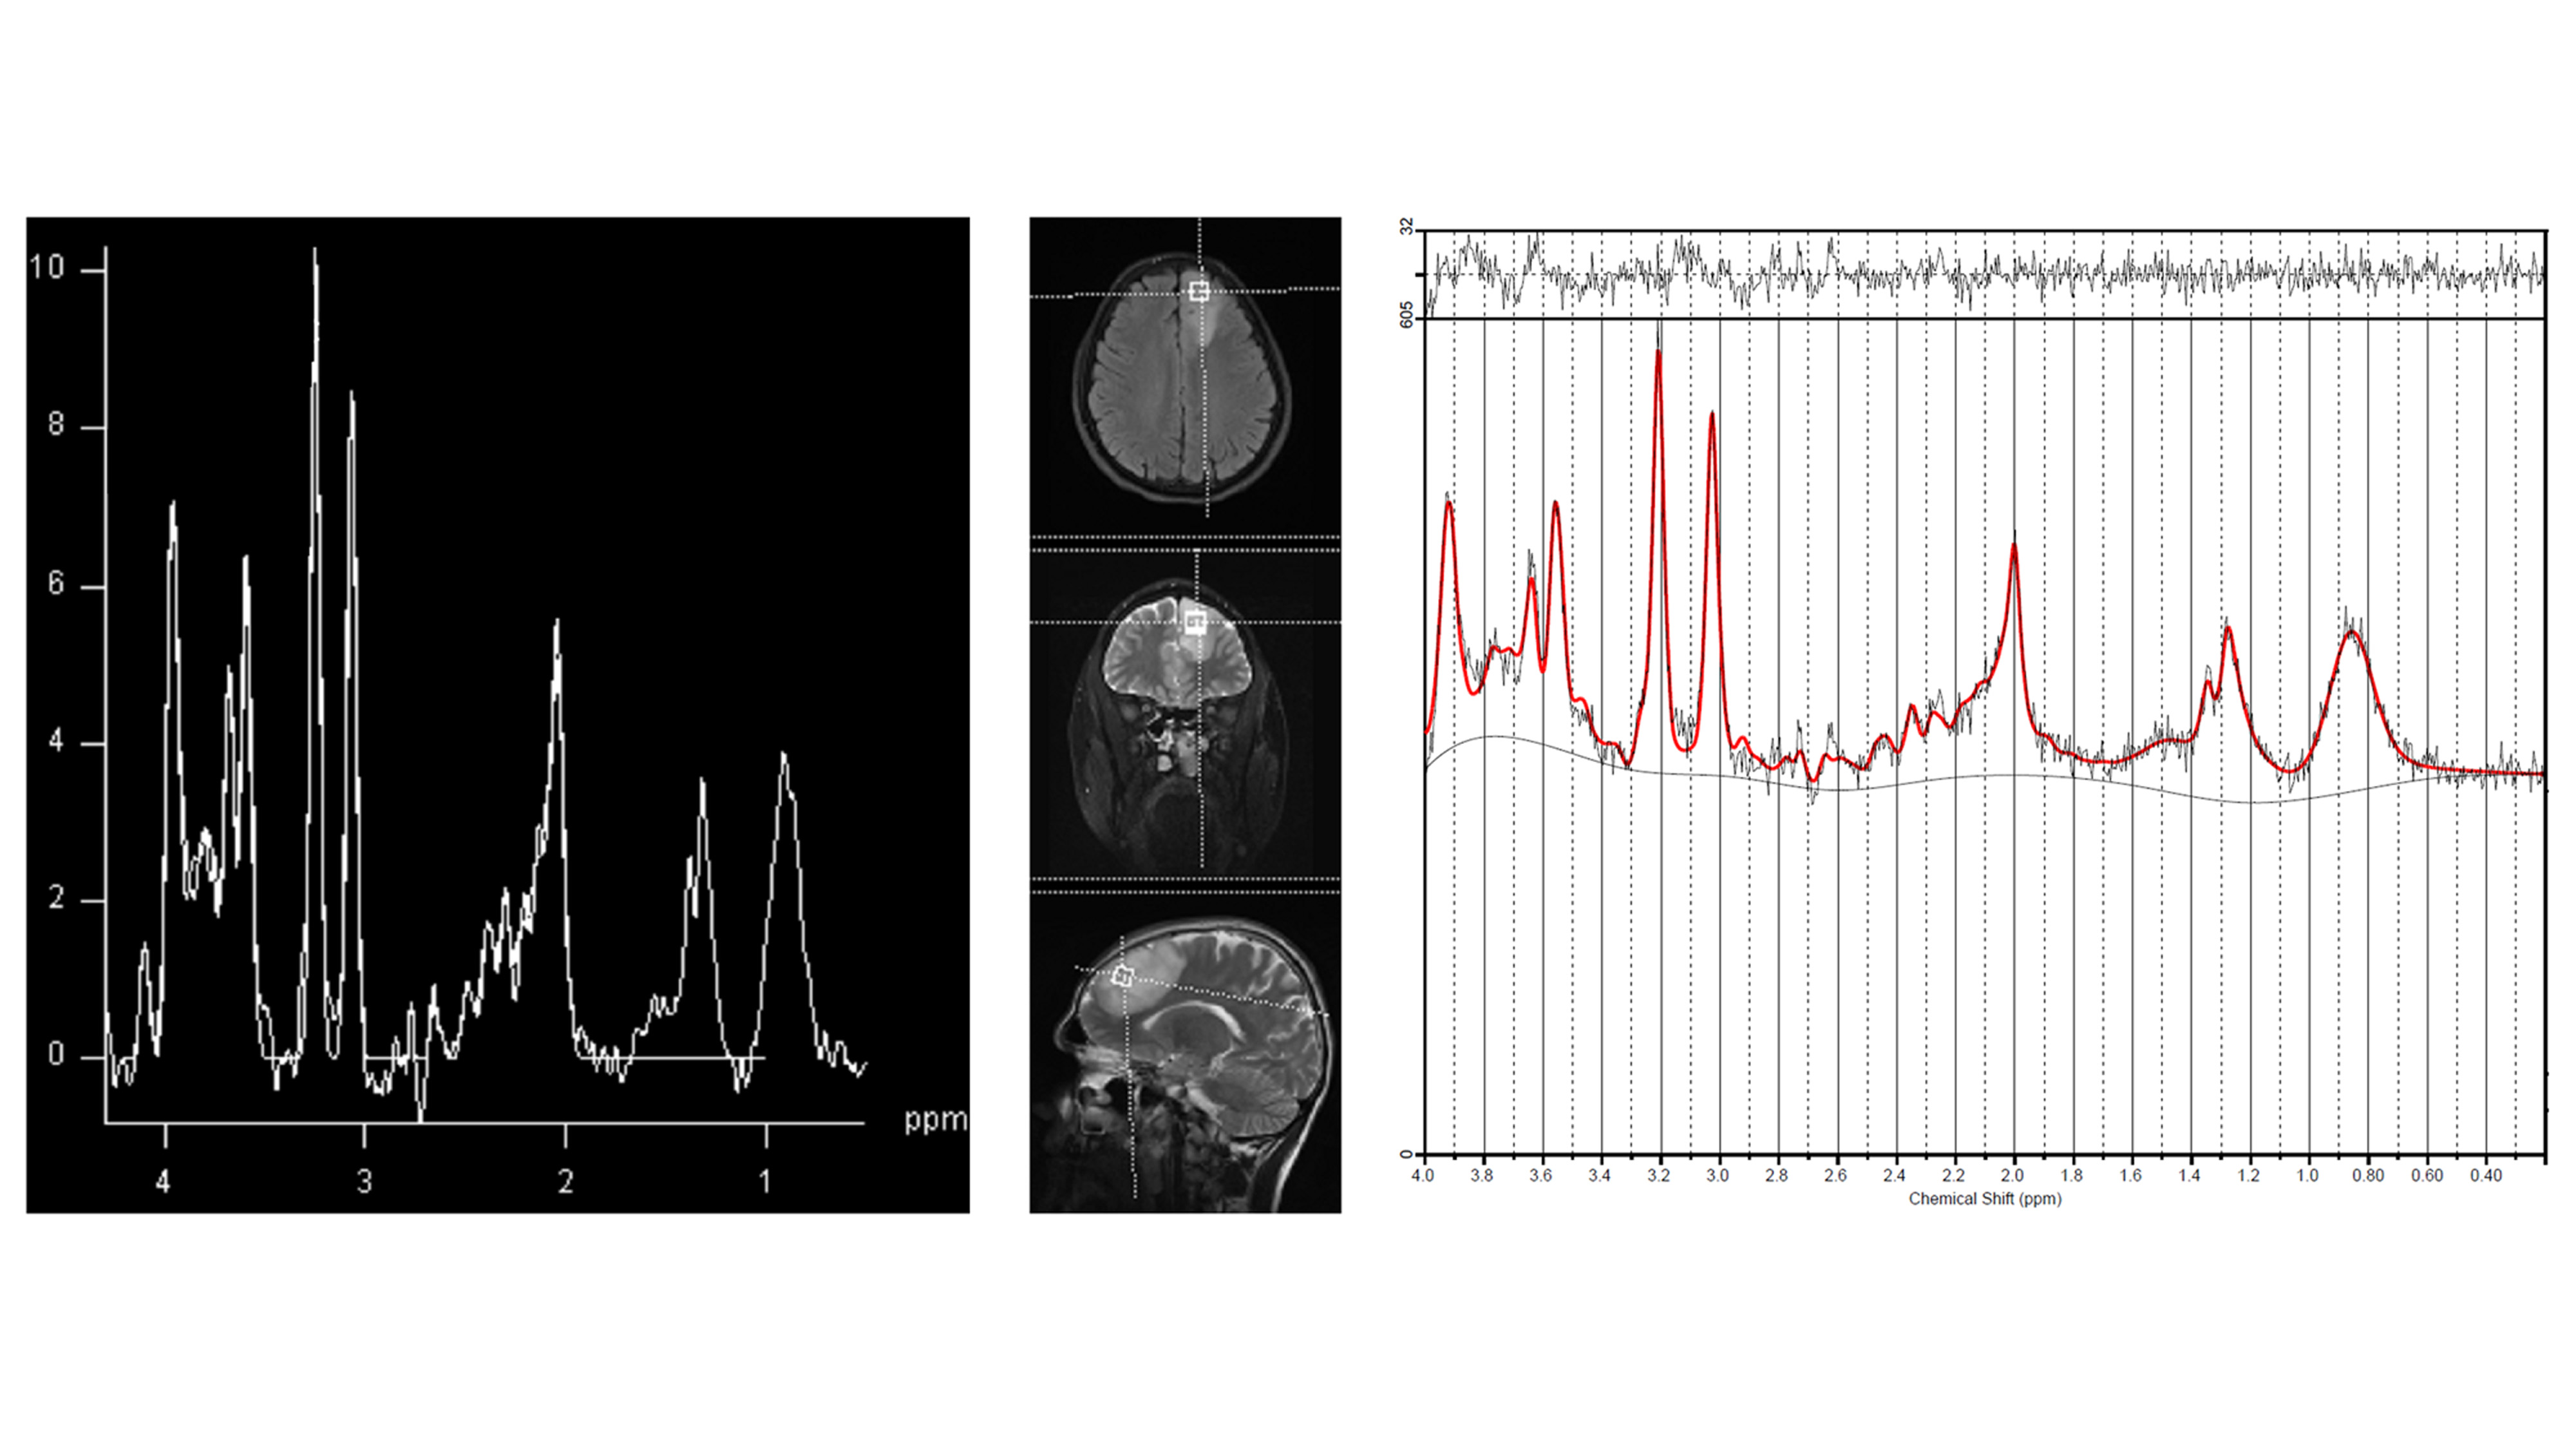
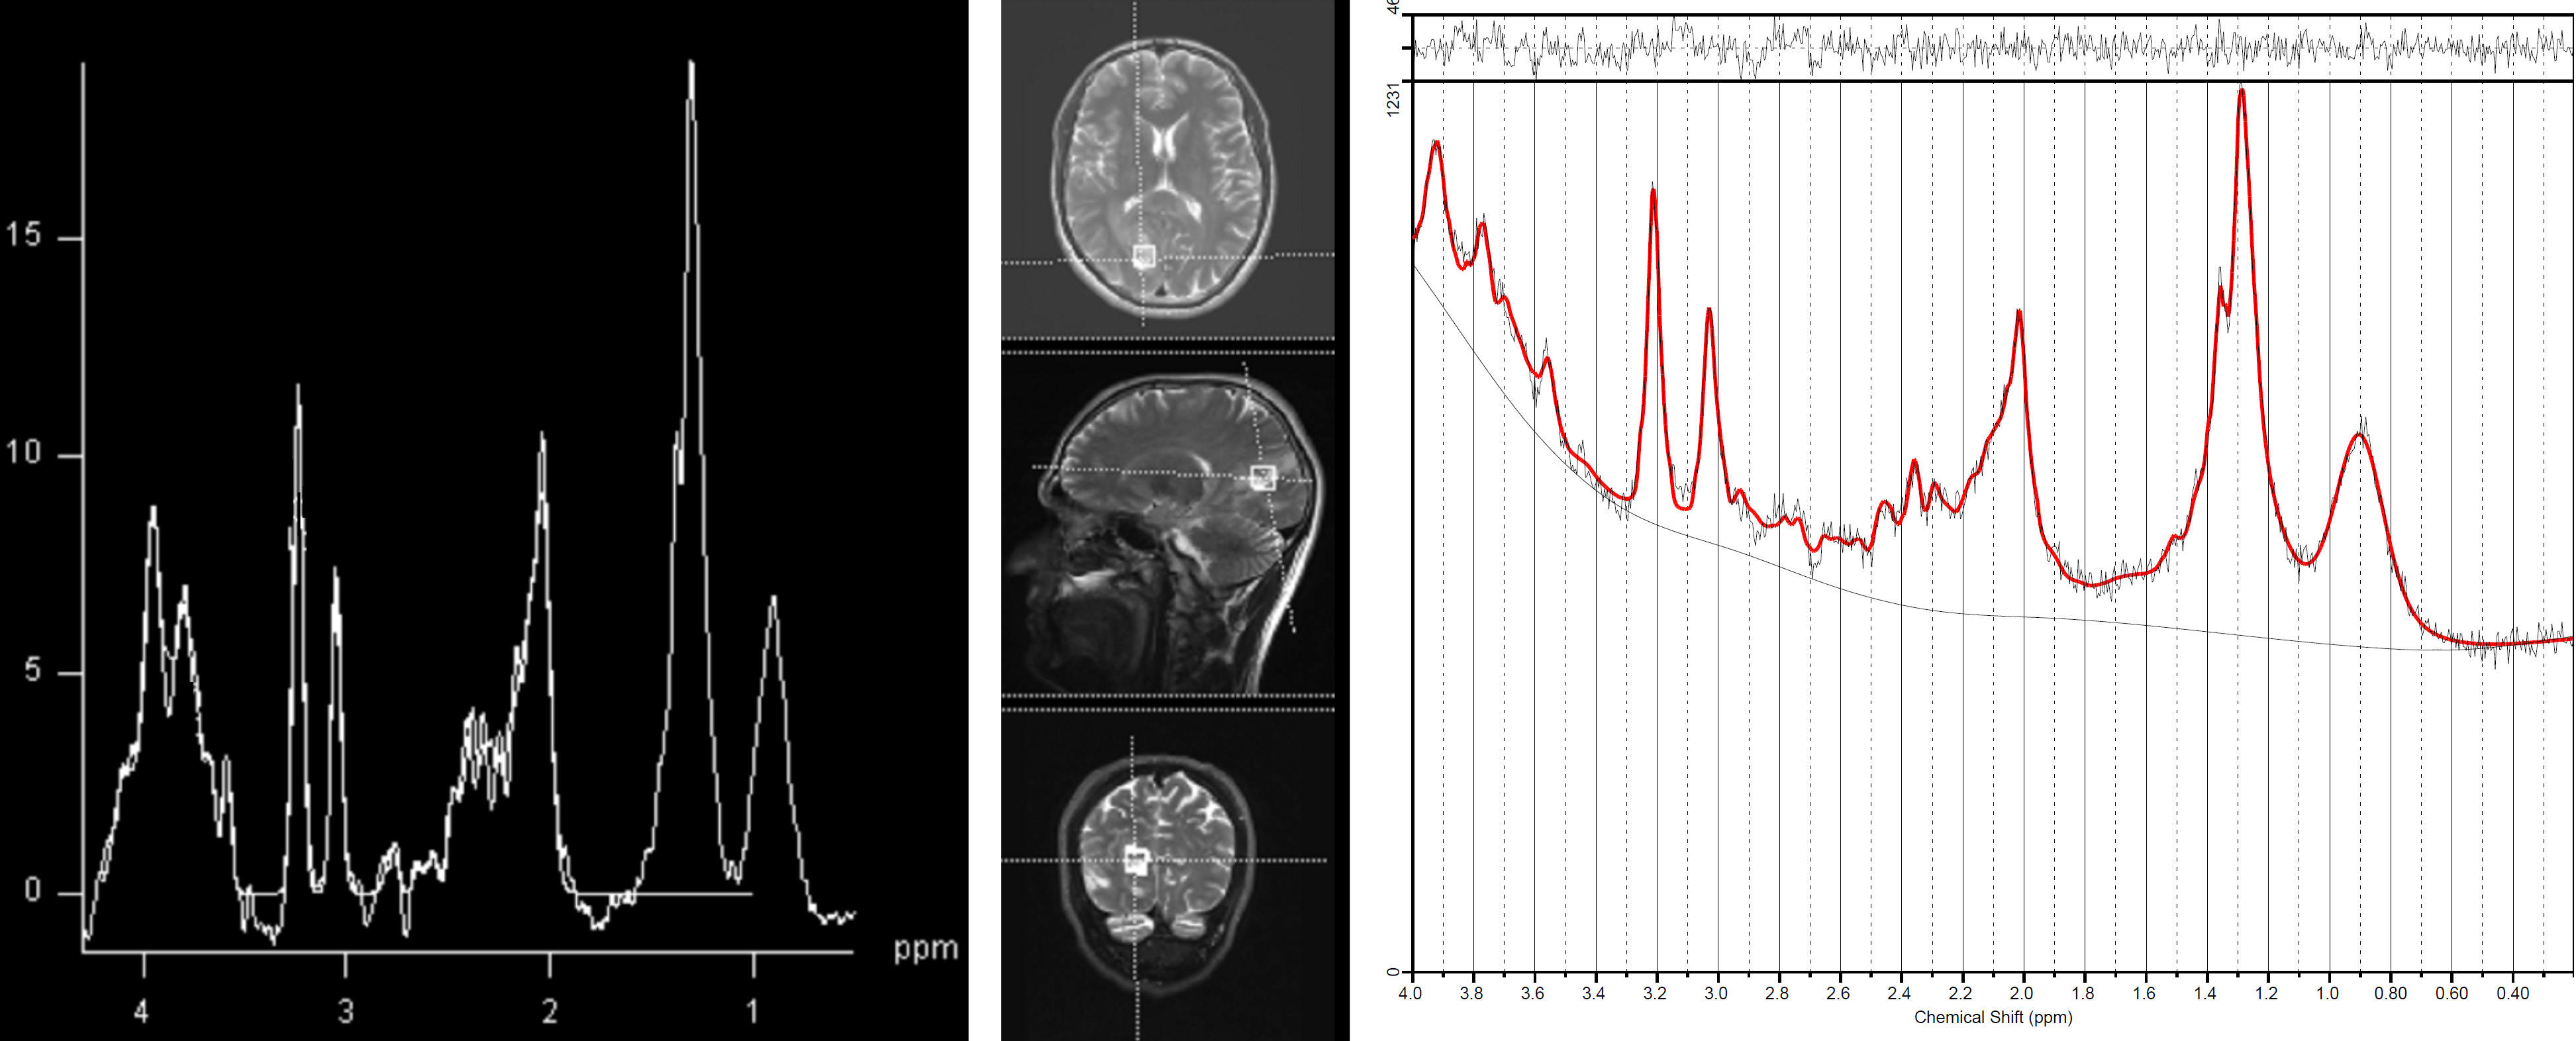
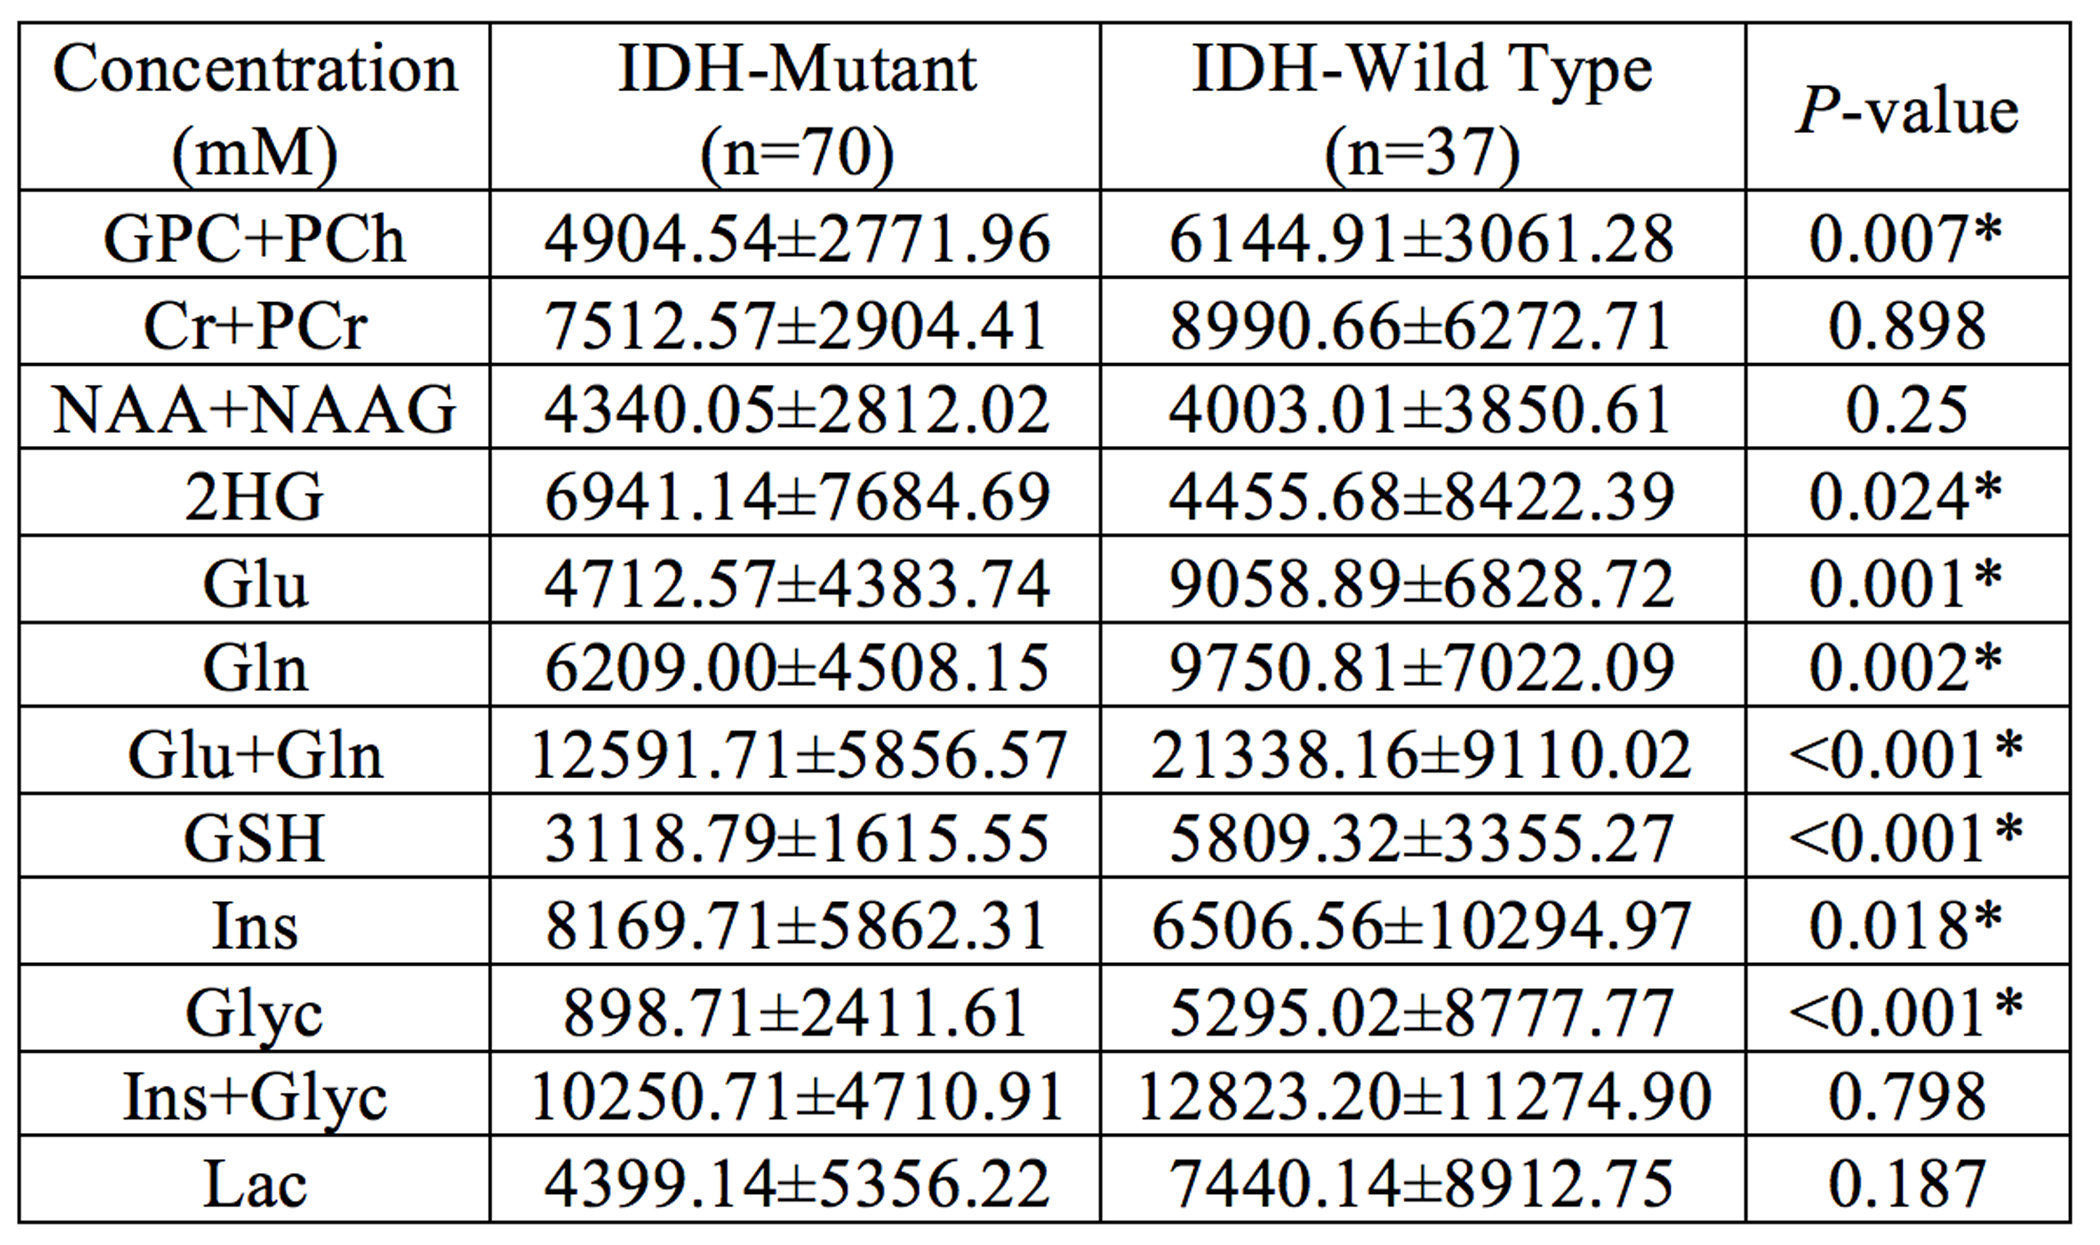
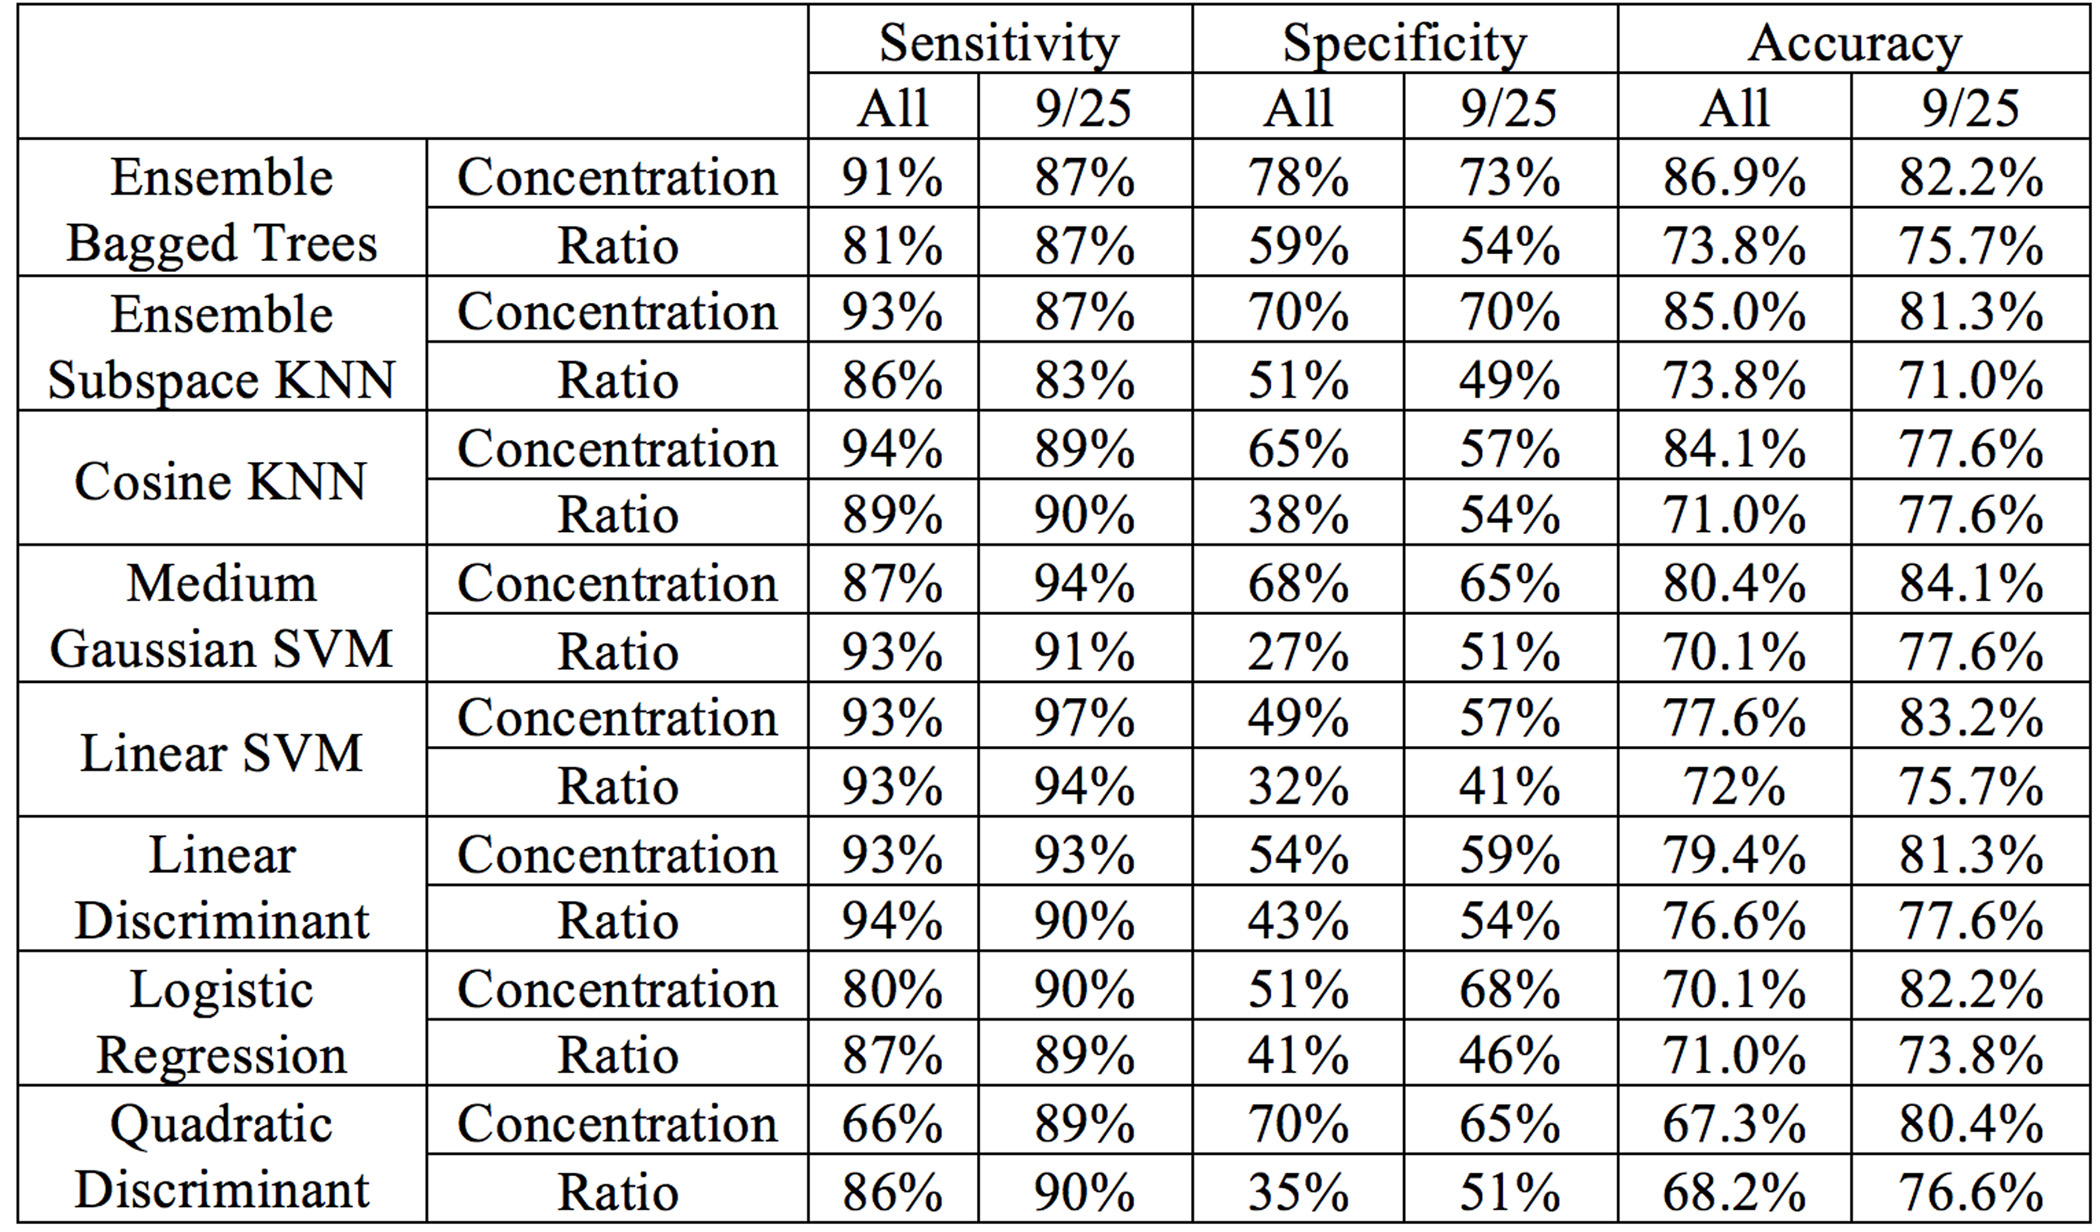
Figures 1 and 2 display short-TE MRS data along with the LCModel results of an IDH-mutant grade II oligodendroglioma and an IDH-wild type GBM, respectively. IDH-MUT patients had a statistically significantly lower GPC+PCh, Glu, Gln, Glu+Gln, GSH, and Glyc, and higher Ins and 2HG than IDH-WT patients (Table 1). Table 2 shows the sensitivity, specificity, and accuracy results of the classification algorithms for different feature sets. The sensitivity of detecting IDH mutation based on metabolite concentrations ranged between 66% (QDA, all features) to 97% (Linear SVM, 9/25 features). For metabolite/PCr+Cr ratios, the sensitivity values of detecting IDH mutation ranged between 81% (ensemble of bagged trees, all) and 94% (LDA, all or linear SVM, 9/25). The specificity of the classification algorithms was lower with a range of 49%-78% for metabolite concentrations and 27%-59% for metabolite/PCr+Cr ratios. The highest overall diagnostic accuracy of 86.9% (sensitivity= 91, specificity=78) was obtained for classification based on all metabolite concentrations by using an ensemble of bagged decision trees.DISCUSSION
IDH-mutant tumors displayed a less aggressive onco-metabolite profile based on MRS concentrations with higher Ins and 2HG and lower total choline, Lac, Glyc, GSH, Glu and Gln. The overall accuracy of the classification algorithms that were included in this study was better when concentrations instead of metabolite/PCr+Cr ratios were used as features. Additionally, using a selected subset of MRS based biomarkers as features resulted in a higher accuracy for most of the classification algorithms. Ensemble classification methods, which combine a set of classifiers by taking a weighted average of their predictions, outperformed the well-known classification algorithms like SVM and KNN. The classification algorithms that were implemented in this study had a high diagnostic accuracy for predicting IDH status.CONCLUSION
Short-echo time MR spectroscopic metabolite profile at 3T provides a fairly specific prediction of the IDH-mutation status in diffuse-gliomas. The identification of molecular profile of gliomas by noninvasive radiological methods might help in reducing or eliminating the need for uncomfortable and risky biopsy procedures.Acknowledgements
No acknowledgement found.References
1.Eckel-Passow JE, Lachance DH, Molinaro AM, Walsh KM, Decker PA, Sicotte H, Pekmezci M, Rice T, Kosel ML, Smirnov IV, Sarkar G, Caron AA, Kollmeyer TM, Praska CE, Chada AR, Halder C, Hansen HM, McCoy LS, Bracci PM, Marshall R, Zheng S, Reis GF, Pico AR, O'Neill BP, Buckner JC, Giannini C, Huse JT, Perry A, Tihan T, Berger MS, Chang SM, Prados MD, Wiemels J, Wiencke JK, Wrensch MR, Jenkins RB. Glioma Groups Based on 1p/19q, IDH, and TERT Promoter Mutations in Tumors. The New England journal of medicine 2015;372(26):2499-2508.
2.Choi C, Ganji SK, DeBerardinis RJ, Hatanpaa KJ, Rakheja D, Kovacs Z, Yang X-L, Mashimo T, Raisanen JM, Marin-Valencia I. 2-hydroxyglutarate detection by magnetic resonance spectroscopy in IDH-mutated patients with gliomas. Nature medicine 2012;18(4):624-629.
3.Andronesi OC, Kim GS, Gerstner E, Batchelor T, Tzika AA, Fantin VR, Vander Heiden MG, Sorensen AG. Detection of 2-hydroxyglutarate in IDH-mutated glioma patients by in vivo spectral-editing and 2D correlation magnetic resonance spectroscopy. Sci Transl Med 2012;4(116):116ra114.
4.Nagashima H, Tanaka K, Sasayama T, Irino Y, Sato N, Takeuchi Y, Kyotani K, Mukasa A, Mizukawa K, Sakata J, Yamamoto Y, Hosoda K, Itoh T, Sasaki R, Kohmura E. Diagnostic value of glutamate with 2-hydroxyglutarate in magnetic resonance spectroscopy for IDH1 mutant glioma. Neuro-Oncology 2016;18(11):1559-1568.
5.Shi J, Zuo H, Ni L, Xia L, Zhao L, Gong M, Nie D, Gong P, Cui D, Shi W, Chen J. An IDH1 mutation inhibits growth of glioma cells via GSH depletion and ROS generation. Neurological Sciences 2014;35(6):839-845.
6.Provencher SW. Automatic quantitation of localized in vivo 1H spectra with LCModel. NMR Biomed 2001;14(4):260-264.
Figures