4234
Metabolic imaging with Gallium-68 citrate PET and 3D MRSI in patients with glioma1Department of Radiology and Biomedical Imaging, University of California San Francisco, San Francisco, CA, United States, 2Department of Neurological Surgery, University of California San Francisco, San Francisco, CA, United States
Synopsis
This study evaluated the feasibility of using combined metabolic imaging methodologies, namely 3D lactate-edited proton magnetic resonance spectroscopic imaging and Gallium-68 citrate PET, in patients with glioma using a PET/MR scanner.
INTRODUCTION
Proton magnetic resonance spectroscopic imaging (1H-MRSI) and positron emission tomography (PET) have been proposed as methods for characterizing the spatial extent and metabolic properties of tumors. The recent development of integrated systems with PET and MR capabilities makes it possible to explore the value of combining data derived from these two metabolic methodologies in one examination, as well as simultaneously correlating high-resolution structural images with functional biochemical processes. The purpose of this study was to evaluate the feasibility of using this multimodal imaging approach in patients with glioma. The novel radiotracer used for the PET scan was Gallium-68 citrate (68Ga-citrate), which has the ability to detect mTOR-driven tumor cells [1-3].METHODS
Eleven patients (5F/6M; age = 47±10 y/o) were studied using a SIGNA PET/MR scanner (GE Healthcare). Four patients had a diagnosis of grade 3 glioma (two oligodendrogliomas, and two astrocytomas), and seven had grade 4 glioma. The median (range) dosage of administered to these subjects was 6.9 (5.6-10.2) mCi and imaging data were obtained 4 (2-5) hours post injection. PET data were acquired for up to 60 minutes. The MR examination was performed concurrently, and included pre- and post-contrast T1-weighted spoiled gradient echo, T2-weighted fluid attenuated inversion recovery, and 3D lactate-edited 1H-MRSI data. The 1H-MRSI data were obtained using CHESS water suppression, VSS outer volume suppression and PRESS volume selection with TE/TR=144/1250ms, spectral array=18x18x16 and nominal spatial resolution=1cm3. Flyback trajectories were applied in the S/I dimension to speed up the total acquisition time (~10 min). The 3D spectral data were combined, processed and quantified as described previously [4,5]. PET raw data was reconstructed and expressed as standardized uptake values (SUV). A positive lesion on 68Ga-citrate PET was defined as a focus of activity with at least 1.5 times higher SUV compared with a contralateral region of normal brain. The maximum SUV (SUVmax) was calculated for each lesion.RESULTS/DISCUSSION
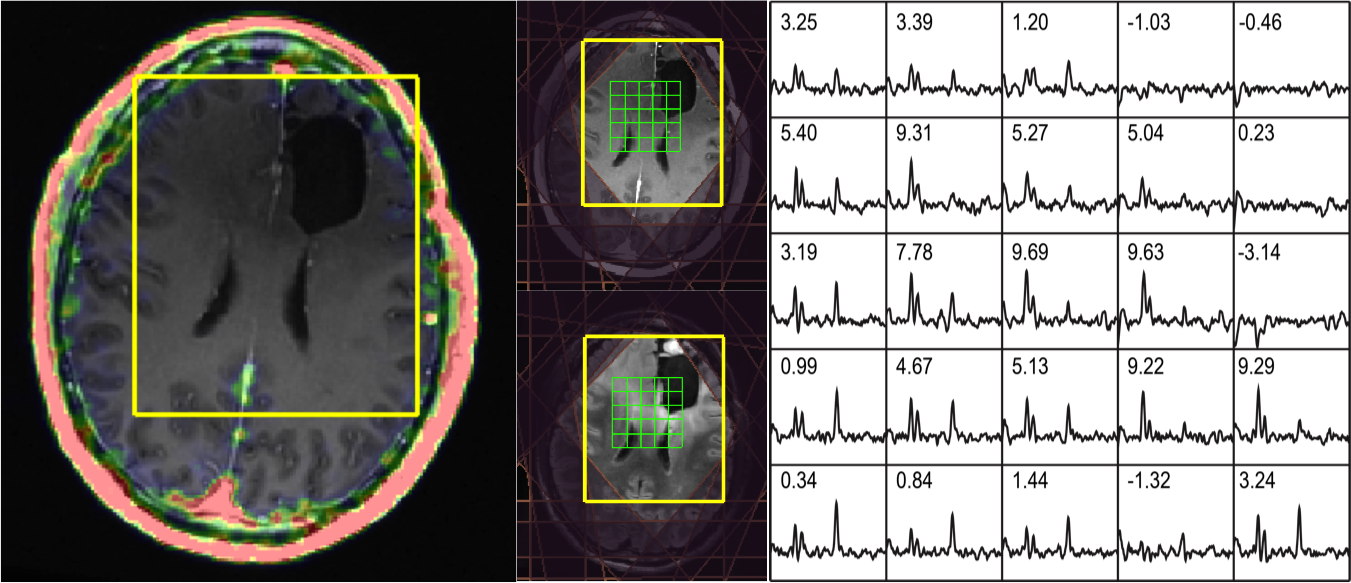
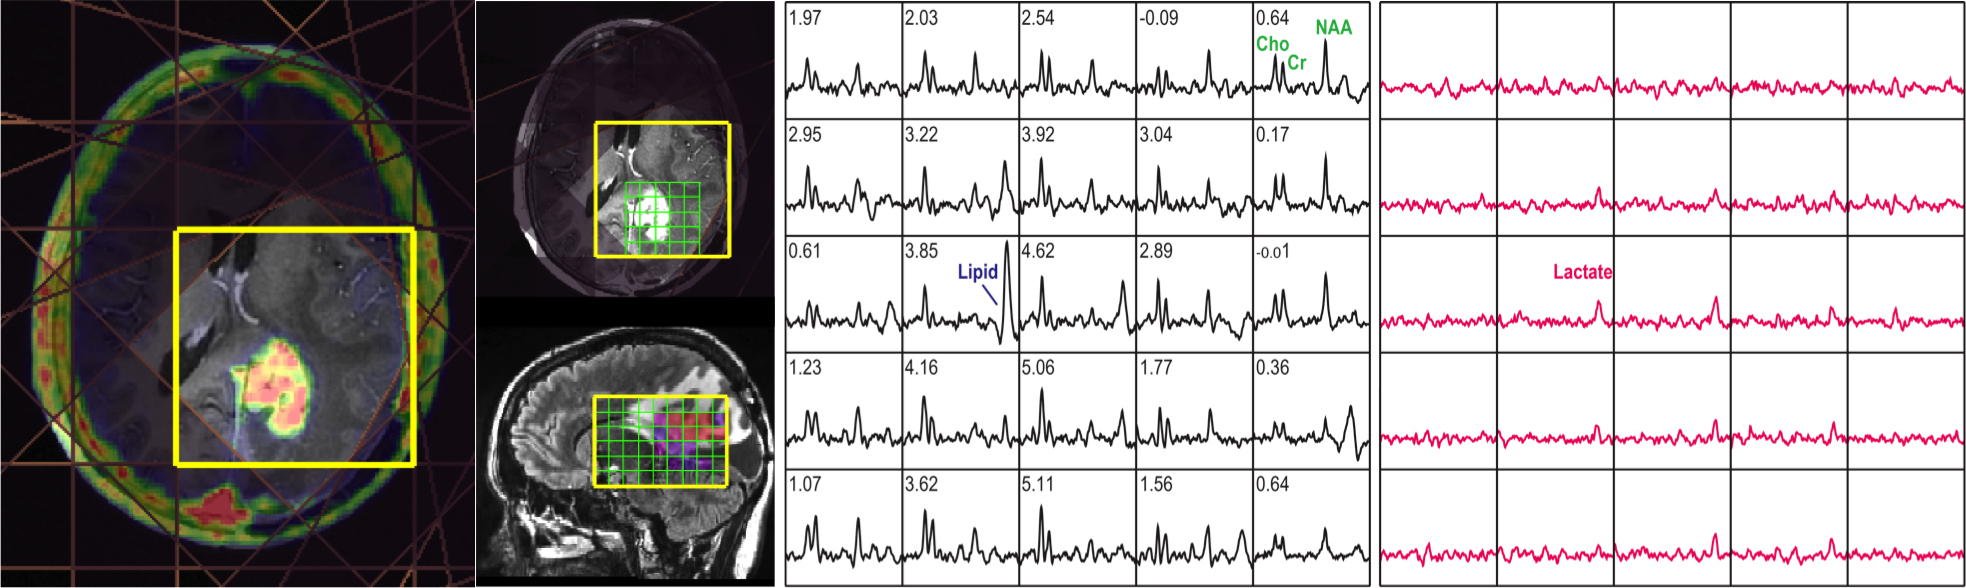
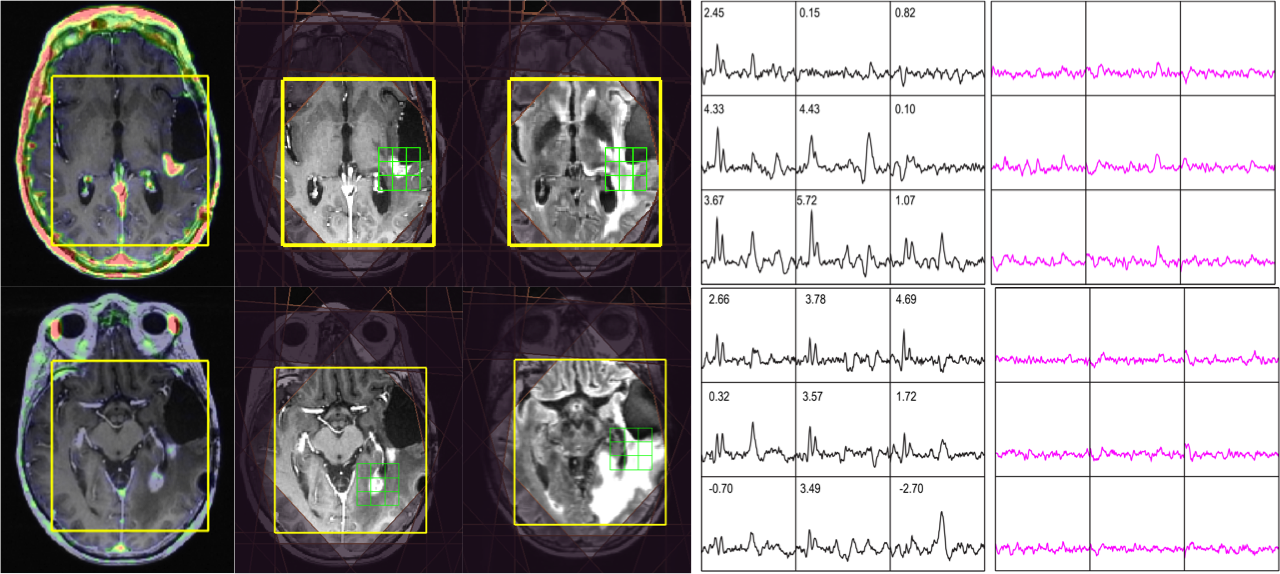
68Ga-citrate uptake in normal appearing white matter was extremely low with the median (range) of the SUVmax being 0.02 (0.001-0.1). This resulted in high contrast between tumor compared with surrounding brain. No 68Ga-citrate uptake was detected in patients with regions of non-enhancing glioma (Figure 1), and not all enhancing lesions were avid for the radiotracer (Figure 2 and 3). This suggests that 68Ga-citrate could distinguish between enhancing lesions that had different underlying biochemical properties. The spatial extent of the MR metabolic lesion was defined by voxels that had choline-to-NAA index (CNI) >2. This has been shown to be more sensitive in differentiating tumor from non-tumor than individual metabolites [6]. The volumes of the region with CNI>2 were larger than the volume of the enhancing lesion and, in many cases, also extended beyond non-enhancing regions of hyperintensity on the corresponding T2 images (Figure 1-3). This implies the PET and MR metabolic imaging methodologies reflect different biochemical aspects of tumors. A total of 14 lesions were detected using PET imaging with SUVmax of 1.95 (0.3,3.7). It was noted that relatively high uptake in the cerebral venous system (3.70 (2.5-5.1)) may cause difficulty in differentiating tumors from veins when they are in close proximity. In Figure 3, the lesion observed in the lower slice, where B0 homogeneity was difficult to achieve using the linear shimming gradients on the PET/MR, had relatively larger linewidth. Evaluating patients who are going to receive surgical resection and/or serially studying changes in metabolic profiles will assist in further understanding the complementary relationship between 68Ga-citrate PET and 3D lactate-edited MRSI.CONCLUSION
This study has established a robust protocol for acquiring complementary metabolic imaging data using PET and MR methodologies that is likely to be important for resolving ambiguities in anatomic imaging and in evaluating response to therapy for patients with glioma.Acknowledgements
This research was supported by NIH R01CA127612 and M.J.E. was supported by the 2013 David H. Koch Young Investigator Award from the Prostate Cancer Foundation, the National Institutes of Health (R00CA172695, R01CA17661), a Department of Defense Idea Development Award (PC140107), the UCSF Academic Senate, and GE Healthcare.References
[1] Larson SM, Rasey JS, Allen DR, et al. Common pathway for tumor cell uptake of gallium-67 and iron-59 via a transferrin receptor. J Natl Cancer Inst. 1980;64:41-53.
[2] O’Donnell KA, Yu D, Zeller Kl, et al. Activation of transferrin receptor 1 by c-Myc enhances cellular proliferation and tumorigenesis. Mol Cell Biol 2006; 26:2373-86.
[3] Galvez T, Teruel MN, Heo D, et al. siRNA screen of the human signaling proteome identifies the PtdIns(3,4,5)P3-mTOR signaling pathway as a primary regulator of transferrin uptake. Genome Biol 2007; 8:R142.
[4] Nelson SJ. Analysis of volume MRI and MR spectroscopic imaging data for the evaluation of patients with brain tumors. Magn Reson Med 2001;46:228–239.
[5] Li Y, Osorio JA, Ozturk-Isik E, et al. Considerations in applying 3D PRESS H-1 brain MRSI with an eight-channel phased-array coil at 3 T. Magn Reson Imaging. 2006;24:1295 – 1302.
[6] McKnight TR, Noworolski SM, Vigneron DB, Nelson SJ. An automated technique for the quantitative assessment of 3D-MRSI data from patients with glioma. J Magn Reson Imaging. 2001; 13-167-177.
Figures