4232
RAFF, T1ρ and T2ρ mapping of human gliomas: association with IDH mutation, 1p19q co-deletion and Ki671Turku PET Centre, University of Turku, Turku, Finland, 2Department of Information Technology, University of Turku, Turku, Finland, 3Medical Imaging Centre of Southwest Finland, Turku University Hospital, Turku, Finland, 4Department of Diagnostic Radiology, University of Turku, Turku, Finland, 5Department of Pathology, University of Turku and Turku University Hospital, Turku, Finland, 6Division of Clinical Neurosciences, Department of Neurosurgery, Turku University Hospital, Turku, Finland, 7Department of Biotechnology and Molecular Medicine, A.I. Virtanen Institute for Molecular Sciences, University of Eastern Finland, Kuopio, Finland, 8Diagnostic Imaging Center, Kuopio University Hospital, Kuopio, Finland, 9Department of Oncology and Radiotherapy, Turku University Hospital, Turku, Finland
Synopsis
Our aim was to study the feasibility of quantitative RAFF, T1ρcw, T1ρadiab and T2ρadiab imaging for the first time in human gliomas and to assess their ability to differentiate gliomas with specific genetic profile. FLAIR lesion segmentation and histogram analysis from parametric maps were applied. Both IDH mutated and 1p19q codeleted gliomas demonstrated a tendency for lower relaxation values compared to IDH wild-type and 1p19q intact gliomas, respectively. Additionally, T2ρ, adiab significantly correlated to Ki-67 and tumor aggressiveness. We conclude that RAFF, T1ρcw, T1ρadiab and T2ρadiab imaging of gliomas is feasible and carry a potential for improving non-invasive glioma characterization.
PURPOSE
Imaging genetic features in gliomas is of great clinical importance since the new 2016 WHO classification of gliomas is primarily based on molecular markers (1). IDH mutation and 1p19q co-deletion are the two most important molecular markers predicting longer survival and distinguishing oligodendrogliomas from other diffuse astrocytomas, respectively. The purpose of this study was to evaluate the feasibility of spin locking methods performed using continuous wave pulse (T1ρcw), adiabatic T1ρ (T1ρadiab), adiabatic T2ρ (T2ρadiab) and Relaxation Along a Fictitious Field (RAFF) mapping in differentiating gliomas with these genetic features. These novel MR techniques have shown to be effective in the assessment of treatment response in animal gliomas treated with gene therapy. In addition, RAFF has demonstrated strong correlation to tumor cell density in preclinical studies. (2,3) To the best of our knowledge, this is the first study to apply these MR techniques in human gliomas.METHODS
The study was approved by the local ethics committee. MRI examinations were performed using a clinical 3T system (Ingenuity PET/MR, Philips) and a 32 channel head coil. In total, 20 patients with primary glioma were enrolled prior to tumor resection. Four scans were excluded due to artifacts resulting in 16 patients included in the final analysis (diffuse astrocytomas 4 IDH-mutant and 2 IDH wild-type, 5 oligodendrogliomas 1p19q co-deleted and IDH-mutant, 5 glioblastomas IDH wild-type). Molecular profiles and Ki-67 proliferation index were evaluated from tissue specimens obtained during the resection. Following parameters for RAFF, T1ρcw, T1ρadiab and T2ρadiab were used: 1.25x1.25x2.5mm resolution, 24 slices and 30° flip angle. Total scan time to acquire one weighting was 2min 15sec.
T1ρ contrasts (4) were generated using on-resonance pulses (hyperbolic secant (HS) or block pulses) of varying number or length. T1ρcw block pulse peak amplitude was 500Hz and pulse train durations of 40 or 80ms were used. HS pulse peak amplitude was 575Hz and 4 or 8 HS pulses were used (5,6) to generate T1ρadiab or T2ρadiab (7,8) contrasts. Relaxation along a fictitious field (RAFF) contrast was generated using amplitude and frequency modulated pulses (9,10). A second-order rotating frame (RAFF2) was performed using RF peak amplitude 500 Hz (corresponding to 11.74µT), with pulse train durations of 45.28ms and 90.56ms. RF shimming was performed to allow uniform excitation field across whole brain.
The imaging data were post-processed and analyzed using FSL (www.fmrib.ox.ac.uk/fsl) and in-house developed python and C++ code. FSL and ANTs toolkit (http://stnava.github.io/ANTs) were used to co-register all imaging modalities to FLAIR images. RAFF, T1ρcw, T1ρadiab, and T2ρadiab decay curves were fitted with Broyden–Fletcher–Goldfarb–Shanno algorithm implemented in the dlib C++ library (11). High intensity regions in FLAIR images were automatically segmented with the process described in (12). Tumor region was selected from segmented areas manually with 1-2 voxel erosion. Relaxation values were analyzed with statistical descriptors of 10th, 25th, 50th, 75th, 90th percentiles, kurtosis, skewness, and the mean calculated from voxels in glioma ROI. Student’s t-test was applied for group comparisons and Spearman’s rho for correlation between Ki-67 and relaxation values.
RESULTS
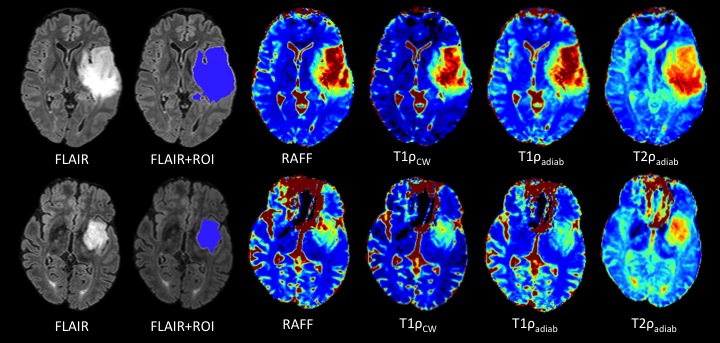
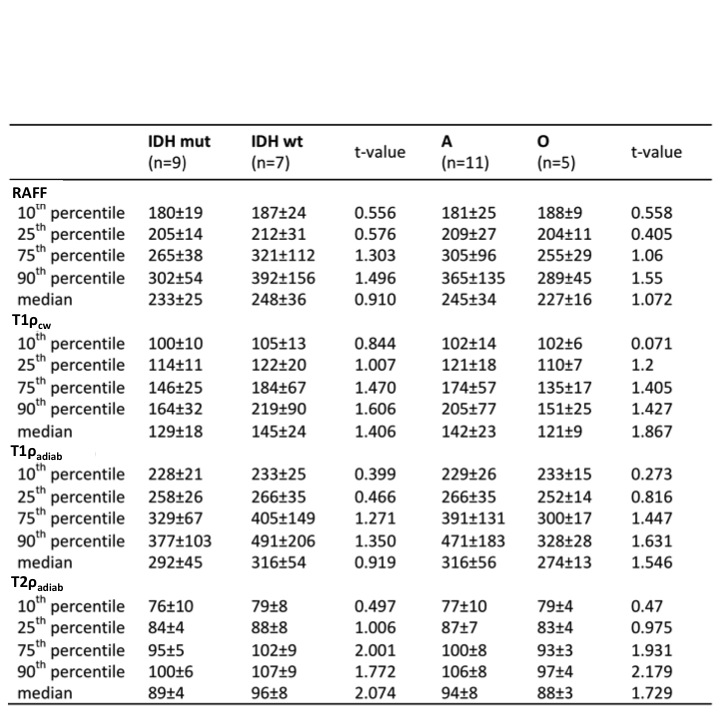
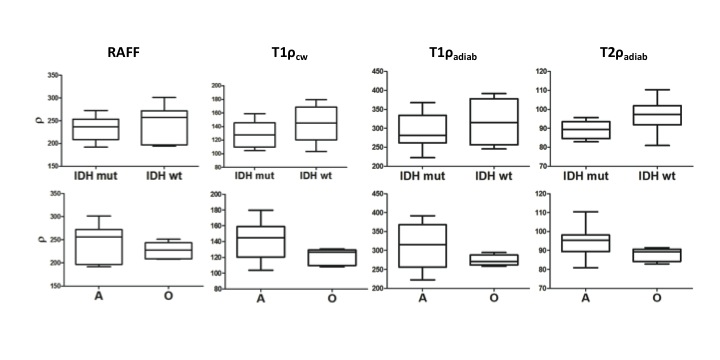
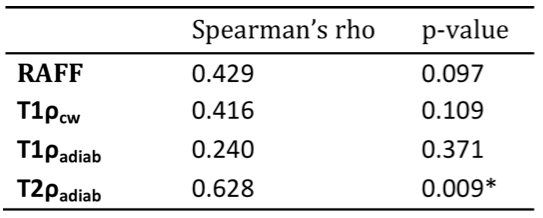
RAFF, T1ρcw, T1ρadiab and T2ρadiab demonstrated good tissue contrast between glioma and normal brain tissue as presented in Figure 1. Four frontally located gliomas were excluded from the final analyses due to artifacts noted especially in the frontal lobes. Whole tumor histogram analysis indicated lower values both in IDH mutant compared to IDH wild-type gliomas, and 1p19q codeleted oligodendrogliomas compared to 1p19q intact astrocytomas (Table 1, Figure 2). These group differences were highest, though statistically not significant, with the median, 75th and 90th percentiles across the sequences with the most prominent difference noted in T2ρadiab. Additionally, significant correlation was observed for Ki-67 proliferation index and T2ρadiab median, 75th and 90th percentiles (Table 2).DISCUSSION
Our preliminary study demonstrates the feasibility of quantitative RAFF, T1ρcw, T1ρadiab and T2ρadiab imaging in human gliomas. We used whole tumor FLAIR lesion segmentation and histogram analysis to differentiate gliomas according to their IDH gene and 1p19q chromosomal status. Though statistically not significant, we found a tendency for lower relaxation values both in IDH mutated gliomas and 1p19q codeleted oligodendrogliomas when compared to IDH wild-type gliomas and astrocytomas with intact 1p19q, respectively. Additionally, Ki-67 proliferation index significantly correlated to T2ρadiab median, 75th and 90th percentiles indicating a connection between tumor aggressiveness and these MR parameters.CONCLUSION
Spin lock imaging of gliomas using a clinical 3T MRI scanner was demonstrated. Our initial results indicate potential of these methods to improve non-invasive glioma characterization.Acknowledgements
This study was supported by Finnish Cultural Foundation and Southwest Finland Hospital District (EVO research funding).References
[1] Louis DN, Perry A, Reifenberger G, et al. The 2016 World Health Organization Classification of Tumors of the Central Nervous System: a summary. Acta Neuropathol. 2016;131:803-820.
[2] Liimatainen T, Sierra A, Hanson T, et al. Glioma Cell Density in a Rat Gene Therapy Model Gauged by Water Relaxation Rate Along a Fictitious Magnetic Field. Magn Reson Med. 2012;67:269-277.
[3] Sierra A, Michaeli S, Niskanen JP, et al. Water Spin Dynamics During Apoptotic Cell Death in Glioma Gene Therapy Probed by T1ρ and T2ρ. Magn Reson Med. 2008;59:1311-1319.
[4] Sepponen RE, Pohjonen JA, Sipponen JT, Tanttu JI. A method for T1 rho imaging. J Comput Assist Tomogr. 1985;9(6):1007-11.
[5] Gröhn H, Michaeli S, Garwood M, Kauppinen R, Gröhn O. Quantitative T(1rho) and adiabatic Carr-Purcell T2 magnetic resonance imaging of human occipital lobe at 4 T. Magn Reson Med. 2005;54(1):14-9.
[6] Mangia S, Carpenter AF, Tyan AE, Eberly LE, Garwood M, Michaeli S. Magnetization transfer and adiabatic T1ρ MRI reveal abnormalities in normal-appearing white matter of subjects with multiple sclerosis. Mult Scler. 2014;20(8):1066-73.
[7] Michaeli S, Gröhn H, Gröhn O, et al. Exchange-influenced T2rho contrast in human brain images measured with adiabatic radio frequency pulses. Magn Reson Med. 2005;53(4):823-9.
[8] Bartha R, Michaeli S, Merkle H, et al. In vivo 1H2O T2+ measurement in the human occipital lobe at 4T and 7T by Carr-Purcell MRI: detection of microscopic susceptibility contrast. Magn Reson Med. 2002;47(4):742-50.
[9] Liimatainen T, Sorce DJ, O'Connell R, Garwood M, Michaeli S. MRI contrast from relaxation along a fictitious field (RAFF), Magn Reson Med. 2010;64(4):983-94.
[10] Liimatainen T, Mangia S, Ling W, et al. Relaxation dispersion in MRI induced by fictitious magnetic fields. Magn Reson Med. 2011;209(2):269-276.
[11] Artzi M, Aizenstein O, Jonas-Kimchi T, Myers V, Hallevi H, Bashat D. FLAIR lesion segmentation: Application in patients with brain tumors and acute ischemic stroke. Eur J Radiol. 2013 82(9):1512-1518.
[12] King DE. Dlib-ml: A machine learning toolkit. The J Mach Learn Res 2009;10:1755-1758.
Figures