4230
Measuring Alanine in Schizophrenia using 2D Correlation Spectroscopy1Center for Clinical Spectroscopy, Brigham and Women’s Hospital, Boston, MA, United States, 2Department of Anesthesiology, Perioperative and Pain Medicine, Boston Children’s Hospital and Harvard Medical School, Boston, MA, 3Laboratory of Neuroscience, Veterans Affairs Boston Healthcare System, Boston, MA
Synopsis
Degree of schizophrenia (SZ) was determined by phase-locking factor (PLF) acquired through an electroencephalogram (EEG). Correlation spectroscopy (COSY) spectra of the chronic SZ patients and age-matched healthy controls were then compared. A significant difference (p < 0.05) between SZ and controls was found in the concentrations of alanine supported by a strong correlation between PLF and alanine levels. These results suggest further studies to examine alanine as a potential biomarker for schizophrenia.
Purpose
Schizophrenia is a mental disorder characterized by abnormal social behavior and failure to understand what is real and is often accompanied by additional mental health problems1. Its causes include genetic and environmental factors2. 0.3-0.7% of people are affected by SZ, with males affected more often than females1,3. In 2013, there were about 23.6 million cases globally4. Proton magnetic resonance spectroscopy (1H MRS) is an accurate, non-invasive imaging method for measurement of metabolites in a region of interest in the brain5. The 2-dimensional correlation spectroscopy (COSY) pulse sequence utilizes a second spectral dimension that allows for identification of metabolites that otherwise overlap in a traditional 1D spectrum6, giving it an advantage over spectral editing methods such as MEGA-PRESS sequence, whose detection is limited to gamma-aminobutyric acid (GABA), glutamine and glutamate (Glx), and N-acetylaspartate (NAA).
Neural oscillations, which can be measured with an EEG, are a mechanism for sensory, attentional, and motor processes7. An EEG can measure these oscillations in the form of phase-locking factor (PLF) to the auditory steady state response (ASSR), which is a measure of the degree of normal functioning as measured by oscillations generated in the auditory system, especially the left superior temporal gyrus and Heschl gyrus. Patients with SZ have typically demonstrated a deficit in PLF as measured in the gamma band (~40 Hz)8. Previous studies from this lab have demonstrated a strong correlation between GABA and glutamate levels and PLF in schizotypal personality disorder and chronic schizophrenics9. However, other metabolites have not been explored in this context.
Methods
Male subjects with SZ (n = 5; ages: 48.6 ± 8.3 years) and male healthy controls (n = 4; ages: 47.8 ± 5.4 years) were recruited and consented under local IRB approval. An EEG was conducted to acquire PLF-left paracentral, left temporal PLF, and left auditory steady-state response (ASSR). The left temporal PLF was used as a translational biomarker for SZ7.
Single-voxel PRESS (TE: 30 ms, TR: 2 s, voxel size: 40 x 20 x 20, 64 averages) and 2D COSY (starting TE: 68 ms, TR: 1.5 s, 64 t1 increments of 0.8 ms, 8 averages per increment, and 1024 data points) were acquired on a 3T MRI (Siemens Verio) using a 32-channel array head coil. MRS was performed for these patients on the left and right superior temporal gyri. Raw data was brought offline for processing usinf LCmodel for PRESS data and FELIX Version 2007 (Accelrys) for COSY data. FELIX was used to identify peaks representing metabolites of interest, including alanine, lysine, threonine, lactate, and a macromolecule on the diagonal around 1.3-1.5 ppm using pre-defined chemical shifts10. Region-of-interest voxels were placed on peaks to measure metabolite concentrations. PLF values were compared with various metabolite concentrations, as quantified with COSY, to discover a possible correlation between PLF and the concentration of one of these COSY-measured metabolites.
Results
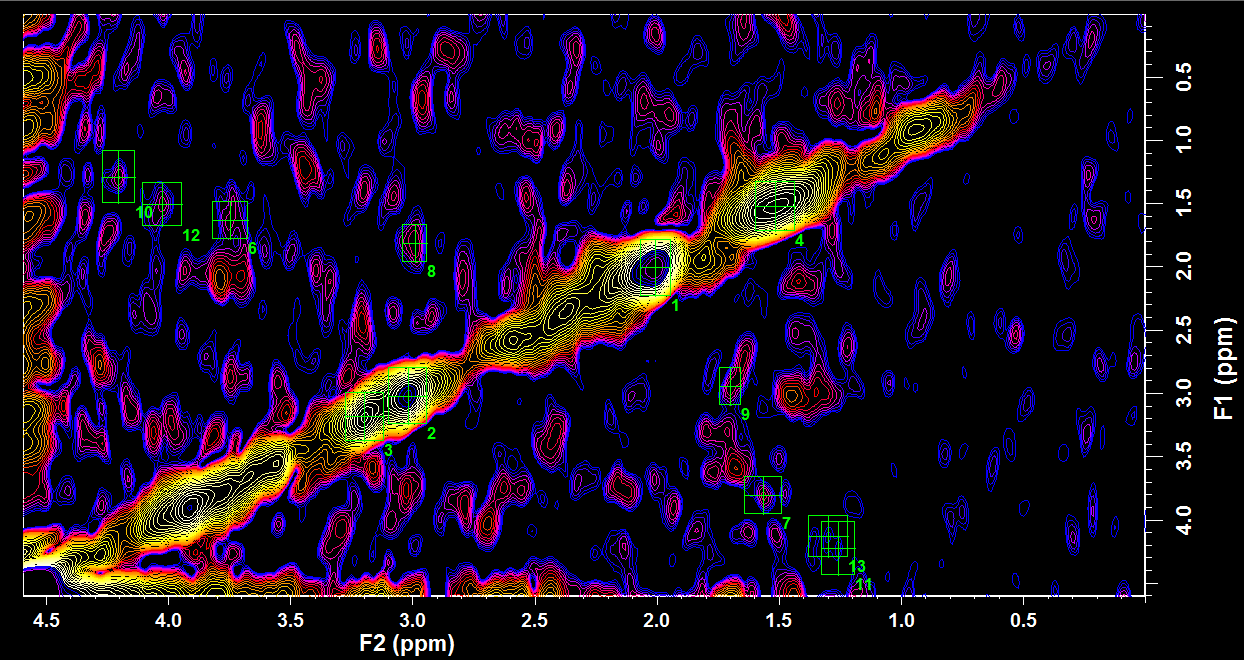
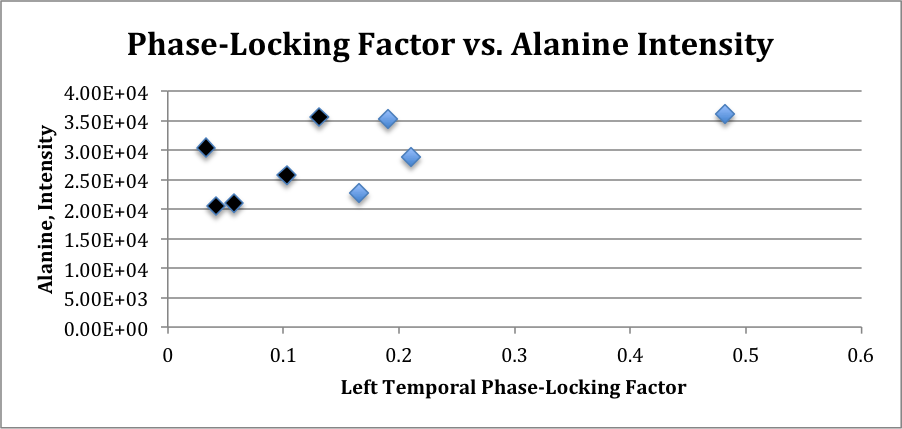
LCModel could not adequately quantify alanine, lysine, threonine, and lactate due to their significant overlap (Cramer-Rao lower bound > 30%). Representative 2D COSY reconstruction is shown in Figure 1 with the regions of interested selected for each of the different metabolites. We tested the association between PLF and various ranked variables, including alanine, lysine, threonine, and lactate. Significant correlation was found using Spearman rank correlation between PLF and intensity (representing peak height) of alanine (Figure 2). Performing a Spearman rank correlation enables one to see if these variables covary. The only metabolite with a significant correlation with PLF was alanine: ρ = 0.617 with df = 7 and 0.05 > p > 0.025.Discussion/Conclusion
The results demonstrate that there is a statistically significant correlation between PLF and alanine. Alanine has been shown to act as an NMDA receptor agonist by binding to its glycine site, thus promoting glutamatergic activity9. Plasma levels of alanine have been shown to be correlated to clinical symptoms of schizophrenia as well as with NMDA activity11. Thus, alanine is a notable metabolite that can indicate a schizophrenic brain and can be most adequately measured by correlated spectroscopy. Future studies should be explore this metabolite in more detail.
Acknowledgements
Funding for this study was provided by the Brigham Research Imaging Core and the VA Merit Award (2 I01 CX000157-06A1).References
1. World Health Organization, April 2016, Schizophrenia, Fact Sheet, viewed 04 November 2016, <http://www.who.int/mediacentre/factsheets/fs397/en/>.
2. Owen MJ, Sawa A, Mortensen PB. Schizophrenia. The Lancet. 2016:388(10039):86-97.
3. van Os J, Kapur S. Schizophrenia. The Lancet. 2008:374(9690):635-645.
4. Vos, Theo et al. Global, regional, and national incidence, prevalence, and years lived with disability for 301 acute and chronic diseases and injuries in 188 countries, 1990–2013: a systematic analysis for the Global Burden of Disease Study 2013. The Lancet. 2015:386(9995):743-800.
5. Port, J. D., Agarwal, N. MR spectroscopy in schizophrenia. J. Magn. Reson. Imaging. 2011:34(6):1251-1261.
6. Ramadan, S. et al. Use of in Vivo Two-dimensional MR Spectroscopy to Compare the Biochemistry of the Human Brain to That of Glioblastoma. Radiology. 2011:259(2):540-549.
7. O'Donnell BF, Vohs JL, Krishnan GP, et al. The Auditory Steady-State Response (ASSR): A Translational Biomarker for Schizophrenia. Supplements to Clinical neurophysiology. 2013:62:101-112.
8. Hirano, Yoji et al. Spontaneous Gamma Activity in Schizophrenia. JAMA Psychiatry. 2015:72(8);813-821.
9. Lin AP, Merugumala S, Liao HJ, et al. GABA and Glutamate abnormalities in the superior temporal gyrus and their association with electrophysiological abnormalities in schizotypal personality disorder and schizophrenia. Proc Int Soc Magn Reson Med. 2013.
10. Govindaraju V, Young K, Maudsley AA. Proton NMR chemical shifts and coupling constants for brain metabolites. NMR Biomed. 2000 May;13(3):129-53. Erratum in: NMR Biomed. 2015 Jul;28(7):923-4. 11. Hatano T, Ohnuma T, Sakai Y, et al. Plasma alanine levels increase in patients with schizophrenia as their clinical symptoms improve-Results from the Juntendo University Schizophrenia Projects (JUSP). Psychiatry Res. 2010:177(1-2):27-31.
Figures