4224
Detailed T1-weighted laminar profiles from the human cortex measured in vivo at 3T and validated at 7T1Psychiatry, UMC Utrecht, Utrecht, Netherlands, 2Radiology, UMC Utrecht, Utrecht, Netherlands, 3Experimental Psychology, Utrecht University, Utrecht, Netherlands, 4CNSR, Psykiatrisk Center Glostrup, Glostrup, Denmark
Synopsis
Patients with schizophrenia show cortical gray matter thinning but it is unknown whether all six cortical layers are implicated or that specific layers are affected. Knowing which layers are involved gives more insight in the underlying pathophysiological processes of schizophrenia. Here we present a method to compute detailed laminar profiles per brain area from conventional 3T T1-weighted scans, which can be used to obtain information on relative layer organization. We validate this method by comparing average profiles computed from conventional 3T scans to profiles computed from high resolution scans, acquired at ultra-high field MRI (7T).
Purpose
Structural MRI studies into psychiatric diseases often report on brain regions with a thinner cortical mantle. In patients with schizophrenia, this occurs primarily in frontal and temporal areas [1]–[3]. Typically, these large-scale studies (needed because of the small effect sizes) use MRI scans acquired at conventional strength (e.g. 3T). Because of the limited spatial resolution, standard cortical thickness analysis cannot determine which of the cortical layers is affected when thinning is observed. One solution is to use ultra-high field strength MRI (e.g. 7T), which allows acquisition of scans at a higher resolution. However, scanning large groups of subjects at ultra-high field strength poses a challenge because of the limited availability of 7T scanners.
Here we propose a new method that processes regular 3T T1-weighted images to compute one detailed laminar profile per brain area. As the T1-weighted intensity value is largely correlated with local myelin content [4], this method provides a way to approach the imaging of layers on the basis of myeloarchitecture. These profiles may then be used in group analyses to infer the relative contribution of the individual layers to cortical thinning. We validate the method by comparing laminar profiles computed for the primary visual cortex (V1) from T1-weighted scans acquired at 3T with myelin-sensitive T1-weighted 7T scans (a scan sequence that was previously validated with histology [5]).
Methods
Three healthy volunteers were scanned at 3T and 7T (Philips Achieva, Best, Netherlands). The 3T T1-weighted scan was obtained with an 8-channel head coil, and a 3D MPRAGE sequence (number of excitations per inversion 180; TR/TE 10 ms/4.6 ms; flip-angle 8°; FOV 240x240x160 mm; 200 slices, 0.8 mm isotropic voxel size; scan duration 602 s). 7T myelin-sensitive T1-weighted scans were acquired using a 3D MPRAGE sequence optimised for intra-cortical myelin [4] (number of excitations per inversion 300; TR/TE 7.5 ms / 3.5 ms; flip-angle 8°; inversion time 1200 ms; voxel size 0.5 mm isotropic; time delay between inversion pulses 6000 ms; FOV 200x250x180; SENSE 2.5 (anterior-posterior) x 2.5 (right-left); 360 slices; single scan duration 446.3 s, 3 scans). The 7T scans were aligned and averaged to increase SNR and divided by an additionally acquired proton density scan (voxel size 1.0 mm isotropic, TR/TE 5.7 ms / 2.8 ms; flip angle 1°; FOV 200x250x190; SENSE 1.8 (anterior-posterior) x 1.8 (right-left); 190 slices; scan duration 49 s) to increase signal homogeneity.
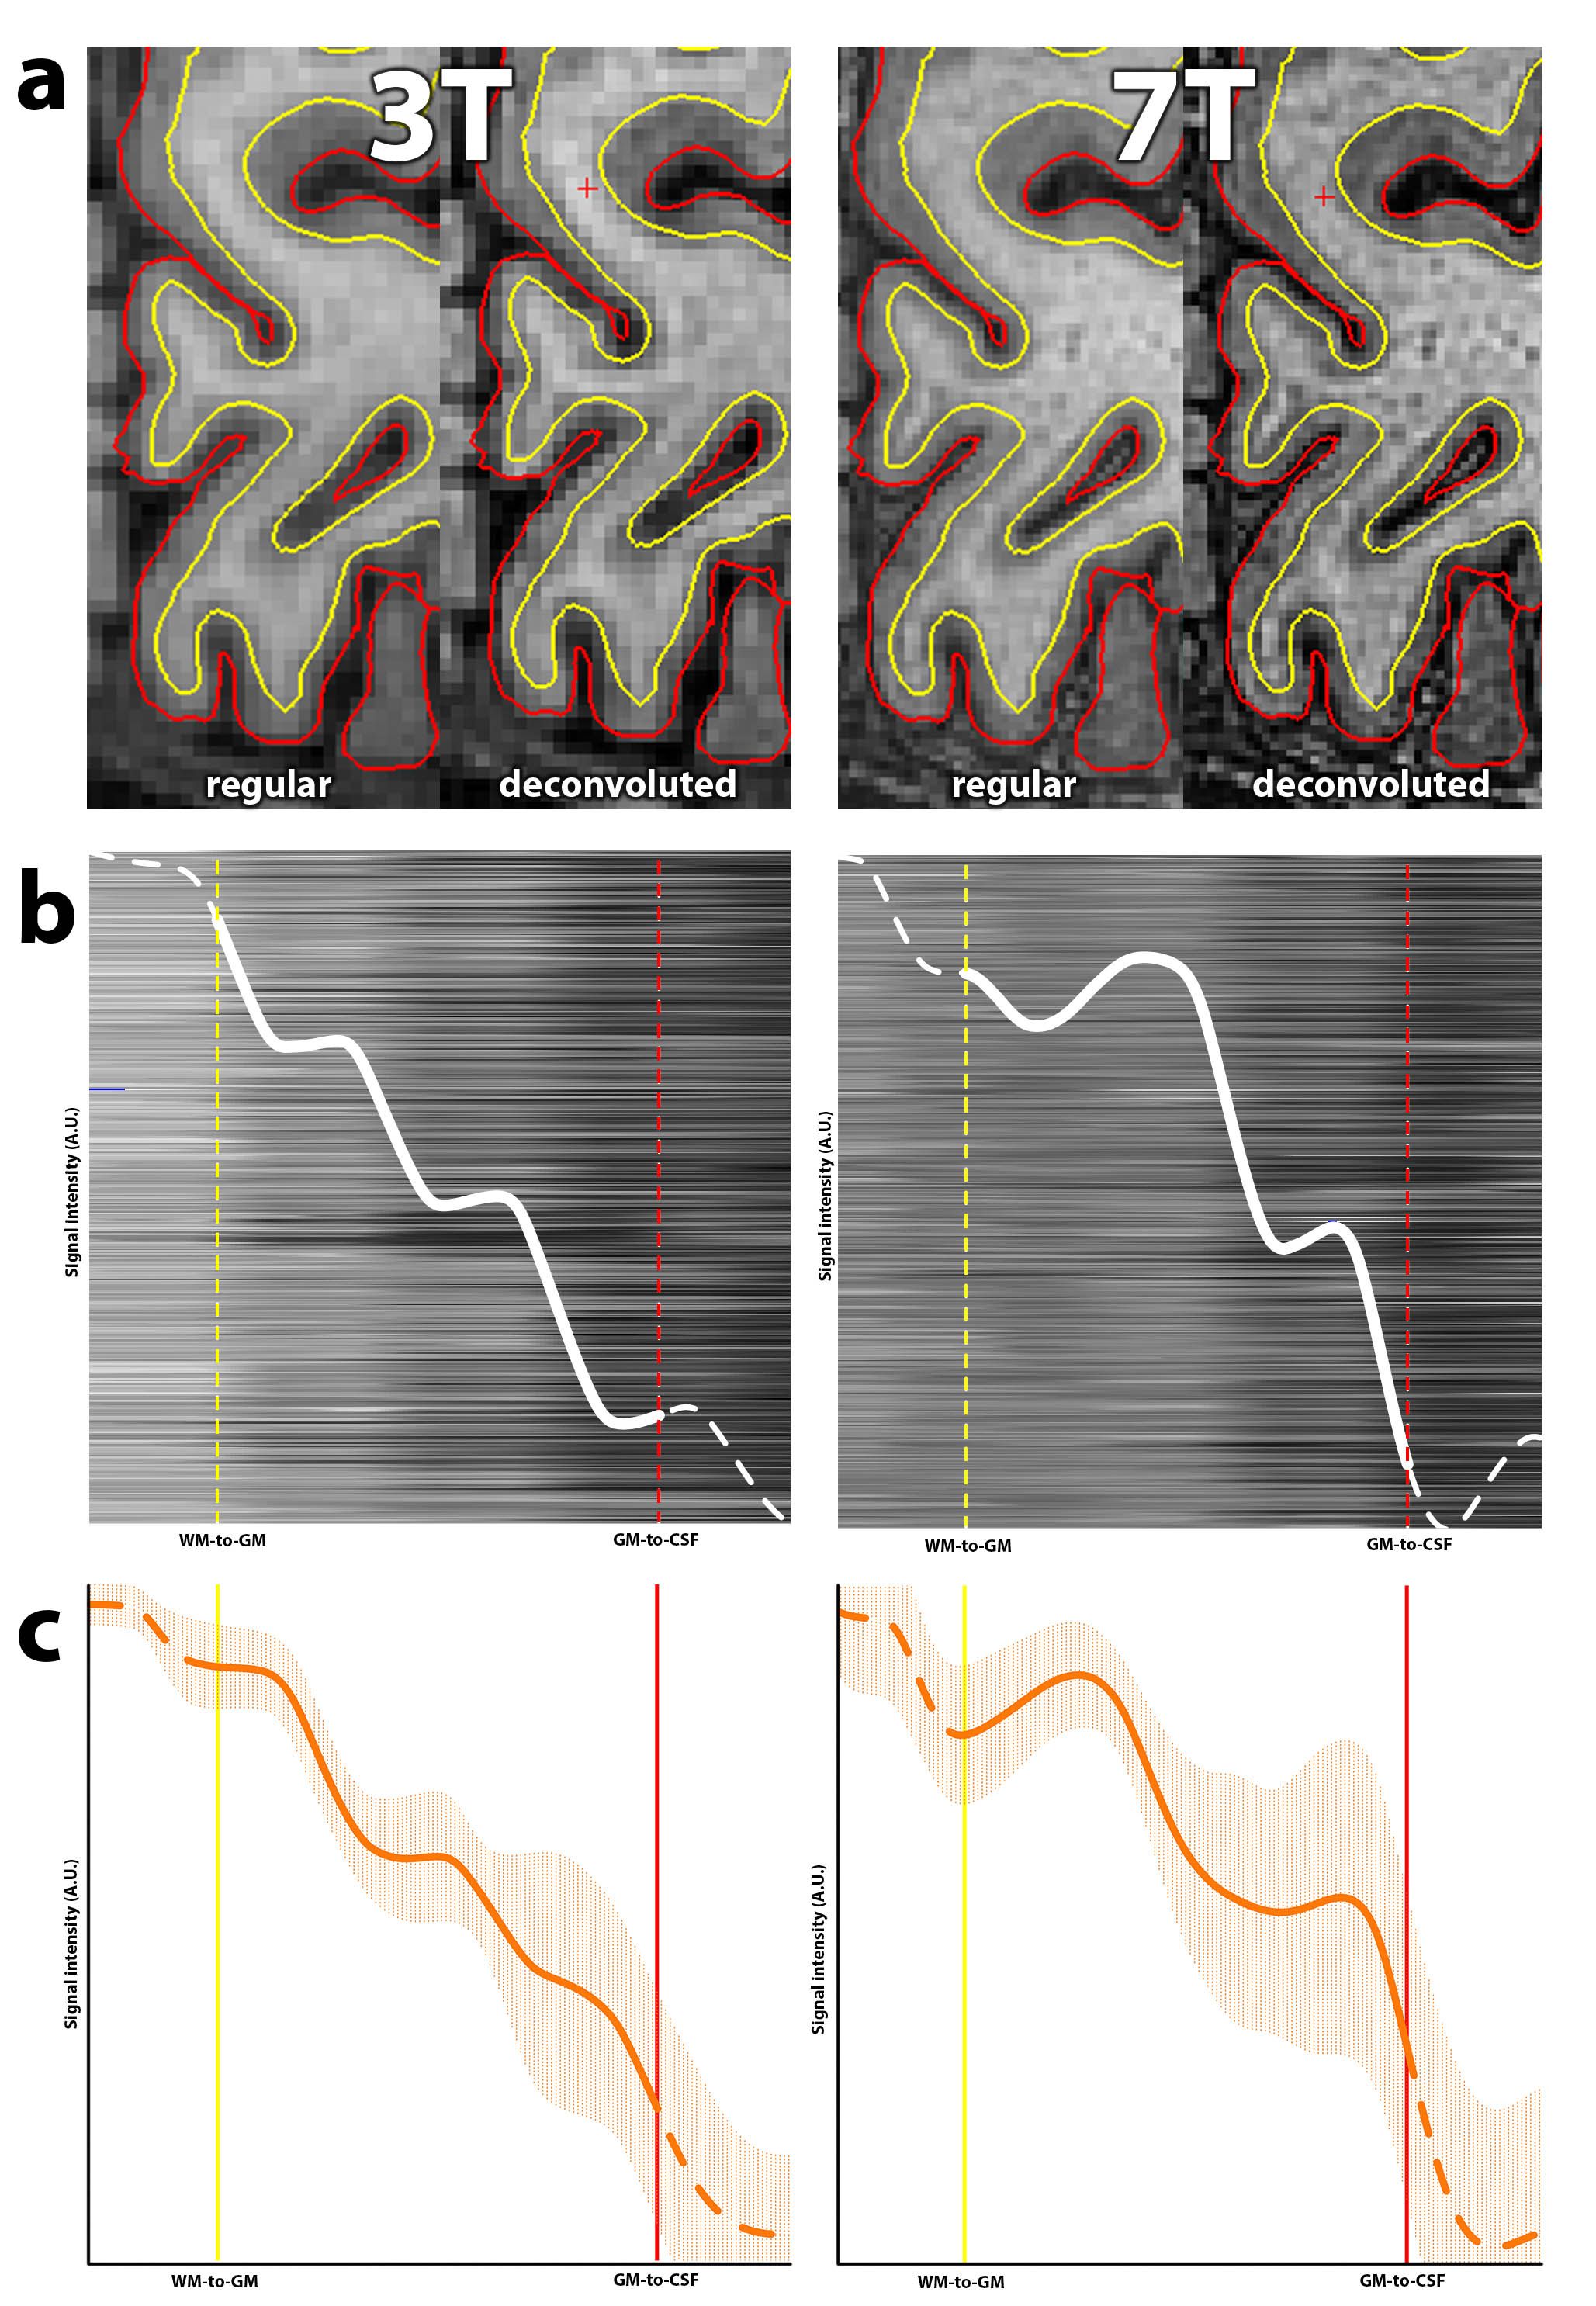
FreeSurfer was used to compute the gray and white matter surfaces [6] from the 3T scan. The 7T scan was registered to the 3T scan using ANTs [7] in order to use the same surface files for both volumes. V1 was determined using a standard atlas [8], [9]. Deconvolution was applied to both 3T and 7T scans (5-voxel FWHM Gaussian PSF; 3D-parallel iterative deconvolution toolbox in FIJI [10]; Fig 2a). Deconvolution increases detail at the expense of a loss in signal to noise (SNR). Hereafter, a set of profiles was sampled from V1 at locations in the cortex that had a curvature within 1 SD of the mean curvature and that had a thickness of ± 0.5 SD of the mean thickness. The individual profiles in the set were aligned using the ‘ptw' package available in R [11], and then averaged (Fig 2b). This averaging ensures that the loss of SNR caused by deconvolution is (partially) restored.
A bootstrap analysis was applied to assess the stability of the shape of the computed profile (see Fig 1c for details).
Results
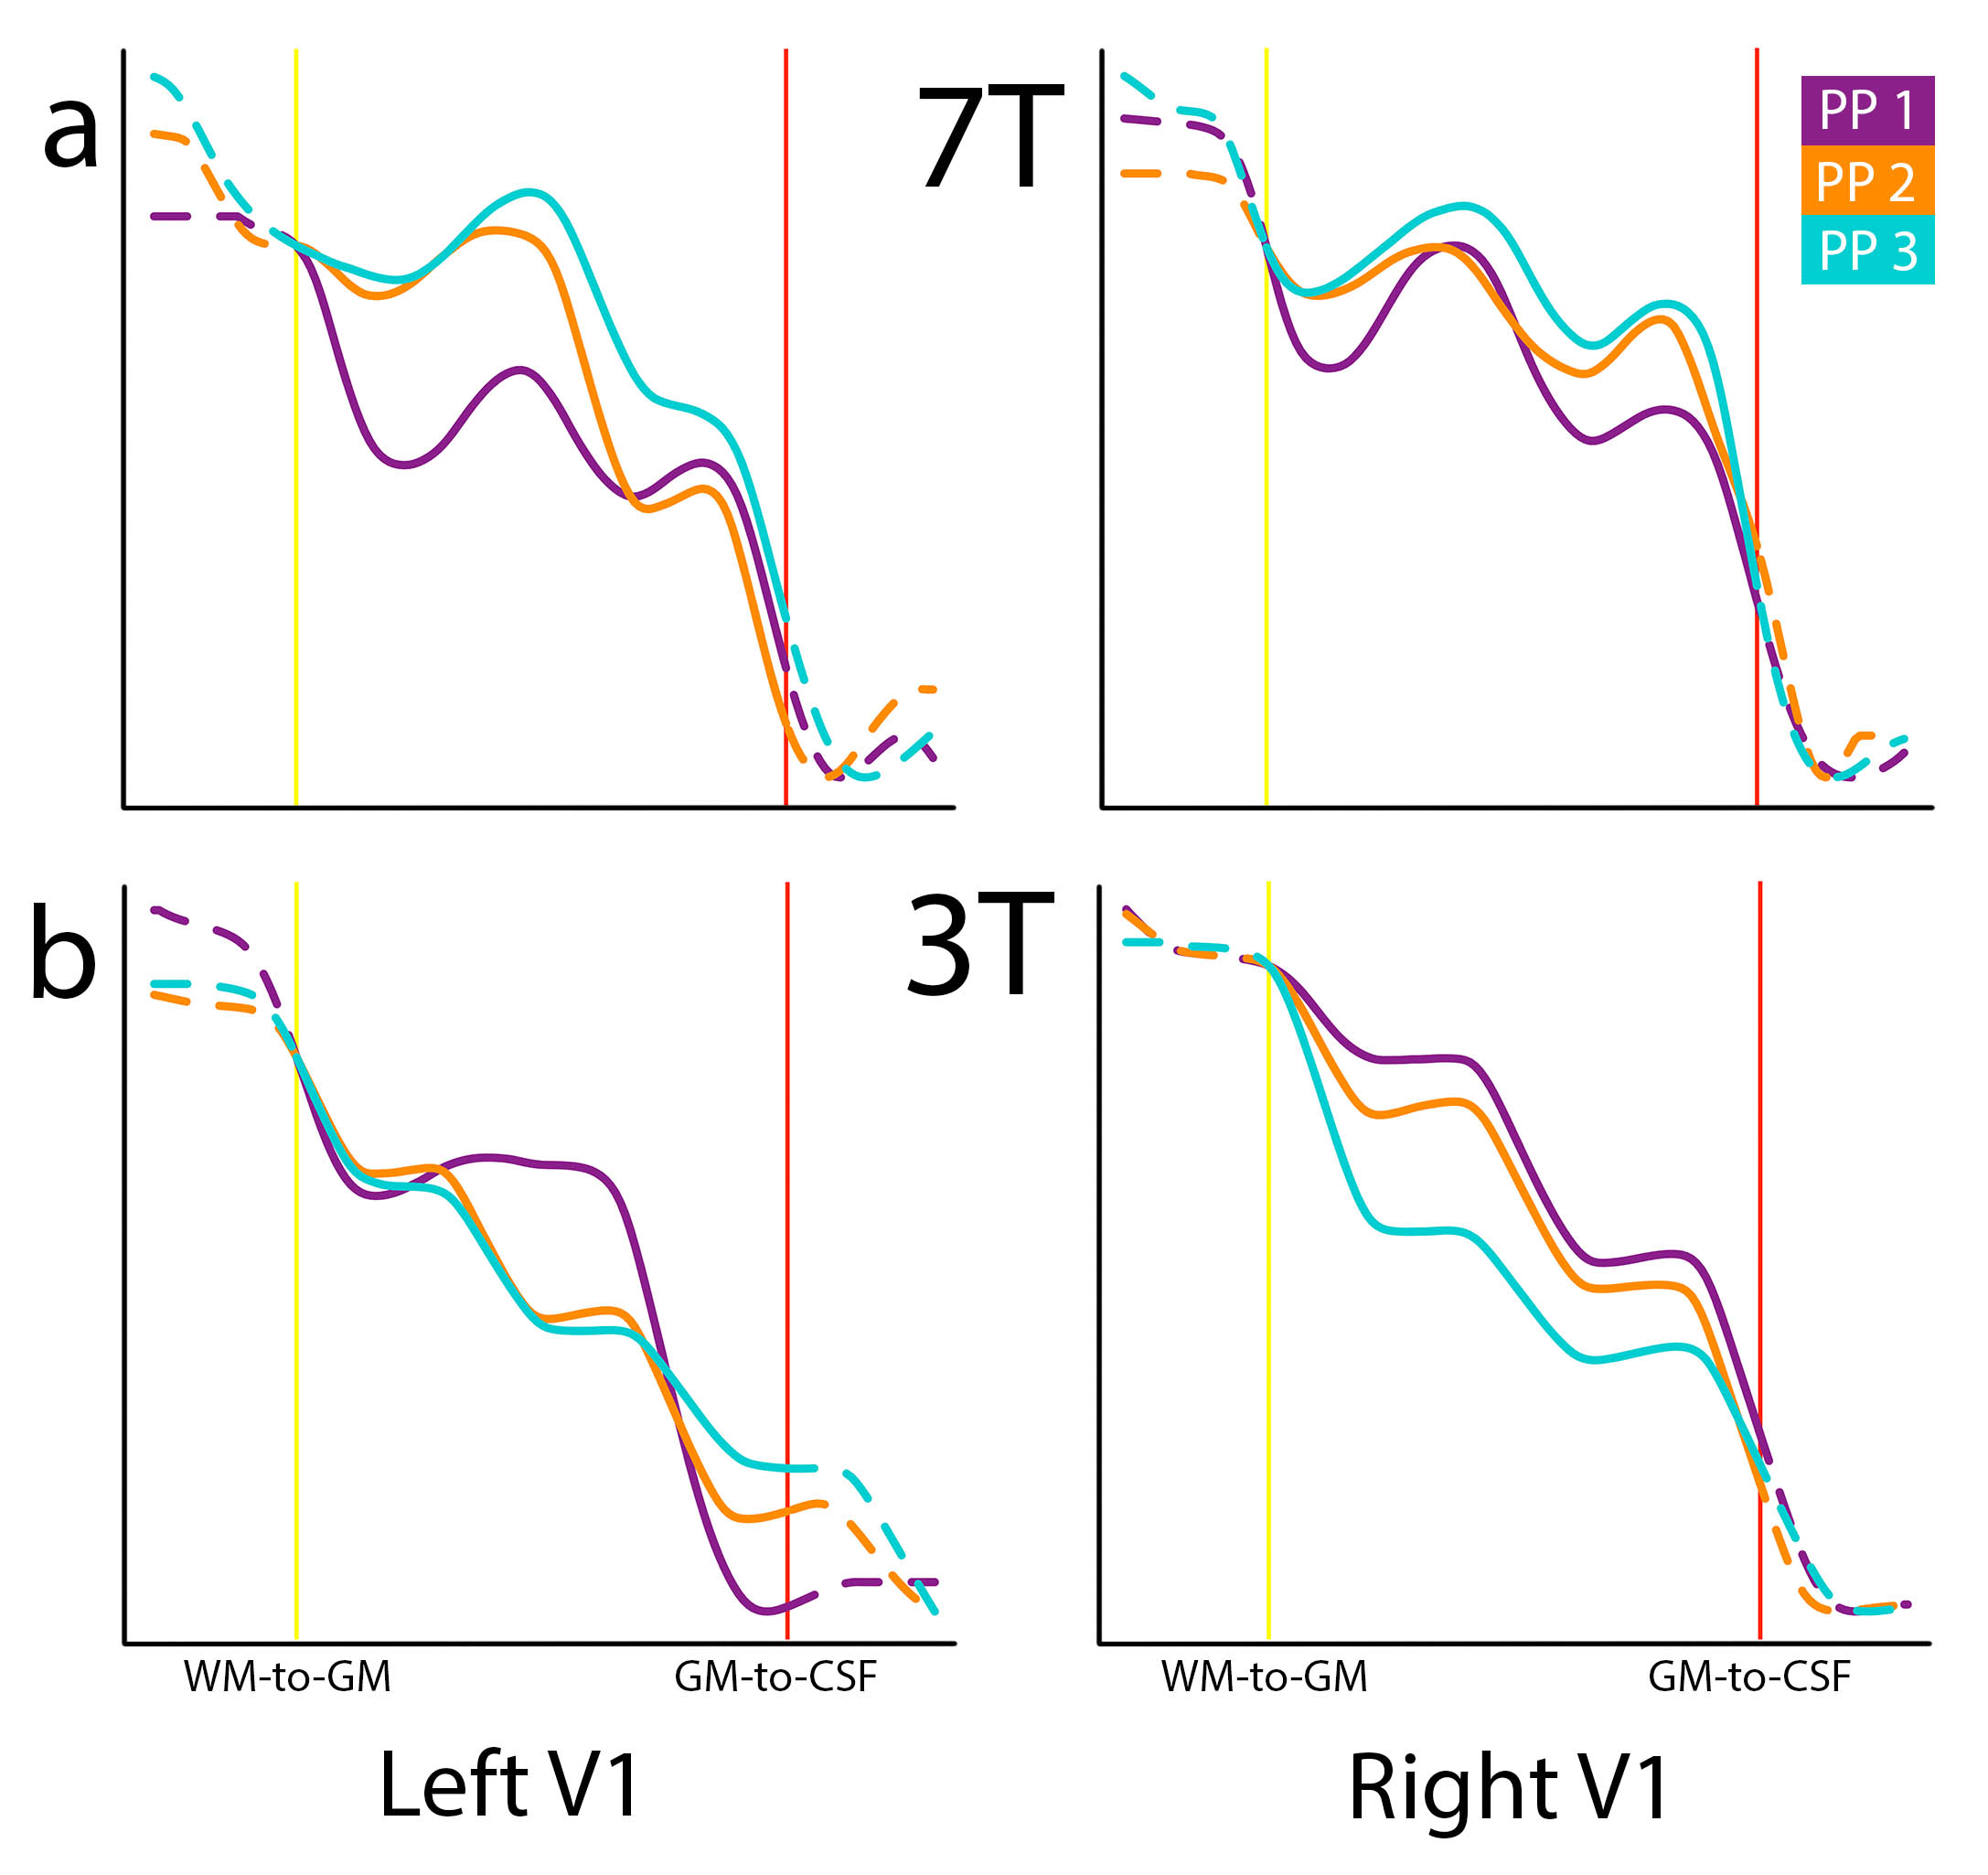
Fig 2 shows laminar profiles for three participants, sampled from 7T volumes (2a) and 3T volumes (2b), showing similar features. The outcome of the bootstrap analysis (Fig 1c) shows the stability of features of profiles drawn from V1.Discussion
The method presented, i.e. sampling profiles from deconvoluted volumes and applying alignment to those profiles, yields laminar profiles containing similar features for both 3T T1-weighted and 7T myelin-sensitive T1-weighted volumes. A bootstrap analysis suggests that the method’s output is stable. As T1-weighted signal intensity putatively reflects local myelin content, features present in profiles may be indicative of the relative organization of layers. Area V1 contains a heavy myelinated band (Stria of Gennari) and the local maxima and minima found in the laminar profiles may reflect this anatomical feature.
This makes this new type of analysis a promising method to study cortical myeloarchitecture in vivo at conventional magnetic field strength both in health and disease.
Acknowledgements
NP: NWO VIDI grant 13339.References
[1] Van Haren, NEM, Schnack, HG, et al. Changes in Cortical Thickness During the Course of Illness in Schizophrenia. Arch Gen Psychiatry, 2011; 68(9):871–880.
[2] Wheeler, AL, Chakravarty, MM, et al. Disrupted prefrontal interhemispheric structural coupling in schizophrenia related to working memory performance. Schizophr. Bull. 2014;40(4):914–24.
[3] Xiao, Y, Lui, S, et al. Altered cortical thickness related to clinical severity but not the untreated disease duration in schizophrenia. Schizophr. Bull. 2015;41(1):201–10.
[4] Stueber, C, Morawski, M, et al. Myelin and iron concentration in the human brain: a quantitative study of MRI contrast. Neuroimage. 2014;93:95–106.
[5] Fracasso, A, Van Veluw, SJ, et al. Lines of Baillarger in vivo and ex vivo; myelin contrast across lamina at 7T MRI and histology. Neuroimage. 2016;133:163–175.
[6] Fischl, B. FreeSurfer. Neuroimage;62(2):774–81.
[7] Avants, BB, Tustison, NJ, et al. A reproducible evaluation of ANTs similarity metric performance in brain image registration. Neuroimage. 2011;54(3):2033–2044.
[8] Desikan, RS, Segonne, F, et al. An automated labeling system for subdividing the human cerebral cortex on MRI scans into gyral based regions of interest. Neuroimage. 2006;31(3):968–980.
[9] Fischl, B, Van Der Kouwe, A, et al. Automatically Parcellating the Human Cerebral Cortex. Cereb. Cortex. 2004;14(1):11–22.
[10] Wendykier, P. Parallel Iterative Deconvolution. 2009.
[11] Gerretzen, J, Eilers, P, et al. R package ‘ptw’. 2015.
Figures