4221
Disruptions in T1-weighted MRI signal trajectories over age in Bipolar Disorder Type-11Neuroscience, McMaster University, Hamilton, ON, Canada, 2Psychiatry and Behavioural Neurosciences, McMaster University, Hamilton, ON, Canada, 3Psychology, Neuroscience & Behaviour, McMaster University, Hamilton, ON, Canada
Synopsis
T1-weighted signal is known to be correlated with age and myelin content. T1-weighted images with optimized intracortical contrast were taken in subjects aged 17-45. The half cortical depth signal was mapped in 67 healthy controls and 43 individuals diagnosed with bipolar disorder type-1. We investigated the trajectory of the signal with age in each group and it was found that healthy signal trajectory follows a quadratic form with age, while no correlation with age was found in bipolar disorder. We have shown that it is possible to map signal trajectory changes in clinical populations across the cortex.
Purpose
MRI signals in the cortex have been shown to follow a quadratic-like trajectory over the lifespan: increasing rapidly during childhood, more slowly into adulthood, and then declining with advanced age 1-4.This trajectory coincides with cortical myelin development 5. The MRI signal changes are thought to be correlated with intracortical myelin levels, as demonstrated by spatial correlated measures of MR parameters and myelin in combined MRI/histology studies 6-8. Previous data has suggested that there is a loss of intracortical myelin in the dorsal lateral prefrontal cortex in bipolar disorder (BD) using both MRI 9 and histology 10. The purpose of this study was to use T1-weighted MRI to investigate trajectories in intracortical myelin levels across the whole brain in a large, well-characterized cohort of healthy controls and BD type-1 subjects.Methods
T1-weighted, 1mm isotropic images were collected on a 3T GE scanner. Subjects were in the age range of 17-45 years old. Images were collected in 43 subjects diagnosed with BD type-1 and 67 healthy individuals. The T1-weighed sequence used to collect images was previously optimized for intracortical myelin contrast 9,11. Processing was performed using CBS High-Res Brain Processing tools (www.nitrc.org/projects/cbs-tools/) in MIPAV (mipav.cit.nih.gov). The T1-weighted signal was analyzed using a surface based approach at the middle depth of the cortex. Each subject’s surface was registered to the middle depth of the MNI-152 atlas using a multi-modal surface registration approach 12. The MarsAtlas 13 was used to parcellate the cortex into 82 regions for analysis. Five ROIs per hemisphere (ten total) were not analyzed due to poor signal intensity profiles arising from topological errors in segmentations (isthmus of cingulate, insula and regions of occipital and temporal lobe). The remaining regions were fit with general linear models in each group with either linear:
T1-weighted signal = Gender + Age + Constant
or quadratic age terms:
T1-weighted signal = Gender + Age +Age2+ Constant
to determine the best model for the signal trajectory.
Results
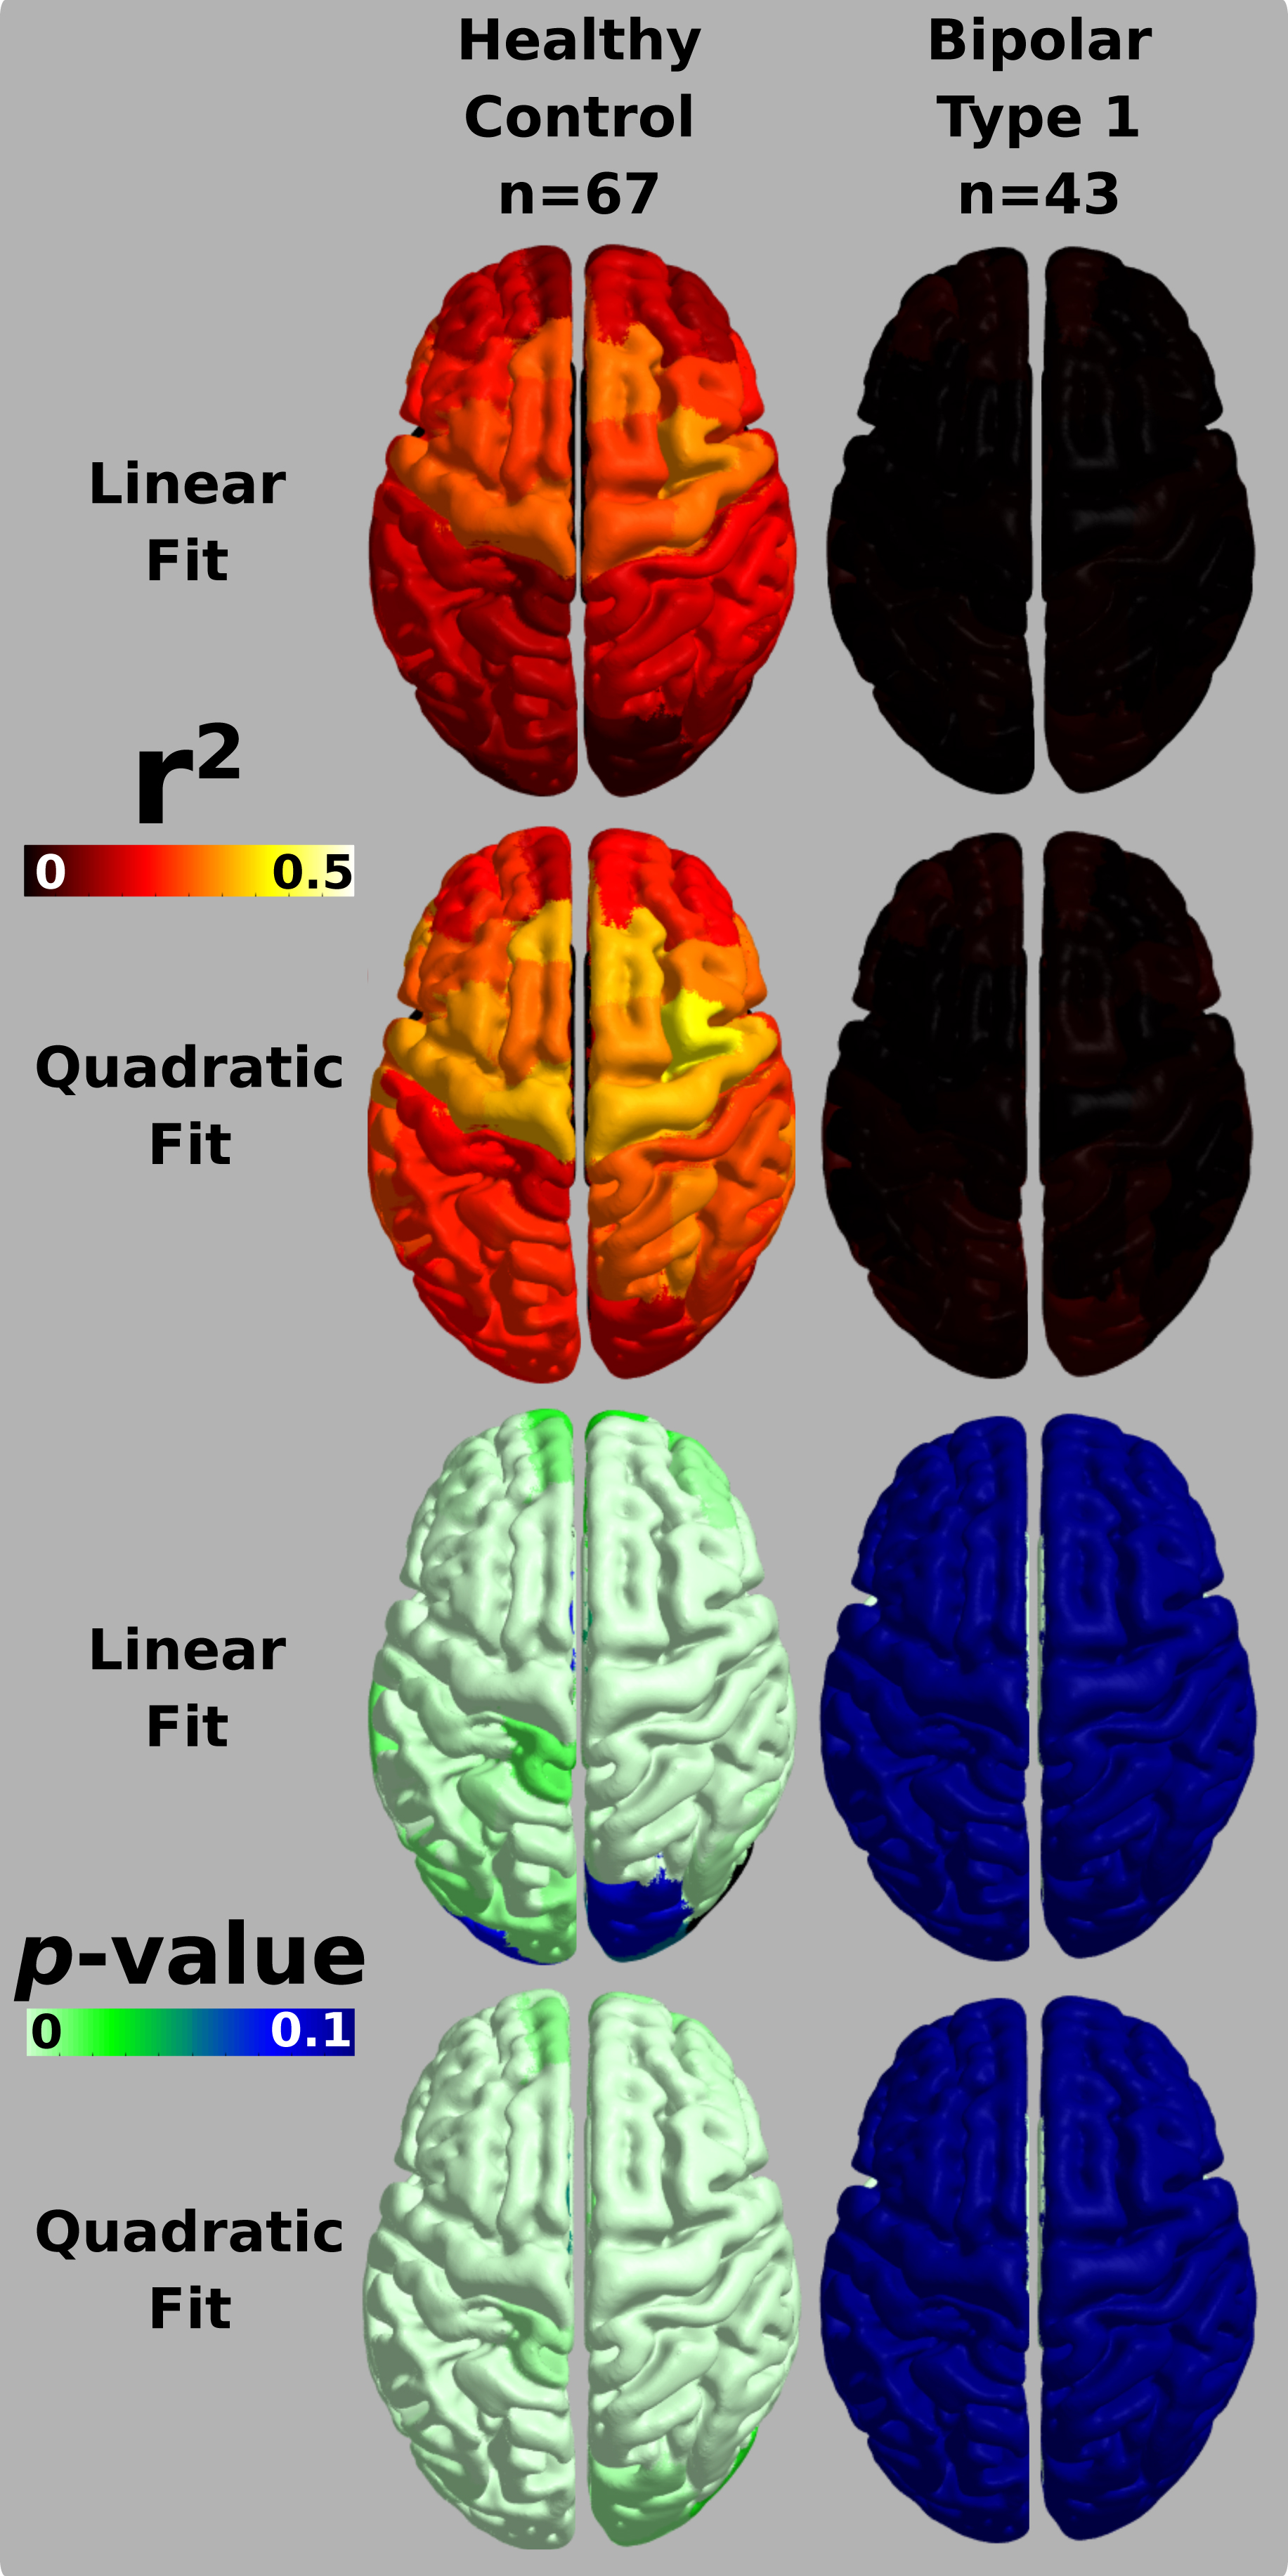
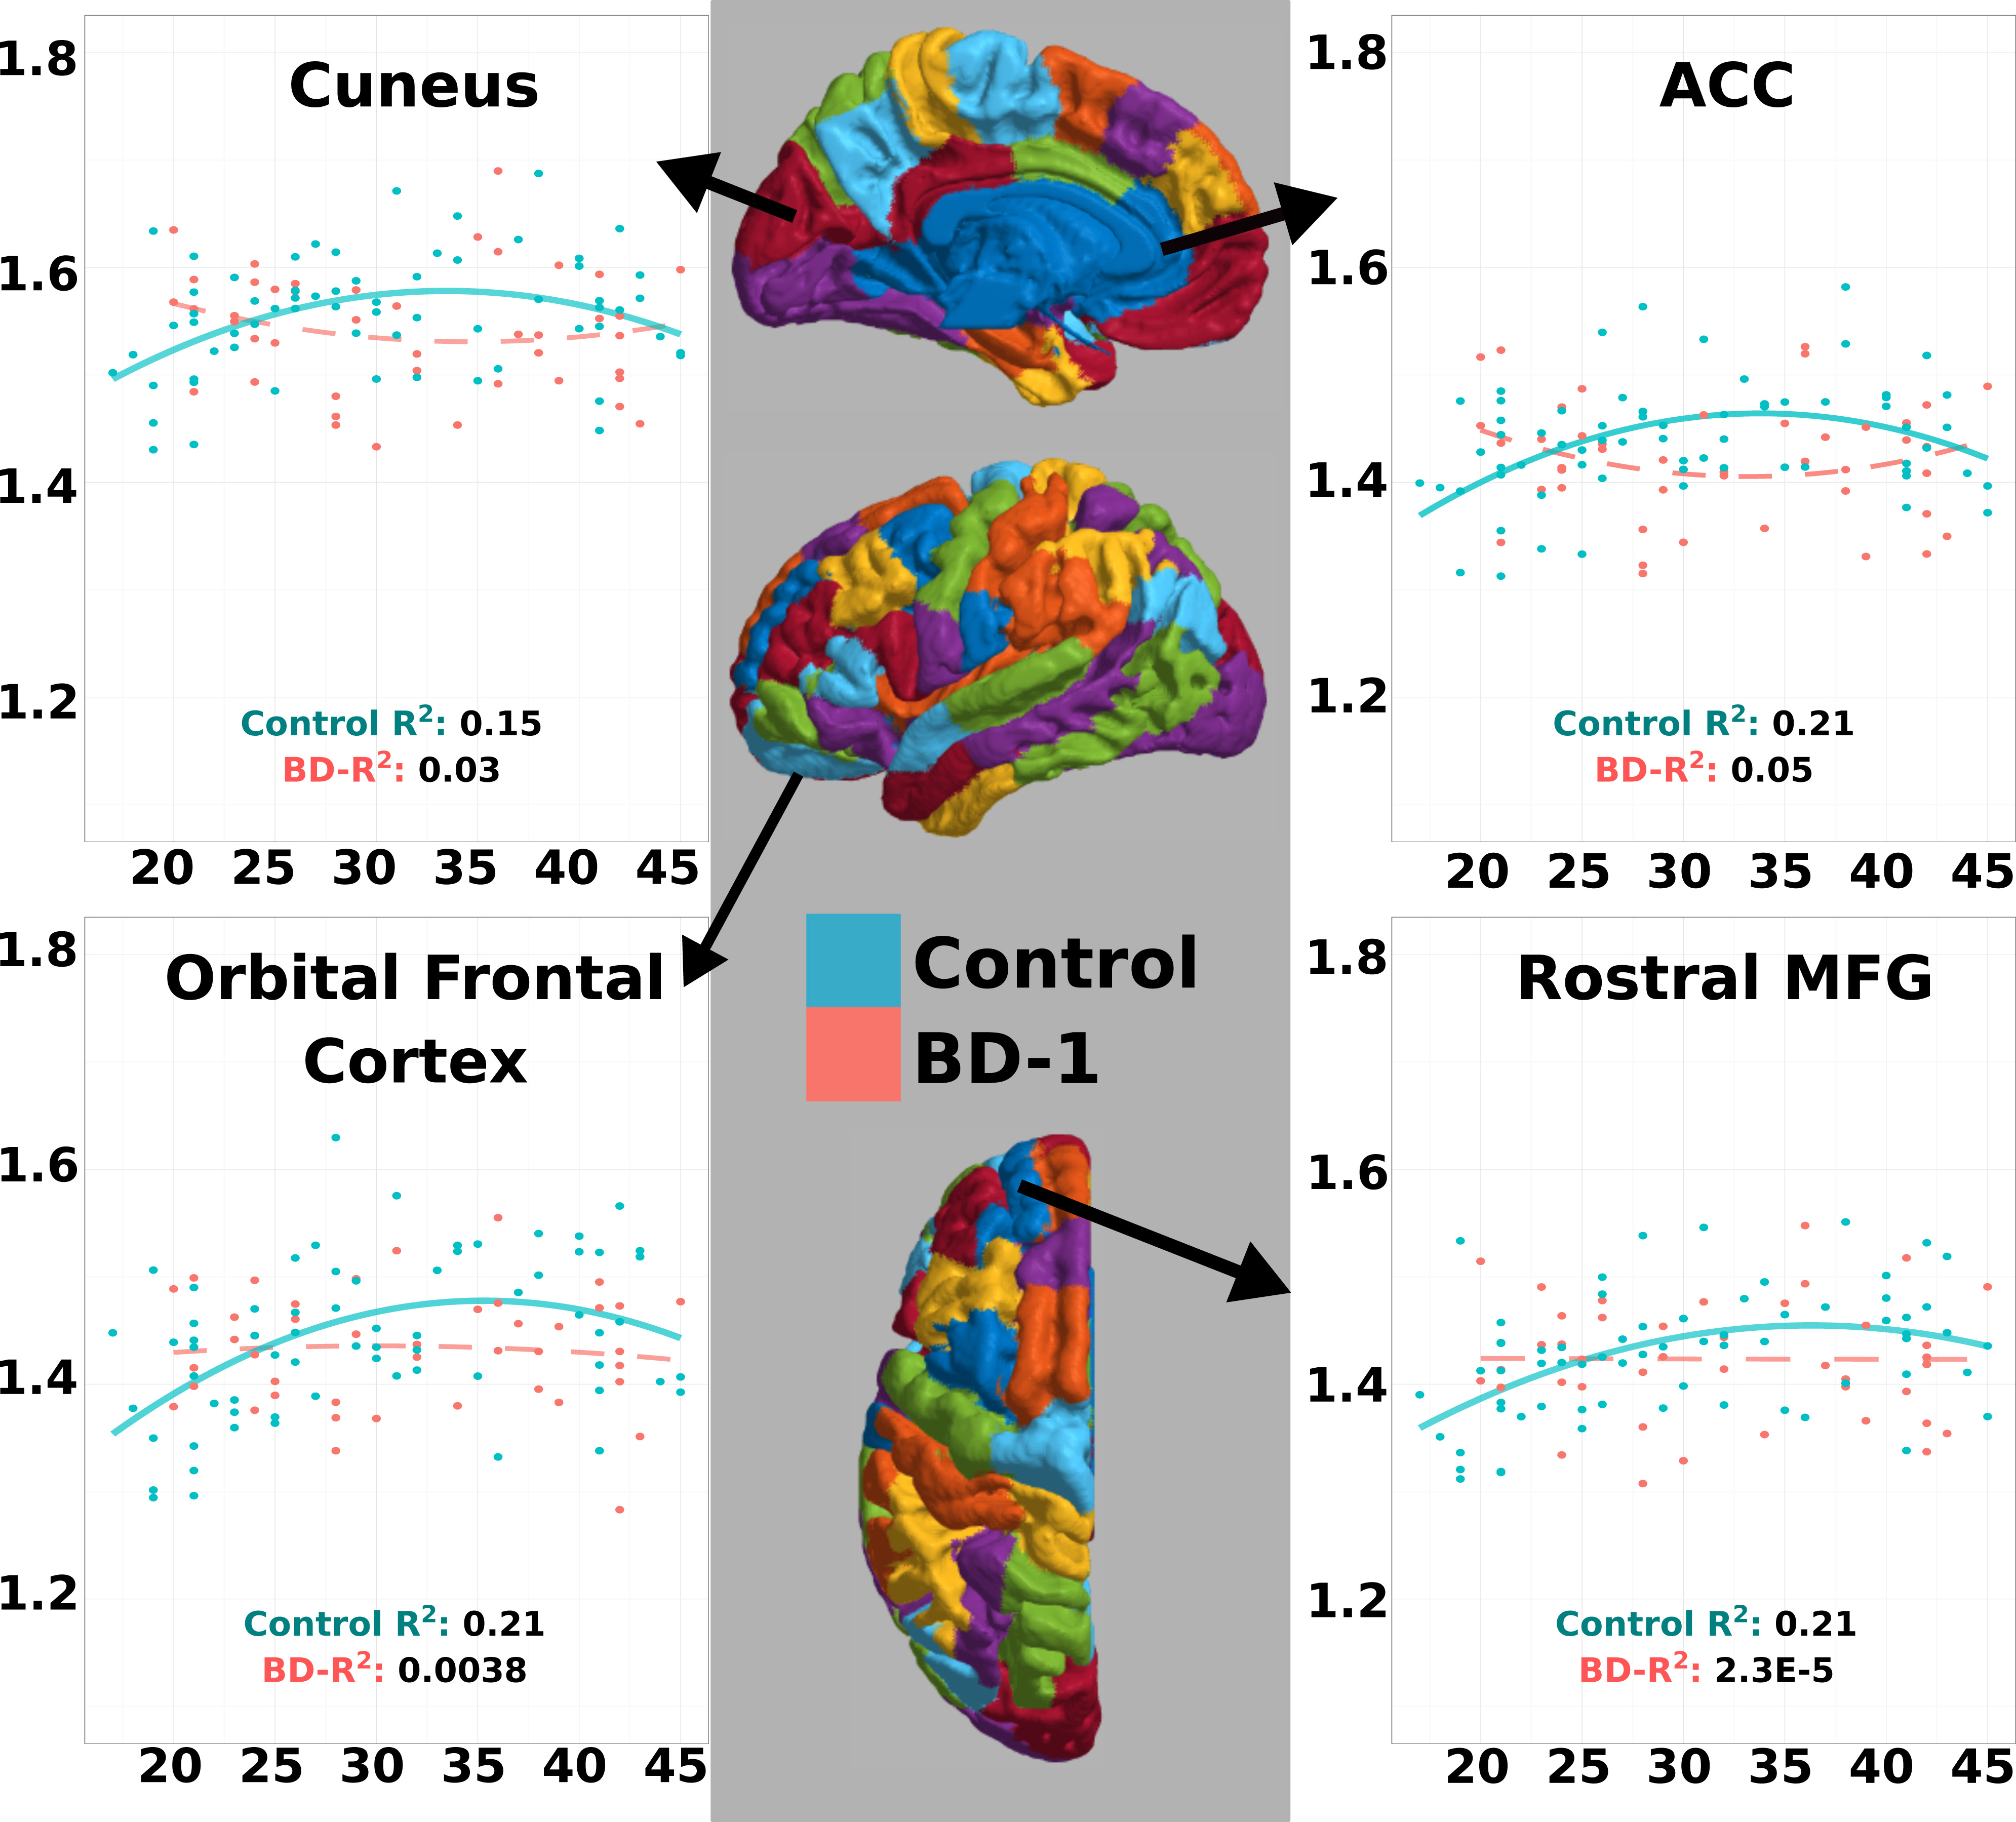
Gender was an insignificant predictor in either model (p<0.05), so it was not included in the final analysis. The quadratic model was determined a superior fit in controls over linear fits using Akaike information criterion followed by a chi square test (p<0.05 Bonferonni corrected). Neither model was significant in BD type-1 (p>0.05) (see Figure 1). This result signifies that there is no correlation between age and T1-weighted signal in BD type-1 in this age range, suggesting that healthy intracortical myelin trajectories are disrupted in this disorder. Figure 2 illustrates signal changes over the age range in regions that have been previously implicated in BD through cortical thickness decreases 9,14-18. In all regions we can see the blue control line follows a quadratic form, peaking around age 35. While there was no significant correlation in BD type-1 and age, in the cuneus and anterior cingulate cortex (ACC) the fit line follows a slightly curved quadratic that is flipped from the controls and the fit line in the rostral middle frontal gyrus (MFG) and orbital frontal cortex, takes a flat line over this age range.Discussion
Our data in healthy subjects reiterates findings that suggest that intracortical myelin trajectories follows an inverted 'U' trajectory with age 2,3. The lack of correlation between T1-weighted signal and age in BD suggests a disruption in the trajectory of intracortical myelin over the age range of 17-45 years old. This disruption in development occurred in all regions we analyzed, which could suggest a global cortical effect on the myelin development in BD type-1. From our data we can see that the difference between subject groups’ T1-weighted signal could be maximally identified around 35 years old; this is where a cross sectional study would have the greatest chance of finding differences. Our results further suggest that T1-weighted signal analysis may prove a useful tool in investigating other clinical populations with suspected disruptions in intracortical myelin. Schizophrenia may be another clinical population that could be studied using this technique as there are suspected changes in myelin 19, and changes in MRI signal have already been reported 20.Conclusion
We have demonstrated using T1-weighted signal analysis, that it is possible to investigate myelin trajectory changes in clinical populations.Acknowledgements
This project was supported by a 2014 NARSAD Independent Investigator Grant from the Brain & Behavior Research Foundation (Dr. Frey).References
1. Franke K, Ziegler G, Klöppel S, Gaser C, Initiative TADN. Estimating the age of healthy subjects from T1-weighted MRI scans using kernel methods: Exploring the influence of various parameters. NeuroImage. 2010;50(3):883-892. doi:10.1016/j.neuroimage.2010.01.005.
2. Grydeland H, Walhovd KB, Tamnes CK, Westlye LT, Fjell AM. Intracortical Myelin Links with Performance Variability across the Human Lifespan: Results from T1- and T2-Weighted MRI Myelin Mapping and Diffusion Tensor Imaging. Journal of Neuroscience. 2013;33(47):18618-18630. doi:10.1523/JNEUROSCI.2811-13.2013.
3. Westlye LT, Walhovd KB, Dale AM, et al. Differentiating maturational and aging-related changes of the cerebral cortex by use of thickness and signal intensity. NeuroImage. 2010;52(1):172-185. doi:10.1016/j.neuroimage.2010.03.056.
4. Bartzokis G, Lu PH, Tingus K, et al. Lifespan trajectory of myelin integrity and maximum motor speed. Neurobiology of Aging. 2010;31(9):1554-1562. doi:10.1016/j.neurobiolaging.2008.08.015.
5. Dobbing J, Sands J. Quantitative growth and development of human brain. Arch Dis Child. 1973;48(10):757-767. doi:10.1136/adc.48.10.757.
6. Bock NA, Kocharyan A, Liu JV, Silva AC. Visualizing the entire cortical myelination pattern in marmosets with magnetic resonance imaging. Journal of Neuroscience Methods. 2009;185(1):15-22. doi:10.1016/j.jneumeth.2009.08.022.
7. Eickhoff S, Walters NB, Schleicher A, et al. High-resolution MRI reflects myeloarchitecture and cytoarchitecture of human cerebral cortex. Hum Brain Mapp. 2005;24(3):206-215. doi:10.1002/hbm.20082.
8. Stüber C, Morawski M, Schäfer A, et al. Myelin and iron concentration in the human brain: A quantitative study of MRI contrast. NeuroImage. 2014;93:95-106. doi:10.1016/j.neuroimage.2014.02.026.
9. Rowley CD, Bazin P-L, Tardif CL, et al. Assessing intracortical myelin in the living human brain using myelinated cortical thickness. Front Neurosci. 2015;9:396. doi:10.3389/fnins.2015.00396.
10. Lake EMR, Steffler EA, Rowley CD, et al. Altered intracortical myelin staining in the dorsolateral prefrontal cortex in severe mental illness. Eur Arch Psychiatry Clin Neurosci. September 2016:1-8. doi:10.1007/s00406-016-0730-5.
11. Bock NA, Hashim E, Janik R, et al. Optimizing T1-weighted imaging of cortical myelin content at 3.0T. NeuroImage. 2013;65:1-12. doi:10.1016/j.neuroimage.2012.09.051.
12. Tardif CL, Schäfer A, Waehnert M, Dinse J, Turner R, Bazin P-L. Multi-contrast multi-scale surface registration for improved alignment of cortical areas. NeuroImage. 2015;111(C):107-122. doi:10.1016/j.neuroimage.2015.02.005.
13. Auzias G, Coulon O, Brovelli A. MarsAtlas: A cortical parcellation atlas for functional mapping. Hum Brain Mapp. 2016;37(4):1573-1592. doi:10.1002/hbm.23121.
14. Foland-Ross LC, Thompson PM, Sugar CA, et al. Investigation of cortical thickness abnormalities in lithium-free adults with bipolar I disorder using cortical pattern matching. Am J Psychiatry. 2011;168(5):530-539. doi:10.1176/appi.ajp.2010.10060896.
15. Lyoo IK, Sung YH, Dager SR, et al. Regional cerebral cortical thinning in bipolar disorder. Bipolar Disord. 2006;8(1):65-74. doi:10.1111/j.1399-5618.2006.00284.x.
16. Elvsåshagen T, Westlye LT, Bøen E, et al. Bipolar II disorder is associated with thinning of prefrontal and temporal cortices involved in affect regulation. Bipolar Disord. 2013;15(8):855-864. doi:10.1111/bdi.12117.
17. Bootsman F, Brouwer RM, Schnack HG, et al. Genetic and environmental influences on cortical surface area and cortical thickness in bipolar disorder. Psychol Med. 2014;45(01):193-204. doi:10.1017/S0033291714001251.
18. Oertel-Knöchel V, Reuter J, Reinke B, et al. Association between age of disease-onset, cognitive performance and cortical thickness in bipolar disorders. Journal of Affective Disorders. 2015;174(C):627-635. doi:10.1016/j.jad.2014.10.060.
19. Bartzokis G, Lu PH, Stewart SB, et al. In vivo evidence of differential impact of typical and atypical antipsychotics on intracortical myelin in adults with schizophrenia. Schizophrenia Research. 2009;113(2-3):322-331. doi:10.1016/j.schres.2009.06.014.
20. Jørgensen KN, Nerland S, Norbom LB, et al. Increased MRI-based cortical grey/white-matter contrast in sensory and motor regions in schizophrenia and bipolar disorder. Psychol Med. 2016;46(9):1971-1985. doi:10.1017/S0033291716000593.
Figures